Historical Redlining and Present-Day Nonsuicide Firearm Fatalities
- Dholakia, Ayesha MD
- Burdick, Kendall J. MD
- Kreatsoulas, Catherine MSc, PhD
- Monuteaux, Michael C. ScD
- Tsai, Jennifer MD, MEd
- Subramanian, S. V. PhD
- Fleegler, Eric W. MD, MPH
Background:
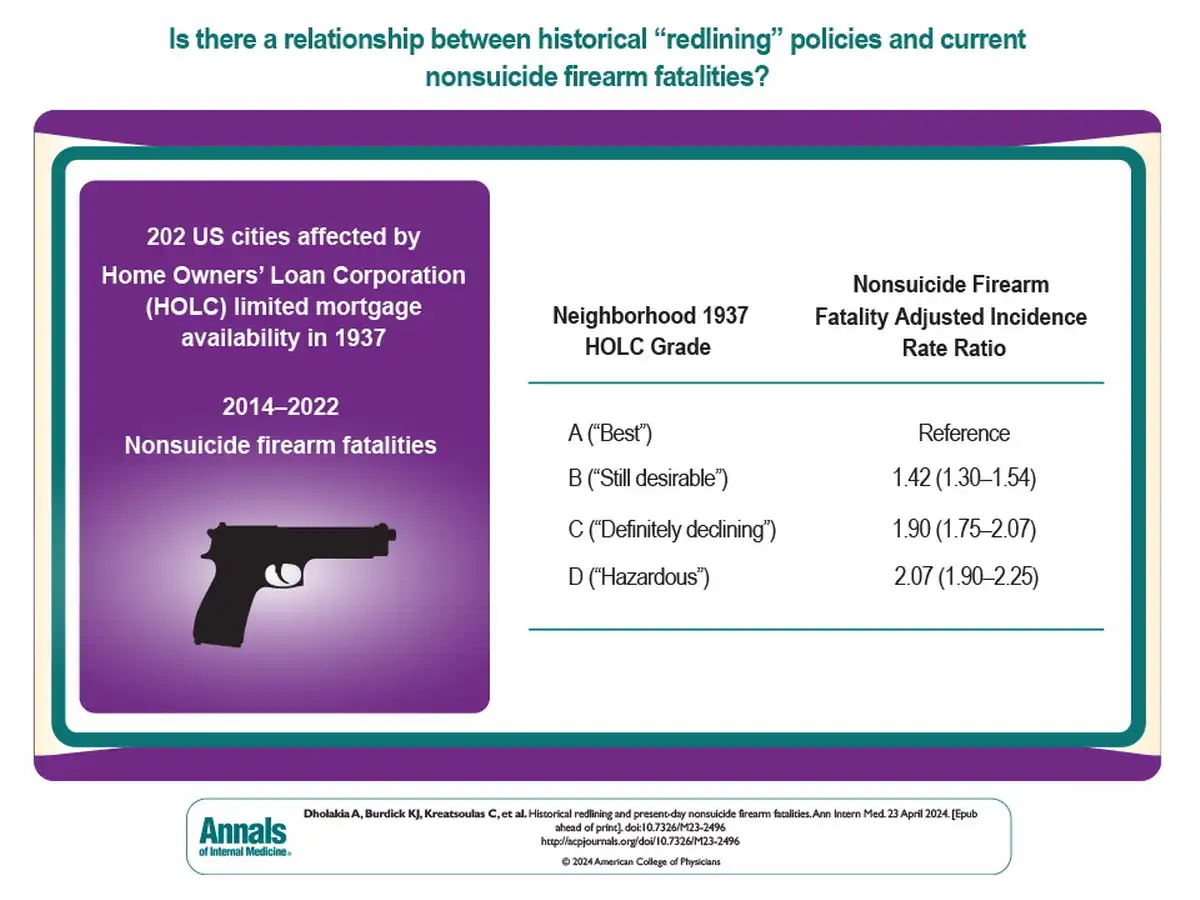
Redlining began in the 1930s with the Home Owners' Loan Corporation (HOLC); this discriminatory practice limited mortgage availability and reinforced concentrated poverty that still exists today. It is important to understand the potential health implications of this federally sanctioned segregation.
Objective:
To examine the relationship between historical redlining policies and present-day nonsuicide firearm fatalities.
Design:
Maps from the HOLC were overlaid with incidence of nonsuicide firearm fatalities from 2014 to 2022. A multilevel negative binomial regression model tested the association between modern-day firearm fatalities and HOLC historical grading (A [“best”] to D [“hazardous”]), controlling for year, HOLC area-level demographics, and state-level factors as fixed effects and a random intercept for city. Incidence rates (IRs) per 100 000 persons, incidence rate ratios (IRRs), and adjusted IRRs (aIRRs) for each HOLC grade were estimated using A-rated areas as the reference.
Setting:
202 cities with areas graded by the HOLC in the 1930s.
Participants:
Population of the 8597 areas assessed by the HOLC.
Measurements:
Nonsuicide firearm fatalities.
Results:
From 2014 to 2022, a total of 41 428 nonsuicide firearm fatalities occurred in HOLC-graded areas. The firearm fatality rate increased as the HOLC grade progressed from A to D. In A-graded areas, the IR was 3.78 (95% CI, 3.52 to 4.05) per 100 000 persons per year. In B-graded areas, the IR, IRR, and aIRR relative to A areas were 7.43 (CI, 7.24 to 7.62) per 100 000 persons per year, 2.12 (CI, 1.94 to 2.32), and 1.42 (CI, 1.30 to 1.54), respectively. In C-graded areas, these values were 11.24 (CI, 11.08 to 11.40) per 100 000 persons per year, 3.78 (CI, 3.47 to 4.12), and 1.90 (CI, 1.75 to 2.07), respectively. In D-graded areas, these values were 16.26 (CI, 16.01 to 16.52) per 100 000 persons per year, 5.51 (CI, 5.05 to 6.02), and 2.07 (CI, 1.90 to 2.25), respectively.
Limitation:
The Gun Violence Archive relies on media coverage and police reports.
Conclusion:
Discriminatory redlining policies from 80 years ago are associated with nonsuicide firearm fatalities today.
Primary Funding Source:
Fred Lovejoy Housestaff Research and Education Fund.
Redlining began in the 1930s with the Home Owners' Loan Corporation; this discriminatory practice limited mortgage availability and reinforced concentrated poverty that still exists today. This study examines the relationship between historical redlining policies and present-day nonsuicide firearm fatalities.
Figure
No caption available.