1 Introduction
Protein–protein interactions (PPI) are crucial for most biological functions, and thus of great importance to understand cellular processes (). Therefore, an interest exists for discerning the mechanisms of PPI and discovering theoretical and practical applications such as in biological, biophysical and biochemical studies (; ; ). Here, we are particularly interested in the interactions between antibodies and their antigens, which can be considered as a specific form of PPI that has been shown to be very different from general interactions between proteins (). The process of antibody–antigen-binding has gathered significant attention due to the high specificity and affinity of antibodies to their target (). This property can be exploited in many areas, e.g. for the development of diagnostic tools, therapeutics and peptide-based vaccines (; ), making antibodies one of the most important biopharmaceuticals today with an ever increasing amount of antibody-based therapies being approved for clinical use ().
To facilitate the use of antibodies, it is vital to identify the distinct region on the antigen that will be recognized by an antibody; the specific amino acids of such a region are known as the epitope (). Identification of an antigen’s epitope regions and a better understanding of the mechanism of antibody–antigen-recognition will lead to improved antibody engineering and thus widen their applications in the future (). Generally, there is a distinction between continuous (linear) epitopes and discontinuous (conformational) epitopes: a continuous epitope is comprised of a single continuous stretch of amino acids, while the residues forming a discontinuous epitope are made up of several stretches in the sequence that are brought together by the protein being folded (). Linear epitopes should generally be seen as segments of (larger) conformational epitopes as structural studies did not find truly linear epitopes as of yet (; ). It is estimated that conformational epitopes make up around 90% of all B-cell epitopes ().
Large scale experimental epitope identification is not feasible as this process is time-consuming and costly (). As a consequence, many efforts have been devoted to developing computational methods for prediction of epitopes instead, aiming to predict continuous or discontinuous epitopes, or both. Linear epitope predictors can be of use if the objective is to substitute a protein antigen by a peptide fragment in order to develop or produce antibodies, however, the desired cross-reactivity with the native protein antigen is often limited as almost all naturally occurring epitopes are conformational (). Continuous epitope prediction can also be applied to antibody detection based on denatured proteins deprived of their 3D structure () and for the design of epitope-based vaccines ().
Discontinuous epitope prediction is more suitable to discover existing epitopes, i.e. to predict the explicit residues on the protein structure in its native fold that interact with an antibody. Such predictions can thus support immunodiagnostic and therapeutic methods that demand recognition of the natively folded protein (). showed that antibodies raised against full-length protein antigens consistently outperformed those raised against peptide antigens. Furthermore, prediction of conformational epitopes can help determine a list of epitope candidates to be confirmed by experimental testing (). An improved understanding of antibody–antigen-interactions also furthers our understanding of the immune response process in general ().
Epitope prediction tools can also be divided according to the input being structure- or sequence-based. Structure-based methods are usually able to outperform sequence-base methods in accuracy in direct comparison but are severely limited by the number of 3D protein structures available to use (). Sequence-based methods offer the critical advantage of a large volume of data being available for training. Although the amount of protein structures accessible is also growing, there is still a lack of confirmed structural data for most antibody–antigen-complexes while the number of entries for protein sequences is increasing exponentially (). To take advantage of this vast amount of information, various different implementations of sequence-based epitope predictors have been developed over the last years. So far these methods have focused almost exclusively on linear epitope prediction (; ; ; ; ; ; ; ; ; ; ; ; ), despite the uncommonness of naturally occurring truly linear epitopes.
In addition, we can also distinguish between fixed length and residue-specific epitope prediction methods. The first type, which is the majority of methods, outputs epitopes of a pre-defined length, typically between 12 and 22 amino acids. The second type of methods offers residue-specific prediction by assigning a score to each amino acid which quantifies its likelihood to be part of an epitope. Only a small number of methods provide residue specific predictions. AAPPred uses a support vector machine classifier based on amino acid pair frequency and antigenicity scales (; ). The model was trained on the linear epitope database Bcipep and randomly chosen non-epitopes taken from Swiss-Prot as well as experimental data. BepiPred-2.0 is currently the most widely used and cited method for epitope prediction (). It was trained on antibody–antigen crystal structures taken from the Protein Data Bank (PDB) and applies a random forest algorithm to assign a probability score to every residue. Discontinuous epitope prediction from sequence is currently possible using CBTOPE (). This method uses support vector machines to calculate a score for each amino acid that assesses its propensity to be part of a conformational epitope. As the field of sequence-based predictors of conformational epitopes is so limited, a strong need exists for new tools able to support the identification of the specific residues of a protein antigen interacting with its antibody. Here we focus on a predictor that can achieve accurate identification of residues that constitute the antigen’s epitope(s).
Previously, we developed a generic PPI predictor, that makes predictions on a per residue basis. This resulted in a widely usable interface predictor that only requires a single sequence as input (, ). It is based on a random forest model and incorporates several features that can be derived from the sequence, including conservation (; ), predicted secondary structure (; ) and solvent accessible area (; ), and as novel features protein length (, ) and predicted backbone flexibility (; , ). Here, we investigate if this approach using random forest models with these features, and the combination of epitope data and general PPI datasets, can help to make epitope prediction more accurate.
Antibody–antigen interaction differs strongly from other PPI, hence if we want to use PPI prediction methods for the purpose of epitope prediction adaptation is required (; ). In order to determine which type of data should be included to re-train our prediction approach, we first investigated the predictive performance of RF models previously trained on homodimer and heterodimer PPI datasets (, ). We then assembled a new antibody–antigen-interface dataset, specifically using conformational epitopes derived from structural data to optimize the prediction of this type of epitope by the model. This dataset was used to train our new epitope predictor SeRenDIP-CE: Sequence-based RanDom forest Interface Predictor for Conformational Epitopes, which aims to predict residues that have the potential to bind an antibody, and therefore be part of an epitope.
2 Materials and methods
For clarity, we here summarize the training and testing protocols used to derive our random forest classifiers, following the procedure developed previously (, ), and also the details of constructing the Dset_anti dataset for sequence-based epitope prediction.
2.1 Dataset
The SAbDab structural antibody database from the Oxford Protein Informatics Group (OPIG) () was used to obtain the antibody–antigen structures as our starting dataset. PDB (Protein Data Bank) structures of antibody–antigen complexes were selected. The sequence of each antigen chain was extracted from PDB files. CDhit () was used to remove redundancy among all antigen sequences using 25% sequence identity (seq. ID) cut-off to obtain a non-redundant dataset of 311 antigen sequences. To evaluate the performance of our homodimer and heterodimer predictors developed previously, we further removed redundant sequences at 25% seq. ID between the antigen dataset and our homodimer and heterodimer datasets, retaining 280 antigen sequences ( residues) as our antigen dataset: Dset_anti, see Supplementary Table S1 for a list of PDB IDs for all proteins included, and Supplementary Table S2 for an overview of X-ray resolutions. Dset_anti is available for download from www.ibi.vu.nl/programs/serendipwww/.
For a fair comparison with other state-of-the-art predictors, we downloaded the training set of conformational epitopes from BepiPred-2.0 () and CBTOPE () and removed sequences from our five test datasets redundant with their training sets at a cutoff of 25% seq. ID. The number of proteins retained in each test set are reported in Supplementary Table S3.
2.2 Generation of protein sequence features
For each antigen sequence, we obtained the 172 features per position across the query sequence, as previously described (, ). In short, for each input sequence, PSI-BLAST (version 2.2.22+; , ; Schäffer et al., ) was used to retrieve sequence homologs from the NR70 database using max. 3 iterations, an E-value threshold of and max. 500 hits. Multiple Sequence Alignments (MSAs) of the query sequence and its PSI-BLAST hits were made using Muscle (), and profiles for each of the hit sequences were generated by re-mastering from the MSA (). The resulting profiles were then used as input to NetSurfP to predict solvent accessibility (RSA, ASA) and secondary structure (PA, PB, PC). Sequence entropy values (Entropy) were calculated at each column of the MSA to quantify the conservation for each position of the query sequence. Backbone flexibility scores were predicted using Dynamine (DM) ().
For each of the six features (RSA, ASA, PA, PB, PC, DM, but not length or Entropy), in addition to the query value, the average and standard deviation of values for the homologs in the alignment were also used, resulting in twelve additional features. A fixed nine residue sliding window was implemented to include the same features from neighboring residues, leading to a total of features. All features used are listed in Supplementary Table S5, for more detail, please refer to .
2.3 Definition of epitope and buried residues
Epitope residues were defined based on the distance between atoms in the antibody and antigen; when this is less than 6.0 Å it is assumed that the antigen residues are interacting with the antibody. This approach was used for all 280 antigens, resulting in epitope residues and non-epitope residues. We define buried residues as those having less than 5% or 25% relative solvent accessible area (RSA) according to DSSP ().
2.4 Training and validation procedure
We used a nested setup with an outer testing loop, and an inner validation loop, as shown in Supplementary Figure S1. In the outer loop, to obtain a reliable and stable prediction, and to avoid over-fitting and biases in the training set, we randomly split the 280 proteins of the antigen dataset Dset_anti into 80% training (224) and 20% test (56) sets and repeated this five times. Thus, we retained five coupled training and test sets. Using these, five separate random forest predictors were trained with all features derived and predicted from the antigen sequences to generate the epitope predictor. The inner 10-fold cross validation was implemented to allow simultaneous model and hyperparameter selection, with nine folds as the inner-training set and one fold for validation (Supplementary Fig. S1).
The Random Forest R-package () was used to construct the predictors. The number of variables randomly sampled at each split of the forest is defined by the global parameter mtry; during inner-loop validation the mtry value with the best AUC-ROC was selected by a grid search over a set interval of values from one to 20 for Dset_anti training, and one to 100 for Hetero+Dset_anti training, to retain the compensation of dataset noise at larger mtry, while avoiding overtraining at too large mtry. Resulting (hyper) parameters are listed in Supplementary Table S4. The cross-validation and parameter tuning were done using the caret R-package (). The final model was then fitted on the whole inner-training dataset using the fixed best mtry. The 10-fold cross validation was done 3 times with random seeds. The ratio of epitope to other positions is about 1:10 ( versus ), which we balanced by downsampling the majority class (non-epitope) in our training dataset to ensure the same frequency (1:1) between the classes. Downsampling is suggested by others () and also outperformed oversampling in our previous work (). Feature importance was measured using the MeanDecreaseGini function in the caret R-package, which measures variable importance based on the Gini impurity index ().
2.5 Testing and benchmarking
We evaluated our trained models on Dset_anti test (Supplementary Fig. S1). The conformational epitope evaluation set of five antigen proteins from BepiPred-2.0 () was used as another independent test; for fair comparison, for each protein only models were used with no redundant sequences in their training set at 25% Seq. ID.
We used the measures as before (, ). Average (mean) and standard deviation of each metric, across the five trained predictors, were computed for comparison with other approaches. We also evaluated the performance of our previously derived homodimeric and heterodimeric predictors on our epitope Dset_anti test sets. Here, true positives (TP) are correct prediction of epitope residues, false positives (FP) are residues incorrectly predicted as epitope, true negatives (TN) designate non-interacting sites that were recognized, and false negatives (FN) are epitope sites which were predicted as non-epitope. Two ways of scoring were considered: epitope versus the whole protein, or epitope versus other surface residues, i.e. disregarding buried residues as negatives.
Precision (Positive Predictive Value, PPV) TP/(TP+FP)
Recall (True Pos. Rate, TPR, Sensitivity, Coverage) TP/(TP+FN)
F1 Precision × Recall/(Precision + Recall)
Specificity (True Negative Rate, TNR) TN/(TN+FP);
Error ( Specificity, False Positive Rate, FPR) FP/(TN+FP)
Accuracy (TP+TN)/(TP+FN+TN+FP)
Balanced accuracy (BACC) (TPR + TNR)/2
AUC-ROC: area under the cuve of the ROC plot (see below)
We furthermore explored the models’ predictions using Receiver-Operator Characteristics (ROC; TPR versus FPR) and Precision/Recall (P/R) plots.
3 Results
To benchmark epitope prediction, we extracted antigen sequence and structure data from SAbDab, yielding 280 antigens whose epitopes are determined using PDB structures. These we divided into training and test sets randomly for five times, resulting in five pairs of training and test sets which comprise our new Dset_anti. We followed the procedure developed previously (, ), as summarized above in Methods. In total, 172 features derived from sequences were used including conservation, solvent accessibility, flexibility and secondary structure (Supplementary Table S5). We then compared prediction performance among random forest models trained on these features using three datasets: homodimers, heterodimers and epitopes.
3.1 Generic PPI prediction to detect epitope interface
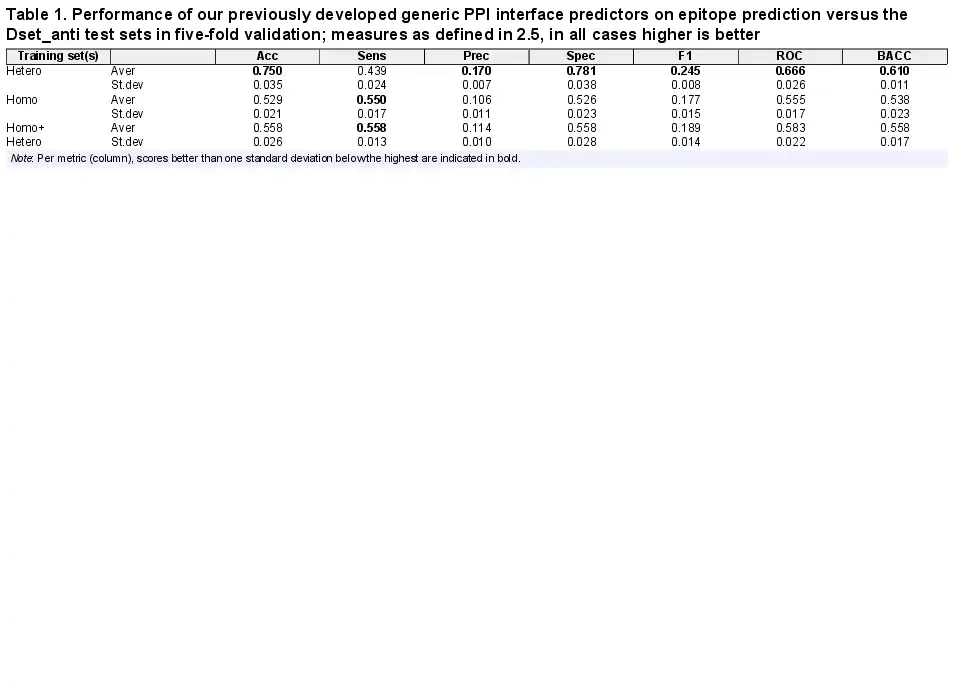
We first evaluated the performance of our existing generic PPI predictors to investigate how well these may function for epitope prediction. Table 1 shows the prediction performance of different predictors trained on generic homodimer, heterodimer and combined PPI datasets. On the Dset_anti test sets, the heterodimer PPI predictor obtained the highest AUC-ROC (0.666) compared to the other two. The combined homo/hetero PPI predictor, which performed well on the heteromeric test set (AUC-ROC 0.655, ), does not provide good predictions for the epitope test sets (AUC 0.583). Also the homodimer PPI predictor performs quite poorly (AUC 0.555). From this we could infer that heterodimer and epitope interfaces share some common patterns, while in contrast, adding homodimer data to the training seems to bring noise into the epitope prediction.
3.2 Epitope prediction using different training sets
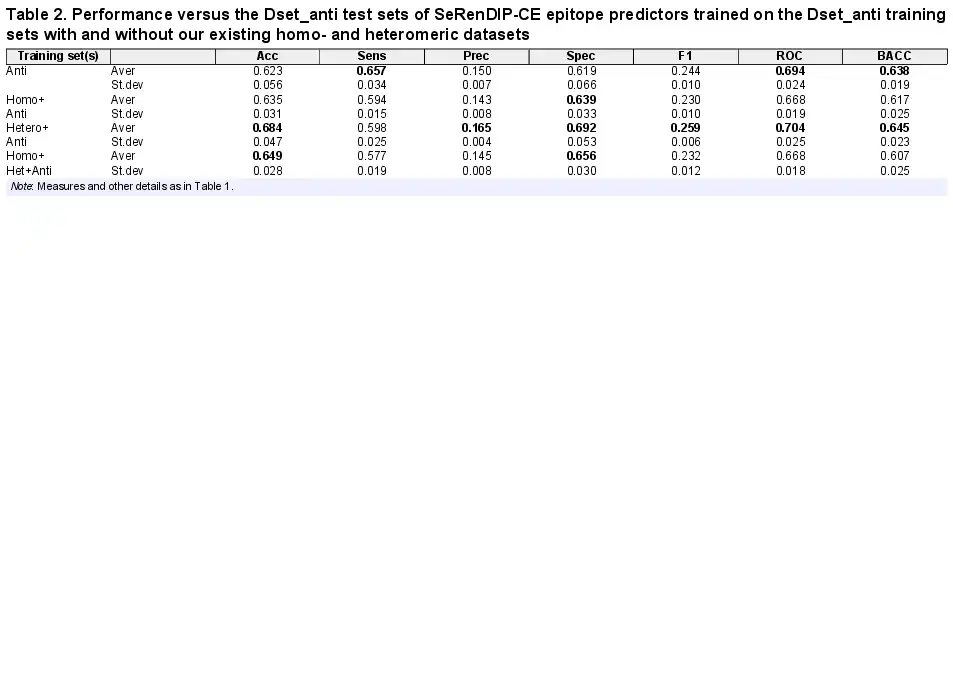
After checking the performance of the previously trained generic interface predictors (, ), we combined the antigen and homo- and heteromeric datasets to further develop a new epitope predictor. Table 2 shows the epitope prediction performance by predictors trained on the antigen dataset and in combination with the homodimer and heterodimer datasets. The ‘Antigen’ predictor performs well on epitope prediction, yielding AUC-ROC of 0.694. X-ray resolution does not influence prediction accuracy (Supplementary Fig. S2; r2 = 0.05). Adding the homodimer data for training does not increase prediction performance, similar to the ‘generic homo’ PPI prediction (Table 1). Combined training including all three datasets also failed to improve epitope prediction. Interestingly, the best performance could be obtained from the models trained on antigen and heterodimer datasets whose AUC-ROC reaches 0.704, which is consistent with high performance of the generic ‘hetero’ PPI predictor as shown in previous work (, ).
3.3 Feature importance
We considered which features were most informative for the final epitope prediction; note that all RF models include the full set of 172 features. As previously observed for our generic PPI predictors (, ), sequence length, NetSurfP predicted accessibility of the query sequence and their mean values across aligned homologs are the leading contributions also for epitope prediction, as shown in Supplementary Figure S3 which displays the importance of all 172 features by ‘mean decrease GINI’ on the random forest models.
Interestingly, Dynamine predicted flexibility scores were important to predict homodimer and heterodimer interface residues, but apparently less so for epitope prediction. Conversely, Entropy as a measure for conservation was most important for epitope prediction, less crucial for heteromeric interfaces, and least for homomeric interface prediction. Apparently, generic homodimeric interfaces differ from epitope interfaces in terms of flexibility and conservation.
To confirm the surprisingly high importance of length as a global feature for predicting local epitope residues, and to assess its relative importance compared to solvent accessibility, we also built models excluding length or/and solvent accessibility from the model features, and with only solvent accessibility (SA: RSA and ASA) features. The AUC-ROC drops from 0.694 to 0.675 without solvent accessibility. When just length is removed the performance drops even more to 0.634. Using only SA features, the AUC-ROC is 0.637. The performance of the predictors that excluded both length and accessibility features dramatically drops to 0.565 which shows the importance of length and accessibility. The std. dev. is around 0.02 in all cases, see Supplementary Table S6 for details. We also mapped the AUC of each protein onto the sequence length, showing only a weak correlation between the sequence length with the prediction performance (see Supplementary Fig. S4; ); hence, our predictors show a similar predictive power for antigens independent of their length.
3.4 Comparison with other sequence-based epitope predictors
To show that our SeRenDIP-CE models capture relevant properties of epitope interfaces, we compared our predictors with other published and available state-of-the-art sequence-based epitope prediction methods: BepiPred-1.0 and -2.0 (; ), AAPPred () and CBTOPE (). The comparison was done using our Dset_anti test sets filtered at 25% seq. ID w/r to the BepiPred-2.0 and CBTOPE training sets. Our models trained on Anti and Anti+hetero obtain highest AUC-ROC (0.716 and 0.730 resp., see Supplementary Table S3) compared to the other methods (around or below 0.6), and in the ROC plot(Fig. 1) both achieve consistently higher coverage (TPR) for any error (FPR). Furthermore, the combined predictor (hetero+antigen) achieves overall high precision in the P/R plot (Fig. 1), compared to the other approaches tested, while at a low recall, the ‘antigen’ predictor obtains highest precision.
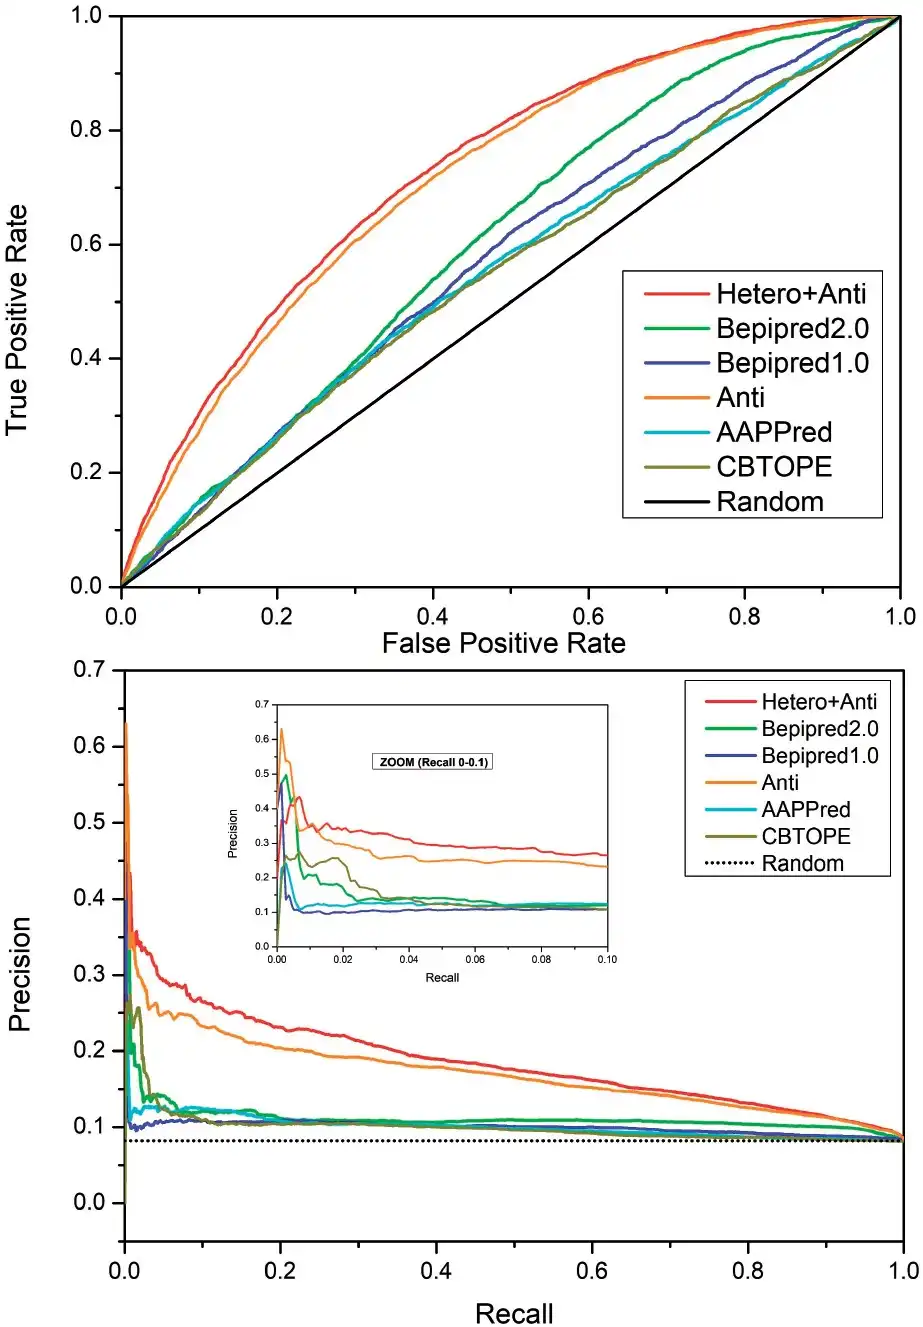
Comparison on the Dset_anti test sets with other approaches by ROC (top) and P/R (bottom) plots. ‘Hetero+Anti’ and ‘Anti’ represent our two SeRenDIP-CE approaches; state-of-the-art BepiPred-1.0, 2.0, AAPPred and CBTOPE are included for comparison; the black lines represent random performance. In both analyses we can observe that, compared to the other methods, both SeRenDIP-CE models consistently obtain higher recall for a given error in the ROC plot, and higher precision for a given recall in the P/R plot; at low recall, shown in the inset for recall 0.0—0.1 , BepiPred-2.0 and our specific ‘Antigen’ trained model both achieve highest precision
Since our most important features include solvent accessibility (Supplementary Fig. S3), we also evaluated the ability to distinguish between epitope residues and (other) surface residues, thus excluding the evaluation of buried residues; buried residues are expected to be easier. Details are summarized in Supplementary Table S8. At RSA < 5% the AUC-ROC for all methods is reduced by about 0.009–0.034 (Supplementary Fig. S5A), and much smaller differences in performance are seen in the P/R plots (Supplementary Fig. S5B and C). At RSA < 25% AUC-ROC scores are reduced somewhat more (0.014–0.051), while in all cases overall ranking of the methods remains unaffected.
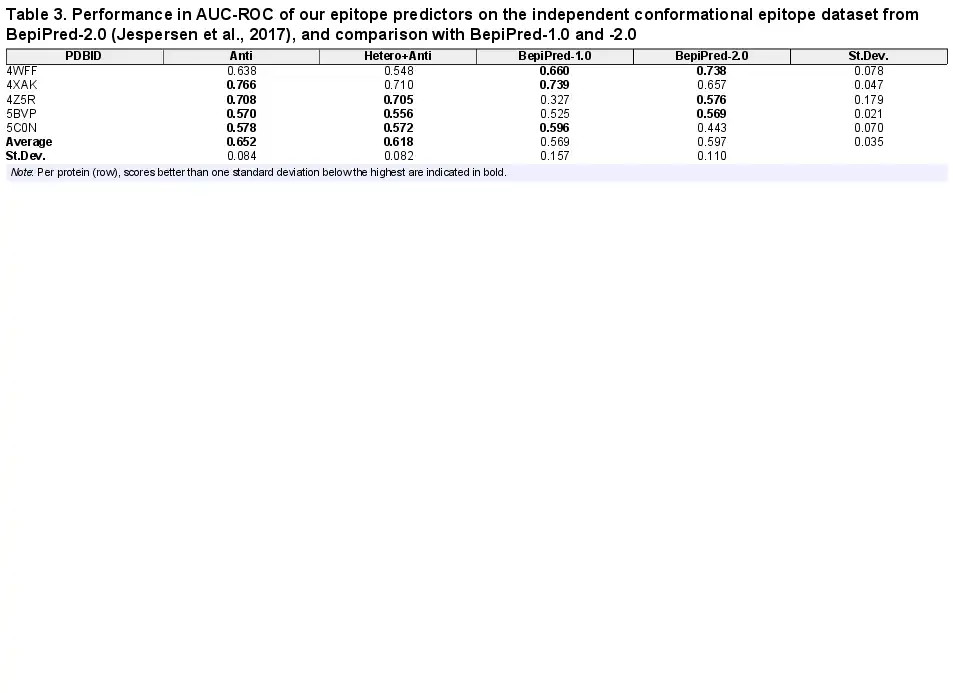
We furthermore compared our predictors with BepiPred-2.0 on their independent conformational epitope dataset (). As can be seen from Table 3, with an average AUC-ROC of 0.651 and 0.618, our two predictors perform better than BepiPred-2.0 at 0.597, which was previously reported to be the best conformational epitope predictor on their five-protein validation set ().
3.5 Application to COVID-19 virus receptor binding domain
We further evaluate our approach to the COVID-19 virus spike receptor-binding domain against the solved crystal structure complexed with a neutralizing antibody (PDB:7BZ5). The spike receptor-binding domain (chain A) was used as input sequence by our approach to compute the probability score of each amino acid being an epitope. The structural details of its structure (in cyan) and epitope region (in red) can be seen in Figure 2A, and with the antibody shown in Supplementary Figure S6. Our approach could capture most of the epitope positions solved in 7BZ5 at high probability [red in Fig. 2B and in C track ‘Prediction (%)’] and the majority of false positives locate around the real epitope (red in Fig. 2C track ‘7BZ5’). Note that our predictor is not antibody specific, hence one should interpret the predictions to show which residues have the potential to bind to an antibody. In this context, our approach is quite accurate with an AUC-ROC of 0.78 and a high precision of 56% at low recall (12%; see Supplementary Fig. S7 for ROC and P/R plots).
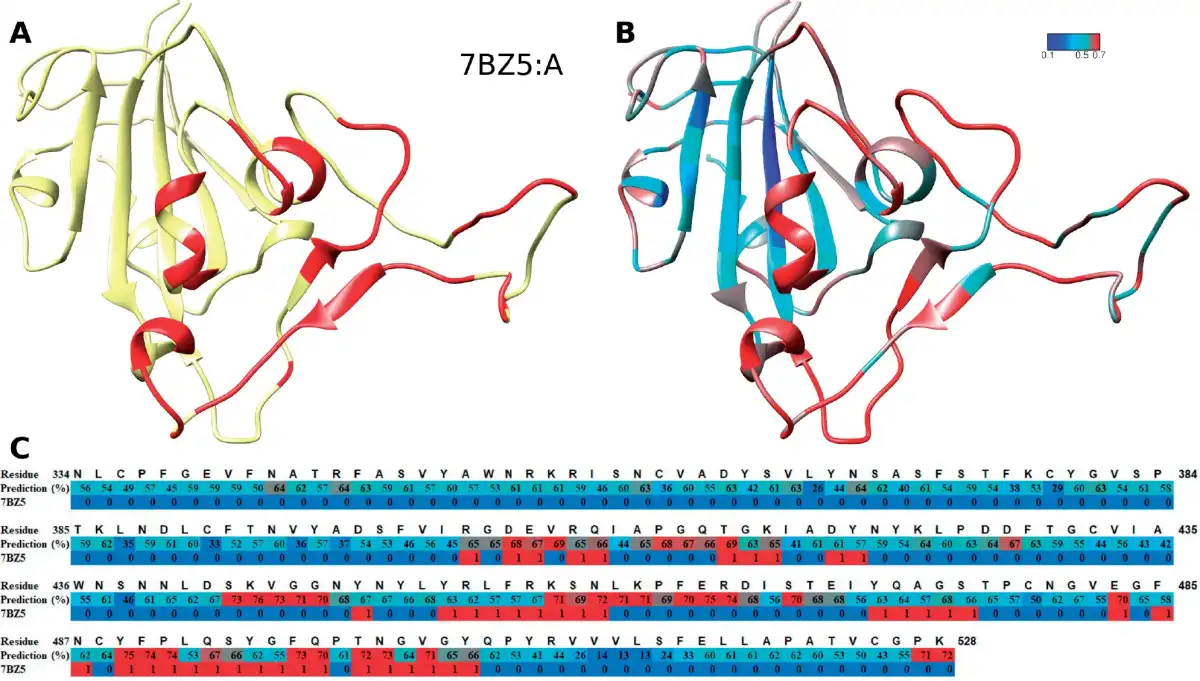
Fig. 2
Epitope prediction of COVID-19 RBD protein, which is not part of Dset_anti. (A) The RBD structure (in yellow) and its epitopes (red). (B) The prediction performance of our predictor. The color gradient from blue (score 0.0) to cyan (0.5) to red (0.7) shows the increased probability scores of that position being an epitope. (C) The details of the sequence at each position: the residue number, the predicted score (as percentage, same colors as in B) and if the residue is an epitope (1, red) or not (0, blue) according the PDB structure 7BZ5
3.6 Application to Adiponectin receptor-2
The Adiponectin receptor-2 bound to antibody fragments (PDB:5LX9) was part of Dset_anti test (not training). For this particular interaction, a coverage of 58% of 24 epitope sites at an accuracy of 82% is achieved, with an AUC-ROC of 0.819 (see Supplementary Fig. S7). From Supplementary Table S8 we can see that transmembrane (TM) proteins in general are easier to predict for all methods tested here. Interestingly, false positive predictions clustered on the other side of protein, which might be due to the fact that the other side of the TM protein is also amenable to antibody binding (see Supplementary Fig. S8).
3.7 Application to Staphylococcus aureus enterotoxin
The S.aureus Enterotoxin B bound to a neutralizing antibody (PDB : 4RGM) was in the Dset_anti test set (not the training set). At default cutoff (0.5) modest precision (22%) at high recall (86%) was obtained, however at a cutoff of 0.69, precision reaches 80% with 14% recall, and an AUC-ROC of 0.74 (see Supplementary Fig. S7). Also here, false positives cluster around the known epitope region (Supplementary Fig. S9).
3.8 The webserver
We extended our SeRenDIP-CE webserver (www.ibi.vu.nl/programs/serendipwww/; , ) to include the new epitope interface predictors presented in this work. The webserver is simple to use and is aimed at non-experts in both academia and industry. The input is only the antigen protein sequence. The predictions are based on the average of the five-fold trained models; for each position in the input sequence the average model score is reported, representing the predicted likelihood of being an epitope position, as well as the standard deviation to allow an estimate of the significance of the prediction.
4 Discussion
Epitope prediction based on antigen sequence is still a difficult problem, nevertheless our results show that it is possible to make significant progress in this field: SeRenDIP-CE predictors reach an AUC-ROC of around 0.7. The difference with the other methods evaluated here (Fig. 1) may be due to the fact that all except BepiPred 2.0 were trained on linear epitope datasets. Furthermore, we showed that the model’s prediction is not solely based on the distinction of buried and surface residues, seeing only a small drop in AUC-ROC (∼0.02–0.03) in our methods when excluding core residues (Supplementary Fig. S5).
Precision achieved at the default threshold (0.5) is rather low (0.16), however at this recall (∼0.55), other methods have even lower precision (∼0.12). Moreover, Figure 1 and Supplementary Figure S7 show that for high-ranked positions a precision of around 0.5 may be readily achieved. As performance differs between targets (Table 3 and Supplementary Table S7) we also expect the optimal cutoff to vary. We therefore encourage users to explore high-ranking sites instead of relying on a default threshold for selecting viable predictions, and the default presentation in the output table on the webserver is therefore sorted by descending score.
Note that our epitope predictions effectively indicate which residues have the potential to bind an antibody, even though our dataset consists of specific antigen-antibody complexes. Such a dataset does not necessarily cover all possible antibody binding sites, which will lead to an underestimation of the number of true positives.
Interestingly, the predictors trained on the combination of heterodimer and antigen datasets obtain the best overall performance. Indeed, the epitope interactions may be seen as a special type of heterodimer and therefore may be expected to share some common properties which could be used for the epitope prediction. To the best of our knowledge, this is the first time heterodimer data is used to improve the prediction of epitope positions. That might open a possibility of implementing ‘combined’ datasets to boost prediction accuracy of a particular ‘subset’ interface type of interest. Further improvement could come from applying deep learning algorithms or implementing additional properties as features, e.g. co-evolution signals derived from large sequence alignments, now that we have shown the power of careful selection of the datasets used for training.
Sequence based prediction is the only option when there is no structure or suitable template available, as for example may well be the case for the proteins in a newly discovered virus, for transmembrane (TM) proteins or for disordered proteins or disordered regions. 19 proteins in Dset_anti (14 in training and five in test) are found in the DisProt database (at seq. ID) (), while 26 are classified as TM in the PDB (of which 19 in the test-set). The available data does not allow us to directly assess the suitability of SeRenDIP-CE for such proteins or regions. Nevertheless, for these five disordered proteins we can report AUC-ROC from 0.50 to 0.748 (mean 0.61), containing 162 disordered amino acids out of 2328 (7%), see Supplementary Table S7. For the TM proteins we can report AUC-ROC of 0.779 ± 0.053, see Supplementary Table S8.
Our method performs well on the epitope prediction of the three selected examples, including the COVID19 RBD antibody–antigen complex. As can be seen in Figure 2, Supplementary Figures S8 and S9, the false positives cluster around the epitope annotated from the corresponding structure. Given the high overall performance of our approach, predicted positions with high probability score might therefore be very interesting as candidate targets for antibody design. Especially for virus proteins whose structures are unknown at the moment, one could expect to implement our method to improve selection of candidate epitope regions.
5 Conclusion
Our SeRenDIP-CE Sequence-based Random forest Epitope Predictors outperform other state-of-the-art approaches. This shows that co-training on epitope data and heteromeric PPI interface data has the potential to make epitope prediction more robust. The webserver based on our predictor is simple to use and only needs one sequence of the protein of interest as input. We therefore expect that the SeRenDIP-CE method and webserver at www.ibi.vu.nl/programs/serendipwww/, will be immediately applicable to a wide range of biomedical and biomolecular problems.
Acknowledgements
The authors thank the anonymous reviewers for their very helpful suggestions for presentation of the results and discussion.
Funding
K.W. and S.A. received funding from the European Union’s Horizon 2020 research and innovation programme under the Marie Skłodowska-Curie [860197] MIRIADE project. Q.H. was supported by the Young Scholars Program of Shandong University (21320082064101). F.X. was supported by the National Natural Science Foundation of China (81773547) and the National Key Research and Development Program of China (2020YFC2003500).
Conflict of Interest: none declared.
References
- Altschul S.F. et al (1997) Gapped BLAST and PSI-BLAST: a new generation of protein database search programs. Nucleic Acids Res., 25, 3389–3402.
- Altschul S.F. et al (2005) Protein database searches using compositionally adjusted substitution matrices. FEBS J., 272, 5101–5109.
- Ansari H.R., Raghava G.P. (2010) Identification of conformational b-cell epitopes in an antigen from its primary sequence. Immunome Res., 6, 6.
- Barlow D.J. et al (1986) Continuous and discontinuous protein antigenic determinants. Nature, 322, 747–748.
- Brown M.C. et al (2011) Impact of immunization technology and assay application on antibody performance – a systematic comparative evaluation. PLoS One, 6, e28718.
- Chen J. et al (2007) Prediction of linear B-cell epitopes using amino acid pair antigenicity scale. Amino Acids, 33, 423–428.
- Cilia E. et al (2013) From protein sequence to dynamics and disorder with DynaMine. Nat. Commun., 4, 2741.
- Davydov Y.I., Tonevitsky A.G. (2009) Prediction of linear B-cell epitopes. Mol. Biol., 43, 150–158.
- de Vries S.J., Bonvin A.M.J.J. (2008) How proteins get in touch: interface prediction in the study of biomolecular complexes. Curr. Protein Pept. Sci., 9, 394–406.
- Dunbar J. et al (2014) Sabdab: the structural antibody database. Nucleic Acids Res., 42, D1140–D1146.
- Edgar R.C. (2004) MUSCLE: a multiple sequence alignment method with reduced time and space complexity. BMC Bioinformatics, 5, 113.
- El-Manzalawy Y., Honavar V. (2010) Recent advances in B-cell epitope prediction methods. Immunome Res., 6, S2.
- El-Manzalawy Y. et al (2008) Predicting linear B-cell epitopes using string kernels. J. Mol. Recogn., 21, 243–255.
- Esmaielbeiki R. et al (2016) Progress and challenges in predicting protein interfaces. Brief. Bioinf., 17, 117–131.
- Forsström B. et al (2015) Dissecting antibodies with regards to linear and conformational epitopes. PLoS One, 10, e0121673.
- Gallet X. et al (2000) A fast method to predict protein interaction sites from sequences. J. Mol. Biol., 302, 917–926.
- Gao J., Kurgan L. (2014) Computational prediction of b cell epitopes from antigen sequences. Methods Mol. Biol., 1184, 197–215.
- Gao J. et al (2012) Best: improved prediction of b-cell epitopes from antigen sequences. PLoS One, 7, e40104.
- Guharoy M., Chakrabarti P. (2007) Secondary structure based analysis and classification of biological interfaces: identification of binding motifs in protein–protein interactions. Bioinformatics, 23, 1909–1918.
- Hatos A. et al (2020) DisProt: intrinsic protein disorder annotation in 2020. Nucleic Acids Res., 48, D269–D276.
- Hou Q. et al (2015) Sequence specificity between interacting and non-interacting homologs identifies interface residues – a homodimer and monomer use case. BMC Bioinformatics, 16, 325.
- Hou Q. et al (2017) Seeing the trees through the forest: sequencebased homo- and heteromeric protein–protein interaction sites prediction using random forest. Bioinformatics, 33, 1479–1487.
- Hou Q. et al (2019) SeRenDIP: SEquential REmasteriNg to DerIve profiles for fast and accurate predictions of PPI interface positions. Bioinformatics, 35, 4794–4796.
- Huang J., Honda W. (2006) Ced: a conformational epitope database. BMC Immunol., 7, 7.
- Jespersen M.C. et al (2017) Bepipred-2.0: improving sequence-based b-cell epitope prediction using conformational epitopes. Nucleic Acids Res., 45, W24–W29.
- Jones S., Thornton J.M. (1996) Principles of protein–protein interactions. Proc. Natl. Acad. Sci. USA, 93, 13–20.
- Kabsch W., Sander C. (1983) Dictionary of protein secondary structure: pattern recognition of hydrogen-bonded and geometrical features. Biopolymers, 22, 2577–2637.
- Kaplon H. et al (2020) Antibodies to watch in 2020. mAbs, 12, 1703531.
- Khan F.H. (2014) Ch. 25 antibodies and their applications. In: Verma A.S., Singh A. (eds.) Animal Biotechnology. Academic Press, San Diego, pp. 473–490.
- Kringelum J.V. et al (2013) Structural analysis of B-cell epitopes in antibody: protein complexes. Molec. Immunol., 53, 24–34.
- Kuhn M. (2015) caret: Classification and Regression Training. Astrophysics Source Code Library, page record ascl:1505.003.
- Larsen J.E. et al (2006) Improved method for predicting linear B-cell epitopes. Immunome Res., 2, 2.
- Li B.-Q. et al (2012) Prediction of protein–protein interaction sites by random forest algorithm with mRMR and IFS. PloS One, 7, e43927.
- Li W., Godzik A. (2006) Cd-hit: a fast program for clustering and comparing large sets of protein or nucleotide sequences. Bioinformatics, 22, 1658–1659.
- Liaw A., Wiener M. (2002) Classification and regression by randomForest. R. News, 2, 18–22.
- Lin W.-J., Chen J.J. (2013) Class-imbalanced classifiers for high-dimensional data. Brief. Bioinf., 14, 13–26.
- Liu T. et al (2020) Deep learning methods improve linear b-cell epitope prediction. BioData Min., 13, 1.
- Ofran Y., Rost B. (2007) ISIS: interaction sites identified from sequence. Bioinformatics, 23, e13–e16.
- Parvizpour S. et al (2020) Epitope-based vaccine design: a comprehensive overview of bioinformatics approaches. Drug Discov. Today, 25, 1034–1042.
- Pirovano W. et al (2006) Sequence comparison by sequence harmony identifies subtype-specific functional sites. Nucleic Acids Res., 34, 6540–6548.
- Ponomarenko J.V., Van Regenmortel M.H. (2009) B cell epitope prediction. In: Gu, J. and Bourne, P.E. (eds.) Structural Bioinformatics, John Wiley & Sons, pp 849–879.
- Potocnakova L. et al (2016) An introduction to b-cell epitope mapping and in silico epitope prediction. J. Immunol. Res., 2016, 1–11.
- Rubinstein N.D. et al (2008) Computational characterization of B-cell epitopes. Mol. Immunol., 45, 3477–3489.
- Rubinstein N.D. et al (2009) Epitopia: a web-server for predicting B-cell epitopes. BMC Bioinformatics, 10, 287.
- Saha S., Raghava G.P. (2006) Prediction of continuous B-cell epitopes in an antigen using recurrent neural network. Protein Struct. Funct. Genes, 65, 40–48.
- Sanchez-Trincado J.L. et al (2017) Fundamentals and methods for T- and B-cell epitope prediction. J. Immunol. Res., 2017, 1.
- Schäffer A.A. et al (2001) Improving the accuracy of PSI-BLAST protein database searches with composition-based statistics and other refinements. Nucleic Acids Res., 29, 2994–3005.
- Schwede T. (2013) Protein modeling: what happened to the “protein structure gap”?Structure, 21, 1531–1540.
- Sela-Culang I. et al (2013) The structural basis of antibody–antigen recognition. Front. Immunol., 4, 302.
- Shen W. et al (2015) Predicting linear B-cell epitopes using amino acid anchoring pair composition. BioData Min., 8, 14.
- Shoemaker B.A., Panchenko A.R. (2007) Deciphering protein–protein interactions. Part I. Experimental techniques and databases. PLoS Comput. Biol., 3, e42.
- Singh H. et al (2013) Improved method for linear B-cell epitope prediction using antigen’s primary sequence. PLoS One, 8, e62216.
- Sweredoski M.J., Baldi P. (2009) Cobepro: a novel system for predicting continuous B-cell epitopes. Protein Eng. Des. Sel., 22, 113–120.
- Valencia A., Pazos F. (2002) Computational methods for the prediction of protein interactions. Curr. Opin. Struct. Biol., 12, 368–373.
- Wee L.J. et al (2010) SVM-based prediction of linear b-cell epitopes using Bayes feature extraction. BMC Genomics, 11, S21.
- Yao B. et al (2012) SVMTriP: a method to predict antigenic epitopes using support vector machine to integrate tri-peptide similarity and propensity. PLoS One, 7, e45152.
- Yao B. et al (2013) Conformational b-cell epitope prediction on antigen protein structures: a review of current algorithms and comparison with common binding site prediction methods. PLoS One, 8, e62249.
- Zhang W. et al (2011) Prediction of conformational B-cell epitopes from 3D structures by random forests with a distance-based feature. BMC Bioinformatics, 12, 341.