1 Introduction
Genome-wide association studies (GWAS) have successfully improved the understanding of the genetic basis of many traits. The emergence of deeply phenotyped GWAS databases such as UK Biobank (), eMERGE (), and Vanderbilt BioVU (), has facilitated studying associations between single nucleotide polymorphisms (SNPs) and a large number of traits. Phenome-wide association studies (PheWAS) have utilized this rich source of SNP-trait relationships to explore disease risks () and drug development (). By evaluating each trait individually, PheWAS is computationally fast to implement. However, it is well documented that joint multivariate analyses can be more powerful than univariate analyses such as PheWAS (). Many efforts have been devoted to multi-trait analyses that evaluate the relationships between a SNP and a set of traits simultaneously (, , , ). Nonetheless, existing multi-trait analyses rely on domain knowledge to select a small number of related traits, and most of them only focus on obtaining high statistical power in hypothesis testing.
We are motivated to understand which risk factors contribute to childhood cancers, which are universally rare and have obscure disease etiology. For example, the etiology of Ewing sarcoma (EWS) remains unclear (), and conventional epidemiological methods to understand the disease are limited due to the extremely rare incidence rate of EWS (). Recently, several genetic risk factors were identified in a GWAS of EWS (), potentiating the use of PheWAS to explore the risk factors agnostically. However, PheWAS can suffer from limited statistical power when scanning over a large number of traits, and simply applying the existing multi-trait methods to a large number of traits does not always yield meaningful results as the polygenic nature of some traits would eventually drive the statistical significance. To address the aforementioned limitations, we propose a novel multi-trait analysis method, TraitScan, that values both trait selection performance and high statistical power. Our method “TraitScan” is based on a fast subset scan framework () with a linear scan time of the number of traits and thus can handle high-dimensional trait selection. Our method contains three test statistics: higher criticism (HC), truncated chi-squared (TC), and a combined test of HC and TC. We note a similar method ASSET () with the same objective. However, it requires an exhaustive search of all possible subsets, which results in an exponential scan time and thus is not computationally efficient when the number of traits exceeds a few dozen.
Our proposed TraitScan algorithm is able to utilize summary-level GWAS data in situations where individual-level data are not available. Due to the logistical limitations and privacy concerns of sharing individual-level data, it has become a common practice to share GWAS summary statistics. Leveraging publicly available summary-level data, our method can filter relevant pleiotropic traits on any given SNP. Through simulations, we show that our method has high power and sensitivity in terms of trait selection under moderately sparse to sparse situations (i.e. the number of truly associated traits is smaller than or close to the square root of total traits). We evaluate traits associated with EWS through GWAS summary statistics on 754 traits filtered from the UK Biobank study (). Besides single SNPs, we also show that our method can be extended to genetic scores, such as the predicted gene expression levels in transcriptome-wide association studies (TWAS) () and polygenic risk scores (PRS) (). We implement our method in an R package “TraitScan” that is publicly available at https://github.com/RuiCao34/TraitScan. The package provides an option to use the pre-calculated null distributions of the test statistics, which can handle screening 754 traits in 58 s.
2 Materials and methods
2.1 Models
We start our formulation by considering continuous traits as outcomes of interest. Assume that the GWAS data consist of p continuous traits and a minor allele dose for a genetic variant of interest (i.e. SNP) collected from n individuals. For , let be a vector of values of the jth trait for the n individuals, a vector of the minor allele doses of the SNP of interest, and a vector of error terms for the jth trait. We assume that each trait can be modeled as a linear function of the genetic variant, and without loss of generality, is centered to have mean 0:
Our method performs a scan for traits under the null hypothesis that none of the traits is associated with the SNP: and the alternative hypothesis that at least one trait is associated with the SNP: where .
Let , and . We can stack the models together as:
To model the correlation structure among the continuous traits, we assume that x is fixed and the rows of represent i.i.d. observations from an distribution, where 0 is a vector of zeroes of length and , where is the potentially unknown covariance matrix of the traits, i.e. for an arbitrary individual i. When the individual-level data are available, the matrix can be estimated from the residuals of fitting separate linear regression models: , where is the ordinary least square estimate.
In many cases, only summary statistics are available, i.e. instead of having individual-level data, we have access to , from Equation (1) and the z-score from a Wald test . We approximate the entry of , by using the null SNPs (i.e. the SNPs with no association with any traits) and ignoring the estimation error of (, ):
In addition, when the summary statistics come from overlapping but not identical samples, the correlation between z-scores is still proportional to the trait correlation (): where , and are the sample sizes of trait , trait , and their overlapping samples respectively. Since the z -score correlation is a constant across all null SNPs, it can be estimated empirically (): where is the z-score for null SNP k and trait , and is the mean of vector across all null SNPs.
For binary traits, the statistical model and z-score correlation estimation can also be generalized. In GWAS, the logistic regression models are usually fitted as:
When the effect size is small, which most often happens in GWAS, the logistic regression model can be approximated by a linear regression model based on the first-order Taylor expansion on : where , , and can be regarded as linear regression coefficients. The covariance for binary traits can be similarly derived using summary statistics of the null SNPs.
In practice, null SNPs can be chosen based on GWAS P-values (i.e. ).
2.2 Scan statistics
To efficiently detect the most anomalous subset of traits among a large number of putative traits, we use the linear time subset scan (LTSS) framework (), which only requires searching a linear number of traits (p) rather than an exponential number of traits ( ) across all possible trait combinations. The LTSS framework defines a score function that measures the anomalousness of the trait subset S with a corresponding priority function G. Under the strong LTSS property, to maximize , we could simply sort traits by G and compare by different numbers of traits (from 1 to p, details in Supplementary Section S1.1). We accordingly construct two score functions, higher criticism (HC) and truncated chi-squared (TC). We show by simulations that the HC or TC method had better performance than PheWAS and other competing methods under different scenarios. We also combine the two tests by taking the minimum P-value of the two tests, which allows us to attain results comparable to the better-performed HC or TC method in terms of statistical power and trait selectivity. The overview of TraitScan algorithm is present in Fig. 1.
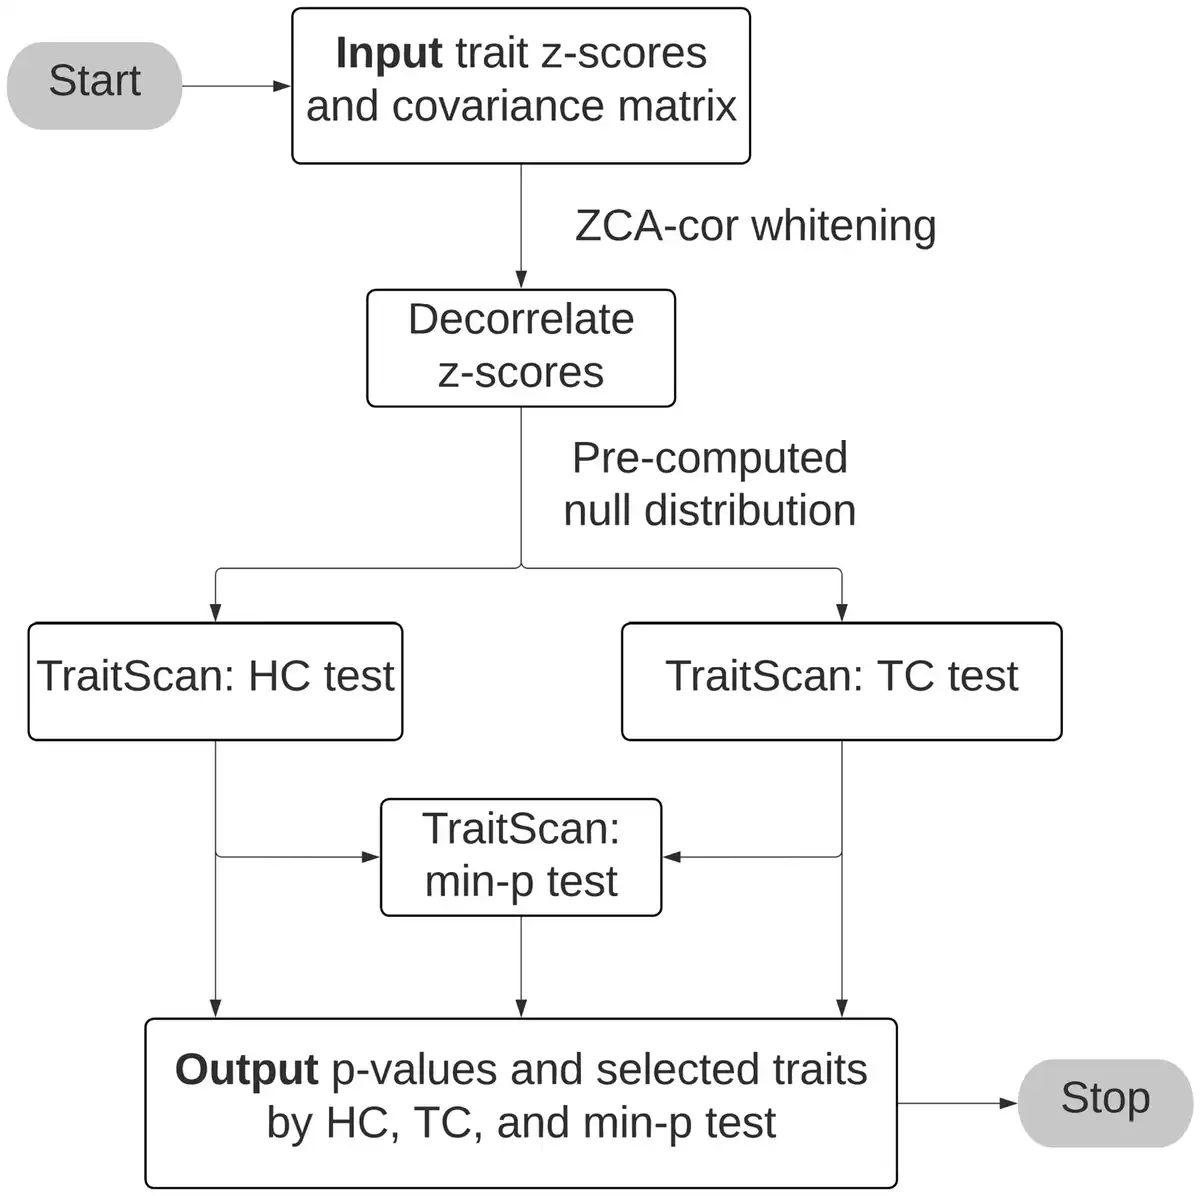
Figure 1
TraitScan algorithm flowchart.
2.2.1 Decorrelation
As in the LTSS framework, a trait-level statistic is required to quantify the amount of association between a trait and a genetic variant. We used the P-value of the Wald test from the separate regression models [Equation (1)], for . As the traits are correlated and sampled from the same or overlapping individuals in our framework, the ’s are correlated. Herein, we perform the ZCA-cor whitening method () on , ensuring that the whitened remains maximally correlated with . Then we obtain corresponding to .
2.2.2 Higher criticism statistic
Following , we choose the HC score function: , where and is the cardinality of the trait subset . The score function is the standardized difference between the observed count of P-values lower than a P-value threshold and the expected count. According to Theorem 1 (Supplementary Section S1.1), it can be proved that the HC statistic satisfies the strong LTSS property with priority function .
As we do not know the optimal , we define grid-based HC test statistic : over a grid of and its corresponding subset
An ideal grid should ensure that all possible subsets are in the search space, i.e. there should be no more than one P-value between two arbitrary adjacent ’s. In practice, we recommend using the grid as a geometric sequence from the Bonferroni significant P-value threshold to overall Type I error with a sequence length of 200, i.e. . The lower bound of ensures that our test would always be more powerful than PheWAS in special scenarios where all traits are uncorrelated. In the meantime, we use an upper bound of 0.05 to decrease the search space.
2.2.3 Truncated chi-squared statistic
The HC test may not have ideal performance under non-sparse scenarios () and does not take into account the strength of association. To make our method more robust, we propose an additional statistic, which is similar to the truncated z-score method () and also meets the strong LTSS property. First, we define as the threshold, which is closely related to in HC statistics: and as the cumulative distribution function of a standard normal distribution. The score function is defined as , i.e. the negative log P-value of the subset score function with priority function . The TC statistic also meets the condition of Theorem 1 (Supplementary Section S1.1) and thus satisfies the strong LTSS property.
Similarly, we test a grid of one-to-one mapping to the grid of defined previously: grid is chosen in correspondence with the values.
2.3 Assessing significance
We have now obtained two subsets and that maximize HC or TC statistics. As described above, both subsets always include at least one trait. To determine whether the selected subset is sufficiently anomalous, we calculate the corresponding P-values and by comparing the two statistics and with their distributions under the null hypothesis.
can be calculated analytically (Supplementary Section S1.2). As for , we use Monte Carlo (MC) simulations. We start by simulating p z-scores under the null, i.e. standard normal distribution for B iterations. For the bth iteration, the can be calculated, and empirical P-values can be estimated from the simulated null distribution.
To combine the HC and TC tests, we compare the P-values and and get the grid-based statistics: and the traits selected by the combined test are also determined by the test with a smaller P-value: where M = HC or TC. The empirical null distribution of can be similarly simulated by MC, and the P-value from the combined test is calculated by comparing the test statistic and its distribution under the null.
If the null hypothesis is rejected, we can conclude that is the most anomalous trait subset and the SNP is associated with at least one of the traits in . Note that this MC simulation step only depends on the number of traits p and the choice of grid. For SNPs sharing the same number of traits p, we do not need to recompute the test statistic distribution under the null.
2.4 Extension to genetic scores
Genetic scores integrate information from multiple SNPs. Linking traits with genetic scores could bring in more statistical power and provide a meaningful interpretation of the results. Genetic scores, which are usually the linear combinations of allele counts of multiple SNPs, have been extensively developed and distributed. Polygenic risk scores that predict the risk of clinical and epidemiological traits () or imputation models for gene expression levels in TWAS () are two types of commonly used genetic scores. We will show how TraitScan can be easily utilized on genetic scores using summary-level GWAS data and an external genetic reference panel.
2.4.1 Continuous traits
Let denote the genetic score from q SNPs: , where is the genotype vector for n independent individuals at the SNP, and is the SNP weight vector. In GWAS models, the trait is marginally regressed on each SNP , and regression coefficients and are estimated from the linear regression model
For the genetic score, we are interested in the regression model and test the null hypothesis
When individual-level data are available, the regression coefficients and with z statistic from the Wald test can be directly calculated. When only summary-level data are available, we have where is the residual variance estimate and is the sample size for jth trait. The items and can be derived from GWAS summary data (): where is the variance of SNP l. Both and the genotype matrix can be estimated from a reference panel comprising genotypic data of individuals from a general population (). In practice, for Equation (23), we can calculate across multiple SNPs and take the median as the estimate.
After z statistics are computed, we could follow the same decorrelation and trait scanning steps as above since the genetic score can also be treated as a SNP, and the covariances between are identical under the null hypothesis.
2.4.2 Binary traits
We have the logistic regression for binary traits: for ith individual, jth trait, and lth SNP, and are the regression coefficients. Following , we could approximate as a continuous outcome under a linear regression model and denote and as the coefficients. The following equations hold: where is the ratio of control and case sizes. The logistic regression coefficients can be thus converted to linear regression coefficients and handled by the steps mentioned above.
3 Real data application
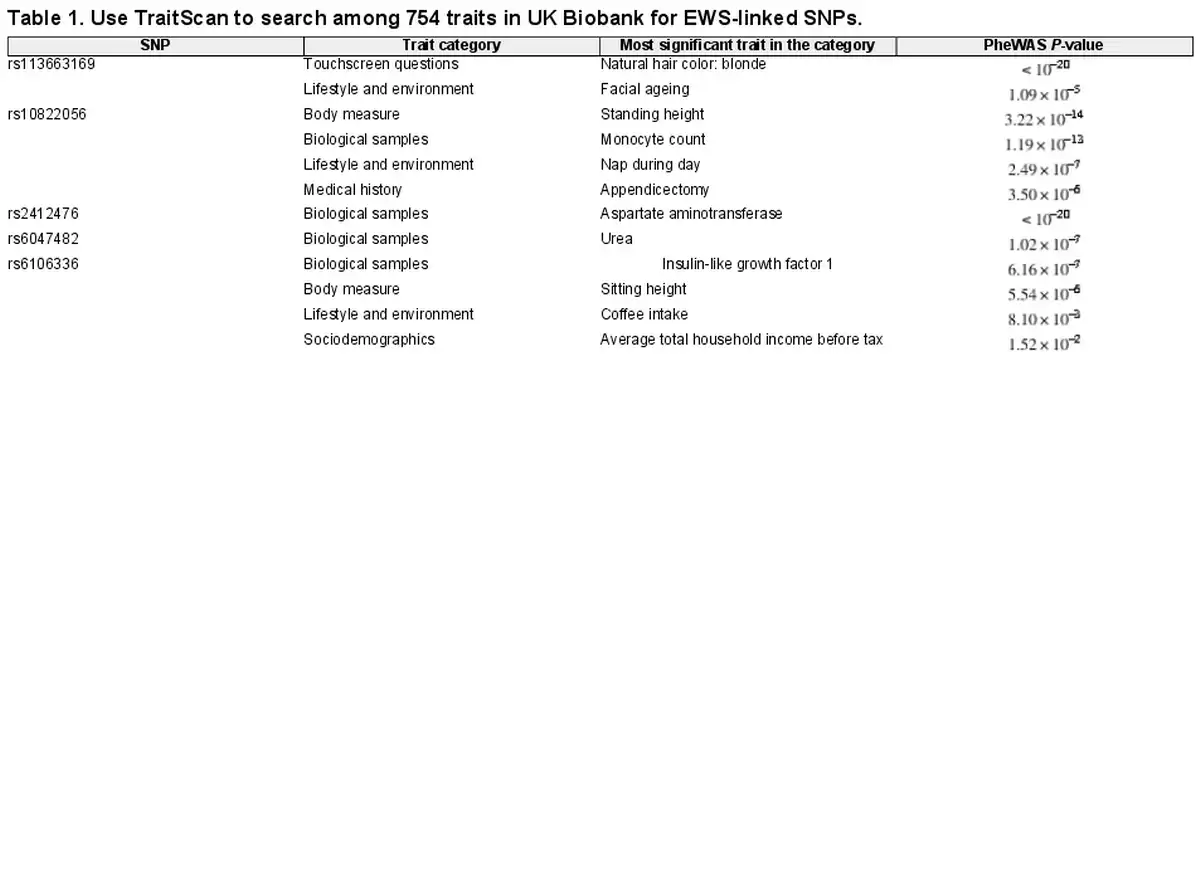
We used our method on UK Biobank GWAS data to find out potential traits linked to EWS. EWS is a type of rare childhood cancer in bone or soft tissue (). Previous studies (, ) suggested that six SNPs rs113663169, rs7742053, rs10822056, rs2412476, rs6047482, and rs6106336 were significantly associated with EWS in individuals of European ancestry. We analyzed these six SNPs using the GWAS summary statistics of the UK Biobank data.
UK Biobank is a large-scale database encompassing a broad range of phenotypes, where individuals’ genetic data are linked to electronic health records and survey measures (). More method and analysis details can be found on the Pan-UK Biobank website (https://pan.ukbb.broadinstitute.org/). The UK biobank GWAS summary-level data analyzed in this study was downloaded after the 3 August 2023 update.
Since EWS occurs in both males and females of European ancestry, we focused on the GWAS summary statistics for individuals of European ancestry and with a sufficient number of participants of both sexes. We applied the following criteria which left us with 754 traits to perform the TraitScan algorithm:
Continuous traits with a sample size of at least 5000 or binary traits with a sample size of at least 5000 cases and 5000 controls.
Traits with genetic heritability P-value by stratified LD score regression (S-LDSC) ().
Traits with at least one genome-wide significant SNP (P-value ).
Traits with the sample size of each sex larger than 20.
Traits belonging to these categories were included: health-related outcomes, online follow-up, biological samples, X-ray absorptiometry (DXA), cognitive function, verbal interview, touchscreen questions (except traits related to eyes), and baseline characteristics.
As we intended to evaluate six SNPs, the significance level for TraitScan tests was set at after the Bonferroni correction. We compared TraitScan with PheWAS with Bonferroni adjustment (significance level ). Given the large number of putative traits, no other competing multi-trait analysis method was applied due to the prohibitive computational time. As a result, SNPs rs113663169, rs10822056, rs2412476, rs6047482, and rs6106336 were shown to have significant associations with at least one trait out of 754 examined traits in UKBiobank by TraitScan (TraitScan combined test P-values ). For SNP rs7742053, TraitScan combined test P-value was 0.872 and thus did not reach statistical significance. Table 1 summarizes the results of TraitScan combined test for the most significant trait in each category identified for the five SNPs. It showed traits that were highly significant in PheWAS were also captured by TraitScan. In fact, TraitScan identified a total of 28 UK Biobank traits related to the five EWS-linked SNPs, while 8 of the trait-SNP associations did not reach statistical significance in PheWAS. A full list of selected traits is shown in Supplementary Materials (Supplementary Table S1).
To demonstrate the TraitScan application on genetic scores, we further carried out our method on the transcriptomic scores of gene KIZ and gene RREB1, i.e. the SNP-imputed gene expression of the two genes, with the 754 UK Biobank traits. KIZ and RREB1 had strong evidence to be linked to three top genome-wide significant SNPs in EWS GWAS (KIZ was linked to SNPs rs6047482 and rs6106336, and RREB1 to rs7742053) (). The weights in the transcriptomic scores of human blood were obtained from , and the internal of the scores were 0.206 and 0.031 for KIZ and RREB1, respectively. The significance levels for both genes were set at after the Bonferroni correction. In addition, we also tested the relationship between the number of risk alleles identified in with EWS. It was shown that EWS cases had on average 1.08 more risk alleles than controls (P-value ).
After applying TraitScan on the genetic scores, neither of the two genes KIZ (P-value ) and RREB1 (P-value = 1) reached statistical significance in TraitScan, although the trait insulin-like growth factor 1 (IGF-1) picked up by KIZ was marginally significant. On the other hand, imputed gene expression of RREB1, of which rs7742053 was an expression quantitative trait loci (eQTL), had no evidence of linking to any of the 754 traits. The genetic score of six EWS SNPs, however, was significantly associated with three traits: hair color (blonde), skin color, and facial aging (TraitScan P-value ), while the PheWAS identified two additional traits on the EWS score: hair color (dark brown) and ease of skin tanning.
To investigate the causal relationship between EWS and the selected traits, we further performed bidirectional Mendelian randomization (MR) analysis on the traits selected by TraitScan using the TwoSampleMR package (, ). The instrumental variables were selected from either UK Biobank or EWS GWAS data and were clumped by and P-value . For the selected traits with more than one instrumental variable, inverse-variance weighted (IVW), Egger regression, weighted median, simple mode, and weighted mode methods were applied, while the Wald ratio method was applied for the selected traits with one instrumental variable. Full results are reported in Supplementary Table S2. Lower alkaline phosphatase levels, the trait selected to be associated with SNP rs10822056 in TraitScan but not PheWAS, was shown to be causal for EWS (MR weighted mode coefficient with P-value ). For the causal direction where EWS was the exposure, no MR test reached statistical significance after accounting for multiple testing, suggesting no causal effect from EWS to the selected UK Biobank traits.
4 Simulation
Throughout the simulations, we used five metrics to assess the performance of each method, i.e. power, size, recall, precision, and Jaccard similarity. Let p be the total number of traits, be the subset of traits as chosen by a particular method and let be the true subset of pleiotropic traits. The size was defined as , which is the number of selected traits by a multi-trait method. Then, we defined precision to be , the proportion of traits identified by the method that was truly associated with the SNP. We defined recall to be , the proportion of the pleiotropic traits identified by the method. We defined Jaccard similarity, a combination of precision and recall, to be . Finally, power was assessed by comparing the observed statistic to the simulated distribution of null statistics. We reported the average value of all the metrics across the simulation iterations.
We compared the performance of variable selection and testing for TraitScan using summary statistics with some existing methods: PheWAS (with Bonferroni adjustment), CPASSOC ( , ) (), MTaSPUs (), and generalized higher criticism (GHC) (). Among these methods, MTaSPUs and cannot select traits, and thus we only evaluated their performance in terms of statistical power. includes a parameter grid as the thresholds for z-scores and can naturally select out the traits with absolute z-scores smaller than each threshold. As suggested by their package, the parameter grid was set as the observed trait P-values. The GHC was originally proposed for SNP set association with a single trait, and here we used it for a single SNP association with multiple traits. We did not compare our method with ASSET because it is not computationally efficient in our simulation settings (754 traits for the real data variance-covariance scenario and 50 traits for the rest of the scenarios).
We conducted simulations under multiple scenarios to show TraitScan has higher power and Jaccard similarity under moderately sparse ( ) and sparse situations ( ). We focus the discussion on the scenarios with varying numbers of truly associated traits (scenario 1) or with real data variance-covariance matrix (scenario 2) and briefly discuss the other four scenarios and their results.
We assessed the method performance by varying the number of truly associated traits in scenario 1 (Fig. 2). In terms of statistical power, we observed that TraitScan test statistics (HC, TC, HC+TC) had the highest power under moderately sparse and sparse situations ( , or ). The HC test was more powerful than the TC test under extremely sparse situations ( ). When , the GHC, MTaSPUs, PheWAS, and had the highest power, and TraitScan and were less powerful. In terms of variable selection performance, we found that TraitScan test statistics (HC, TC, HC+TC) also had the highest Jaccard similarity under moderately sparse and sparse situations ( , or ), while had better Jaccard similarity as increasing proportion of truly associated traits. However, tended to over-select traits and thus had the lowest precision under most situations.
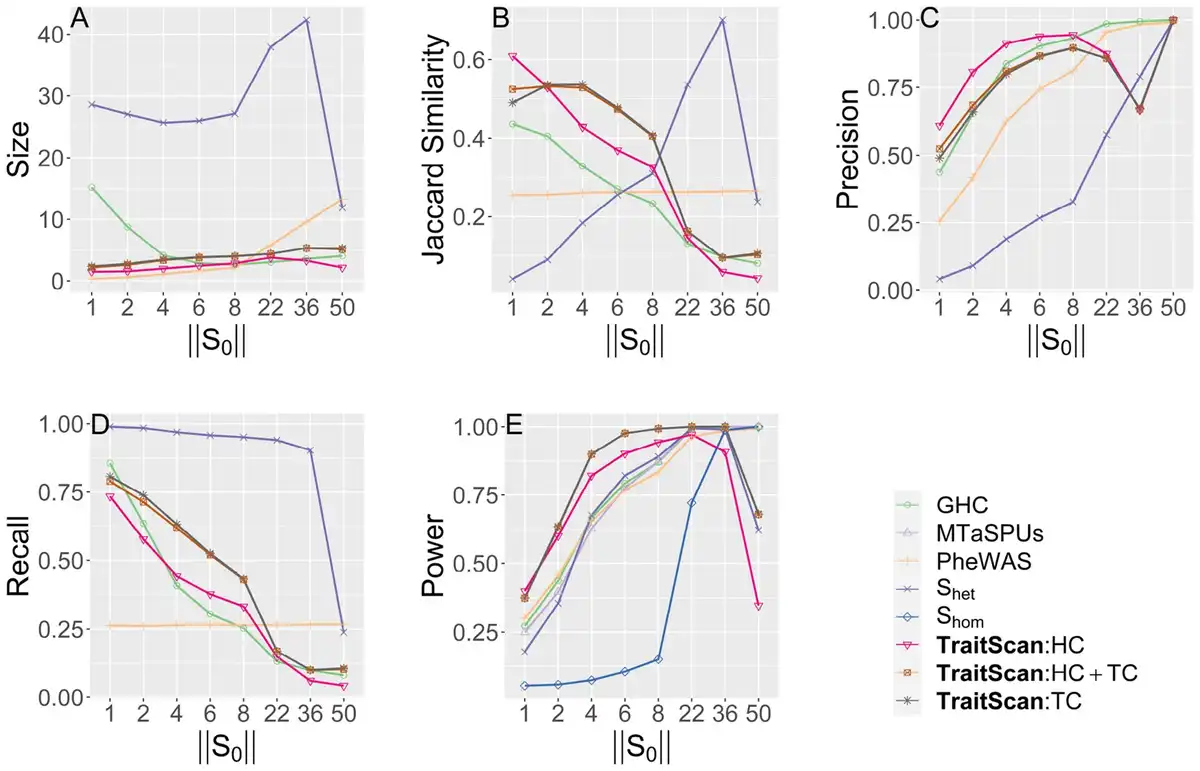
Simulation scenario 1 with varying numbers of truly associated traits ( ). (A) Size. (B) Jaccard similarity. (C) Precision. (D) Recall. (E) Power.
We also tested method performance using the covariance matrix and effect sizes estimated from the 754 UK biobank traits (Fig. 3), where 74 traits with marginal P-value were set as a true subset of pleiotropic traits. In this scenario, we compared the performance of PheWAS and TraitScan under trait-SNP associations of different strengths. , GHC, and MTaSPUs were not applied due to the computational burden. In addition, was excluded because the simulation setting evidently did not adhere to the homogeneous effect assumption, an assumption that is rarely met in real data analysis. By comparing the Type I errors ( ), we showed that TraitScan tests were well calibrated. Similar to scenario 1 mentioned above, TraitScan had higher power and Jaccard similarity than PheWAS under all effect sizes. We also noticed that the selected trait size did not grow with effect size. When the effect sizes were small, the P-values of truly associated traits and null traits were close, and TraitScan tended to select a large set of traits as the most anomalous trait subset.
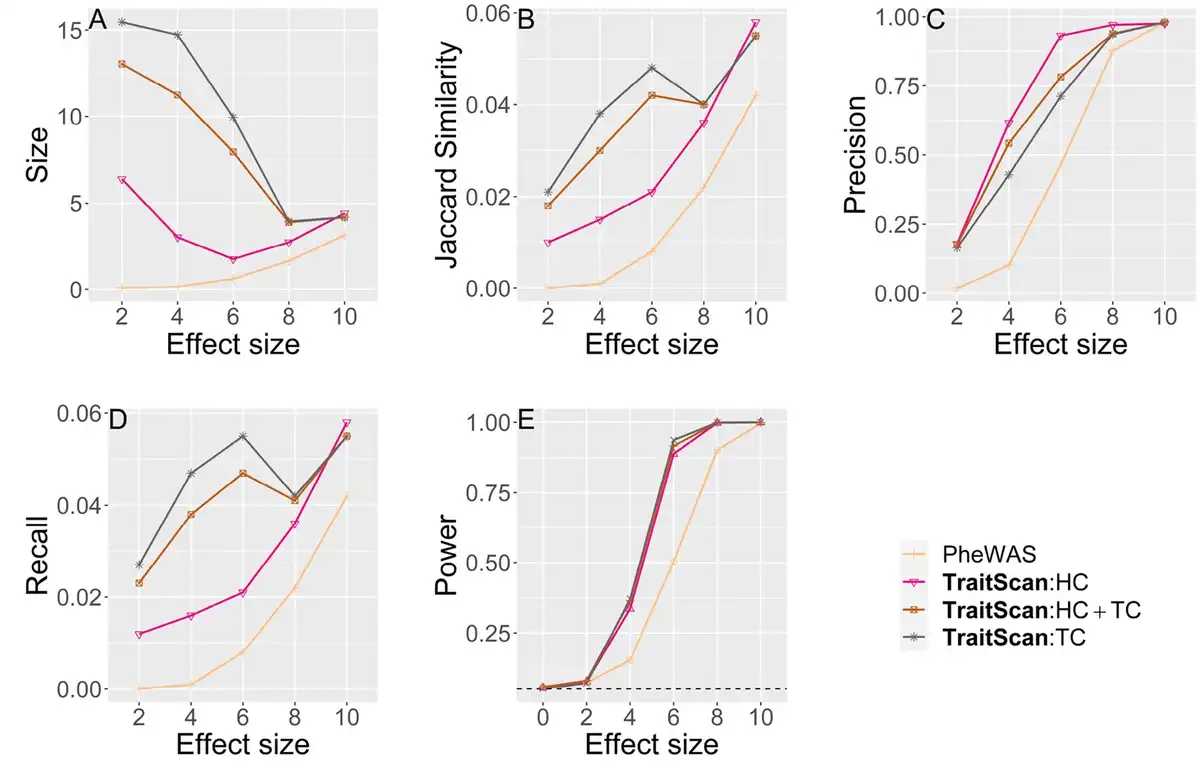
Simulation scenario 2 with real data covariance matrix and effects from SNP rs6106336 ( ). Effect size is in proportion to the estimated correlation observed in UK Biobank. (A) Size. (B) Jaccard similarity. (C) Precision. (D) Recall. (E) Power.
We showed that TraitScan can handle mixed types of traits (i.e. continuous and binary) simultaneously (Supplementary Fig. S1) and the performance followed the same pattern as continuous traits. TraitScan still demonstrated the highest power and Jaccard Similarity under effects varying in both directions and magnitudes (Supplementary Table S4), under block-diagonal correlated traits (Supplementary Fig. S2), or different correlation magnitudes or structures (Supplementary Table S5). Moreover, we found that TraitScan had higher power and Jaccard similarity when handling more highly correlated traits. The detailed parameter settings of the simulations can be found in Supplementary Section S3.1.
5 Discussion
We proposed a new method called TraitScan for post-GWAS trait subset scanning and testing. While most of the existing multi-trait methods rely on domain knowledge, our method allows agnostic search among a large number of traits and is able to identify a set of traits with the most anomalousness. TraitScan utilizes the fast subset scan framework (), resulting in a linear scan time over the number of traits. Taking correlation among traits into consideration, TraitScan has demonstrated higher power and trait selectivity than PheWAS when sparsity was low or modest. The method is compatible with both individual-level and summary-level GWAS data, although we focus more on summary-level GWAS data herein to allow an easy application to existing deeply phenotyped GWAS summary statistics databases.
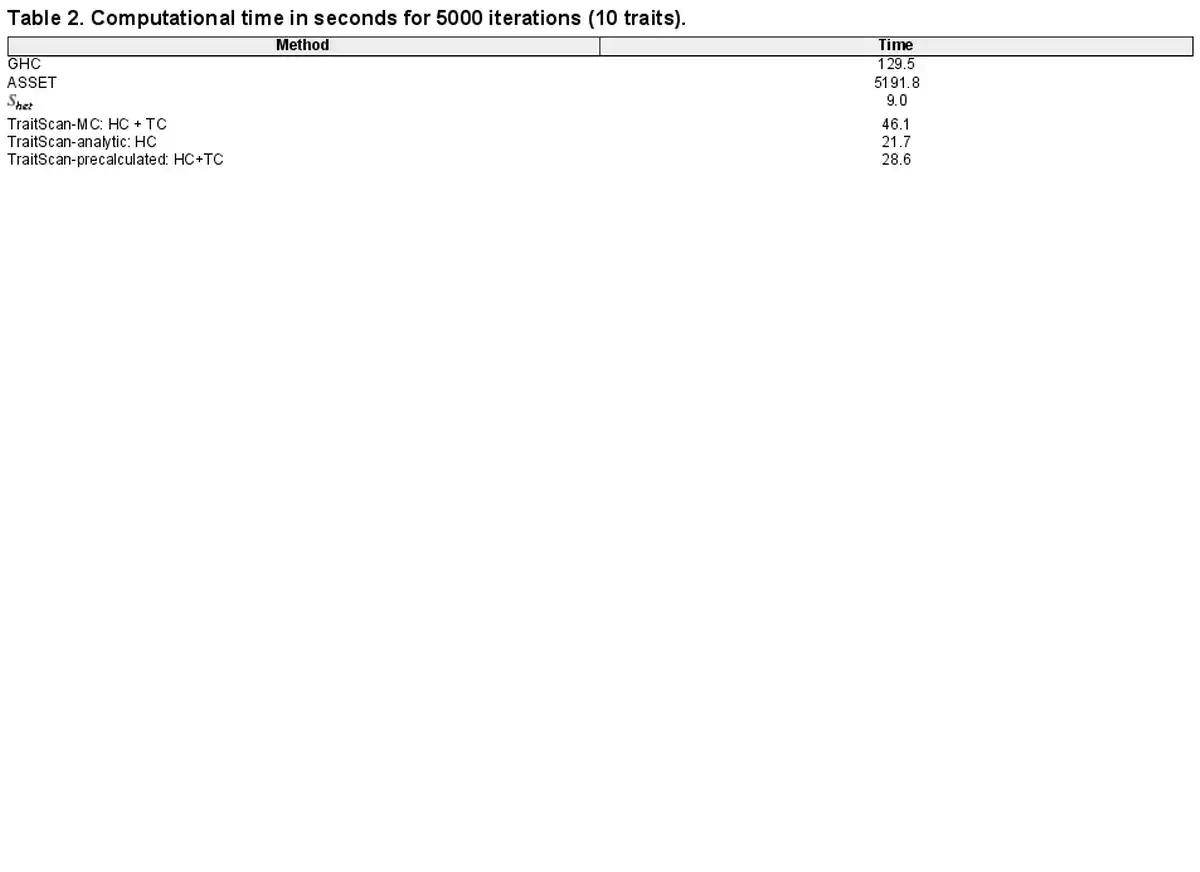
Given a fixed number of , TraitScan has an time complexity. If the number of is proportional to p, the time complexity is . While for the other multi-trait analysis methods, the test in CPASSOC also has an time complexity given a fixed P-value threshold, since it ranks the P-values and directly applies the threshold onto the raw P-values. When the thresholds are set as the input P-values, which is recommended in the CPASSOC pipeline, its time complexity is also . The ASSET has an time complexity, meaning the computational time will be doubled once adding one more trait. Table 2 lists the computational time for analyzing 10 traits 5000 times using different methods, including TraitScan with 10 000 iterations in the MC simulation (TraitScan-MC), TraitScan: HC test based on the analytical null distribution (TraitScan-analytic), and TraitScan test using a precalculated null distribution estimated by MC with a given p (TraitScan-precalculated). All the programs were ran on Intel Haswell E5-2680v3 processors with 16-GB memory, and the trait correlations and parameters were the same as in Scenario 1.
In the examination of traits associated with EWS, TraitScan identified eight additional trait-SNP associations which did not reach the PheWAS significance level. One of these traits, alkaline phosphatase, measured by blood assays, also showed significance in MR analysis, suggesting it was causally related to EWS. Evidence has shown the presence of abundant alkaline phosphatase activity in EWS tumor cells (); however, the direction of association between alkaline phosphatase and EWS was previously unknown. Another trait, IGF-1, was selected by TraitScan for rs6047482 and rs6106336 on chromosome 20. IGF1-receptor is known to be upregulated in EWS, and anti-IGF1 is an experimental therapy (). Besides, the SNP rs7742053, the only SNP that failed to reach genome-wide significance in both TraitScan and PheWAS, has recently been reported to have a specific role in the increased binding of GGAA microsatellite alleles with the chromosomal translocation encoding chimeric transcription factors ().
Examining the genetic score of KIZ and RREB1 allowed us to investigate whether any trait was associated with EWS on the gene level. If a gene is associated with the same set of traits, then likely multiple SNPs in the gene will be associated with the traits, leading to higher power than the single SNP test. However, if the weight in the genetic score is not informative, such as imputing gene expression in a non-relevant tissue, or if multiple SNPs in the gene suggest a different association with the trait, we would have diminished power. We did not observe any traits significantly associated with the genetic scores (i.e. imputed gene expression) of KIZ and RREB1, potentially because blood may not be the most relevant tissue for EWS. We note that like other methods, our results relied on the quality of GWAS data. When handling real GWAS data, we applied a couple of filtering steps to exclude traits that are not heritable. However, after the filtering steps, there were still a few traits that lacked reasonable explanations of their genetic heritability such as the inpatient record format, or the potential mechanisms to be associated with EWS, such as fruit intake within the past 24 h. We suspect it was due to the inadequate adjustment for confounding in the original GWAS analysis (). Without accessing the individual-level data, it is difficult to examine or correct the summary-level GWAS data, although there is some recent work performing quality control on GWAS errors using summary statistics and a reference panel (, ).
To use TraitScan in real data analysis, the following additional steps could help avoid potential power loss and increase the interpretability of the results. First of all, we suggest removing highly correlated traits from the pool of putative traits by examining the empirical trait correlation matrix. The strong LTSS property of TraitScan requires traits to be independent of each other. As shown in the simulation, our method had relatively low statistical power when the genetic variant had the effects and correlations of the same direction on most of the traits. We find that the decorrelation step on z-scores shifted the means of z-scores of the truly associated traits toward zero, resulting in a power loss. Therefore, removing such traits could potentially improve the statistical power. Future work may be focused on developing subset algorithms balancing the computational time and scan sensitivity. Secondly, we recommend checking the correlation between the decorrelated traits and raw traits. Due to the trait decorrelation in TraitScan, trait selection and testing are performed on the decorrelated z-scores, which are essentially linear combinations of raw z-scores. Although the ZCA-cor decorrelation method maximizes the average correlation between each dimension of the decorrelated and original data, the decorrelated traits might be considered to differ from the original traits. Therefore, this step could improve the interpretability of the findings. In our real data analysis, 99% of the 754 UK Biobank traits had an empirical correlation with the original trait greater than 0.7.
The understanding of rare diseases such as childhood cancer has long been limited. TraitScan is able to provide a list of possible traits associated with EWS through the disease-linked genetic variants. As association does not imply causality, further biological experiments or additional data analysis approaches such as MR are required to study whether a trait and target disease are causally linked and whether the trait is a risk factor or a consequence of the disease.
Acknowledgements
The authors thank Prof. Jim Hodges of the Division of Biostatistics and Health Data Science, University of Minnesota, who helped with administrative matters early in this project. The authors also want to thank Dr Aubrey K. Hubbard and Mitchell J. Machiela from the Division of Cancer Epidemiology and Genetics at the National Cancer Institute for their help with our understanding of the GWAS of Ewing Sarcoma. This work was supported by the Children’s Cancer Research Fund and by the Minnesota Supercomputing Institute at the University of Minnesota.
References
- Auton A, Abecasis GR, Altshuler DM et al; The 1000 Genomes Project Consortium. A global reference for human genetic variation. Nature2015;526:68–74.
- Barnett I, Mukherjee R, Lin X et al The generalized higher criticism for testing SNP-set effects in genetic association studies. J Am Stat Assoc2017;112:64–76.
- Bhattacharjee S, Rajaraman P, Jacobs KB et al; GliomaScan Consortium. A subset-based approach improves power and interpretation for the combined analysis of genetic association studies of heterogeneous traits. Am J Hum Genet2012;90:821–35.
- Bu D, Yang Q, Meng Z et al Truncated tests for combining evidence of summary statistics. Genet Epidemiol2020;44:687–701.
- Bycroft C, Freeman C, Petkova D et al The UK Biobank resource with deep phenotyping and genomic data. Nature2018;562:203–9.
- Chen W, Wu Y, Zheng Z et al Improved analyses of GWAS summary statistics by reducing data heterogeneity and errors. Nat Commun2021;12:7117.
- Darrous L, Mounier N, Kutalik Z et al Simultaneous estimation of bi-directional causal effects and heritable confounding from GWAS summary statistics. Nat Commun2021;12:7274.
- Denny JC, Ritchie MD, Basford MA et al PHEWAS: demonstrating the feasibility of a phenome-wide scan to discover gene–disease associations. Bioinformatics2010;26:1205–10.
- Diogo D, Tian C, Franklin CS et al Phenome-wide association studies across large population cohorts support drug target validation. Nat Commun2018;9:4285.
- Feng H, Mancuso N, Pasaniuc B et al Multitrait transcriptome‐wide association study (TWAS) tests. Genet Epidemiol2021;45:563–76. https://doi.org/10.1002/gepi.22391.
- Finucane HK, Bulik-Sullivan B, Gusev A et al; RACI Consortium. Partitioning heritability by functional annotation using genome-wide association summary statistics. Nat Genet2015;47:1228–35.
- Gonzalez E, Bui M, Ahmed AA. IGF1R immunohistochemistry in Ewing’s sarcoma as predictor of response to targeted therapy. Int J Health Sci2020;14:17.
- Gottesman O, Kuivaniemi H, Tromp G et al; eMERGE Network. The electronic medical records and genomics (emerge) network: past, present, and future. Genet Med2013;15:761–71.
- Hemani G, Tilling K, Davey Smith G et al Orienting the causal relationship between imprecisely measured traits using GWAS summary data. PLoS Genet2017;13:e1007081. https://doi.org/10.1371/journal.pgen.1007081.
- Hemani G, Zheng J, Elsworth B et al The MR-Base platform supports systematic causal inference across the human phenome. Elife2018;7:e34408. https://doi.org/10.7554/eLife.34408.
- Holmes JB, Speed D, Balding DJ et al Summary statistic analyses can mistake confounding bias for heritability. Genet Epidemiol2019;43:930–40.
- Kessy A, Lewin A, Strimmer K et al Optimal whitening and decorrelation. Am Stat2018;72:309–14.
- Kim J, Bai Y, Pan W et al An adaptive association test for multiple phenotypes with GWAS summary statistics. Genet Epidemiol2015;39:651–63.
- Lahat G, Lazar A, Lev D et al Sarcoma epidemiology and etiology: potential environmental and genetic factors. Surg Clin N Am2008;88:451–81.
- Lee OW, Rodrigues C, Lin S-H et al Targeted long-read sequencing of the Ewing sarcoma 6p25. 1 susceptibility locus identifies germline-somatic interactions with EWSR1-FLI1 binding. Am J Hum Genet2023;110:427–41.
- Lewis CM, Vassos E. Polygenic risk scores: from research tools to clinical instruments. Genome Med2020;12:44. https://doi.org/10.1186/s13073-020-00742-5.
- Li M, Chen C-W. Epigenetic and transcriptional signaling in Ewing sarcoma—disease etiology and therapeutic opportunities. Biomedicines2022;10:1325.
- Li T, Ning Z, Shen X et al Improved estimation of phenotypic correlations using summary association statistics. Front Genet2021;12:665252.
- Li X, Zhu X. Cross-phenotype association analysis using summary statistics from GWAS. In: Elston, R. (ed) Statistical Human Genetics. Springer, vol. 1666, New York, NY: Humana Press 2017, 455–67. https://doi-org.ezp1.lib.umn.edu/10.1007/978-1-4939-7274-6_22.
- Liu Z, Lin X. Multiple phenotype association tests using summary statistics in genome-wide association studies. Biometrics2018;74:165–75.
- Machiela MJ, Grünewald TGP, Surdez D et al Genome-wide association study identifies multiple new loci associated with Ewing sarcoma susceptibility. Nat Commun2018;9:3184–8.
- McFowland E, Speakman S, Neill DB. Fast generalized subset scan for anomalous pattern detection. J Mach Learn Res2013;14:1533–61.
- Neill DB. Fast subset scan for spatial pattern detection: fast subset scan. J R Stat Soc Ser B (Stat Methodol)2012;74:337–60. https://doi.org/10.1111/j.1467-9868.2011.01014.x.
- O’Reilly PF, Hoggart CJ, Pomyen Y et al Multiphen: joint model of multiple phenotypes can increase discovery in GWAS. PloS One2012;7:e34861.
- Pattee J, Pan W. Penalized regression and model selection methods for polygenic scores on summary statistics. PLoS Comput Biol2020;16:e1008271. https://doi.org/10.1371/journal.pcbi.1008271.
- Postel-Vinay S, Véron AS, Tirode F et al Common variants near TARDBP and EGR2 are associated with susceptibility to ewing sarcoma. Nat Genet2012;44:323–7.
- Robinson JR, Denny JC, Roden DM et al Genome-wide and phenome-wide approaches to understand variable drug actions in electronic health records. Clin Transl Sci2018;11:112–22.
- Roden DM, Pulley JM, Basford MA et al Development of a large-scale de-identified DNA biobank to enable personalized medicine. Clin Pharmacol Ther2008;84:362–9.
- Sharada P, Girish HC, Umadevi HS et al Ewing’s sarcoma of the mandible. J Oral Maxillofac Pathol2006;10:31.
- Spector LG, Hubbard AK, Diessner BJ et al Comparative international incidence of Ewing sarcoma 1988 to 2012. Int J Cancer2021;149:1054–66.
- Sudlow C, Gallacher J, Allen N et al UK Biobank: an open access resource for identifying the causes of a wide range of complex diseases of middle and old age. PLoS Med2015;12:e1001779.
- Torkamani A, Wineinger NE, Topol EJ et al The personal and clinical utility of polygenic risk scores. Nat Rev Genet2018;19:581–90.
- Xu Y, Ritchie SC, Liang Y et al An atlas of genetic scores to predict multi-omic traits. Nature2023;616:123–31. https://doi.org/10.1038/s41586-023-05844-9.
- Zhu X, Feng T, Tayo BO et al; COGENT BP Consortium. Meta-analysis of correlated traits via summary statistics from GWASs with an application in hypertension. Am J Hum Genet2015;96:21–36.