Introduction
It is widely accepted that the incidence and prevalence of multiple sclerosis is subject to geographical variation. In general, prevalence is higher in higher latitudes in both the northern and southern hemispheres., Studies have linked this geographical variation to the exposure to ultraviolet (UV) B radiation and vitamin D levels., Our recent study using data from the global MSBase registry showed that above 40°, higher latitude was associated with faster accumulation of disability. It is not known if the risk of conversion to secondary progressive multiple sclerosis (SPMS), which is characterized by gradual accumulation of disability following an initial relapsing-remitting phase, is also subject to this geographical variation. Despite recent advances in the treatment of relapsing-remitting multiple sclerosis (RRMS), prognosis remains suboptimal, probably due to differential response to various therapies and substantial heterogeneity in treatment approaches across different countries due to differences in drug licensing and availability. Geographically related countries often share many environmental, lifestyle and dietary characteristics. Spatial modelling, which is a statistical approach to account for homogeneity across neighbouring regions would enable us to model geographical variations of SPMS risk. This study examines the association between the place of residence and risk of SPMS in a large multi-national cohort using a spatial analysis.
Materials and methods
Ethics statement
The MSBase registry (WHO registration ACTRN12605000455662) was approved by the Melbourne Health Human Research Ethics Committee and by the site institutional review boards. Written informed consent was obtained from all enrolled patients or guardians.
Patients
The MSBase registry is a global multiple sclerosis cohort from 151 centres in 41 countries on all populated continents. Since 2006, MSBase has prospectively collected demographic, clinical and limited radiological information from mainly tertiary specialist clinics. Data for this study were extracted on 1 February 2022. Patients with confirmed diagnosis of RRMS were included conditional on the availability of at least one disability assessment with the Expanded Disability Status Scale (EDSS). Included centres had a MSBase generalizability score ≥ 10 to ensure representativeness of the study cohort of the known multiple sclerosis epidemiology and contemporary disease-modifying therapy. The study excluded centres with no reported SPMS patients and countries with no data recorded after 1 January 2015, to minimize selection bias.
Primary outcome
The primary outcome of interest was the cumulative hazard of SPMS conversion over time from the diagnosis of RRMS. SPMS was diagnosed by treating clinicians based on the Lublin diagnostic criteria.,
Statistical analyses
A parametric proportional hazards frailty model was used to estimate the cumulative hazard of SPMS by patients’ country of residence (latitude of centroid), adjusted for sex, age at disease onset, time from first symptom to RRMS, Multiple Sclerosis Severity Score (MSSS) at the inclusion (i.e. the time of entry to the MSBase registry) and relapse frequency during the subsequent year. National multiple sclerosis prevalence (per 100 000 population), government health expenditure (% of current health expenditure), and proportion of time treated with high-to-moderate efficacy disease-modifying therapy (alemtuzumab, mitoxantrone, natalizumab, ocrelizumab, ofatumumab, rituximab, cladribine, fingolimod, siponimod or daclizumab) during study follow-up were assessed as potential modifiers of the outcome. Multicollinearity was assessed using the variance inflation factor with larger values providing stronger evidence of multicollinearity.
Let, denote the time to SPMS conversion after diagnosis of RRMS for the i-th patient from the j-th country.
where, denotes the hazard function for the i-th patient within the j-th country, while denotes the Weibull baseline hazard function. The and denote vectors of patient-level covariates and the country-level covariates (latitude, national multiple sclerosis prevalence and government health expenditure), respectively. The denotes the random effect associated with the j-th country, which accounts for within-country homogeneity in the outcome. λ and are the scale and the shape parameters of the Weibull distribution.
The difference in the effect of latitude on the hazard of SPMS conversion with varying proportion of time on high-to-moderate efficacy disease-modifying therapy was evaluated in a secondary analysis through inclusion of an interaction term in Model (1).
Next, to investigate heterogeneity in the risk of SPMS conversion across countries, we modelled geographically referenced areal data of time to SPMS with a spatial parametric proportional hazards frailty model, while accounting for patient-specific prognostic factors. The location of country of residence was incorporated through a spatially continuous, stationary latent Gaussian field Y, of which is the value of the field at the location of country j:
The exponential covariance function for Y, is a function of the Euclidean distance (d) between the coordinates of any two countries, marginal variance ( ) of the Gaussian field Y, and spatial decay parameter, . The spatially correlated frailties modelled by the Gaussian stochastic process account for the unobserved spatial variation, which cannot be explained by patient-specific prognostic factors included in the model.
Spatial heterogeneity in SPMS risk is illustrated with a map of the predicted risk-exceedance probabilities for individual countries.
To minimize the likelihood of under-reporting or delayed diagnosis of SPMS by clinicians, sensitivity analyses were performed using two different definitions of SPMS. We enriched the group with clinician-diagnosed SPMS with patients identified by the operationalized definition. The operationalized definition relies on longitudinal data from relapsing-remitting phase to identify 3-month confirmed increase in EDSS in the absence of relapses in patients with EDSS ≥4 and pyramidal score ≥2. The decision tree developed in the Swedish Multiple Sclerosis registry, relies on the most recent EDSS score and patient age.
In two more sensitivity analyses we adjusted the primary analysis for ethnicity and different multiple sclerosis diagnostic criteria (Poser/McDonald 2010/McDonald 2017).
All the analyses were implemented within the Bayesian framework. For all regression coefficients, weakly informative prior distributions were assumed. Estimates of the parameters were obtained through Markov chain Monte Carlo simulation using the R package ‘spatsurv’, based on sampling chains of 350 000 iterations following the 100 000 iterations of burn-in period. To eliminate autocorrelation among samples within the chains, every 50th iteration was selected. The convergence of sampling chains was assessed with trace and density plots of the posterior distributions. All continuous covariates were standardized to mean 0 and standard deviation (SD) 1 to accelerate convergence. Modified Cox-Snell residuals and deviance residuals were used to evaluate the goodness-of-fit of the proportional hazards models.
Results
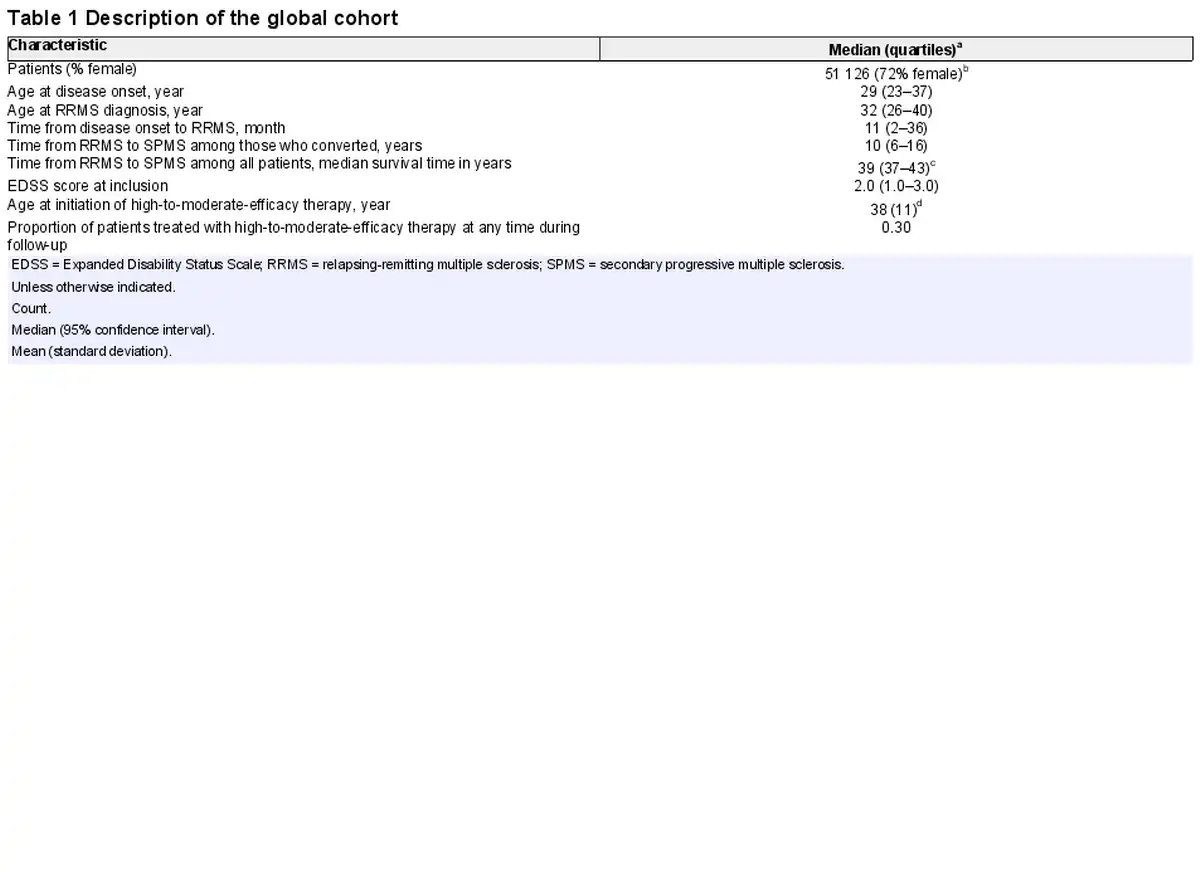
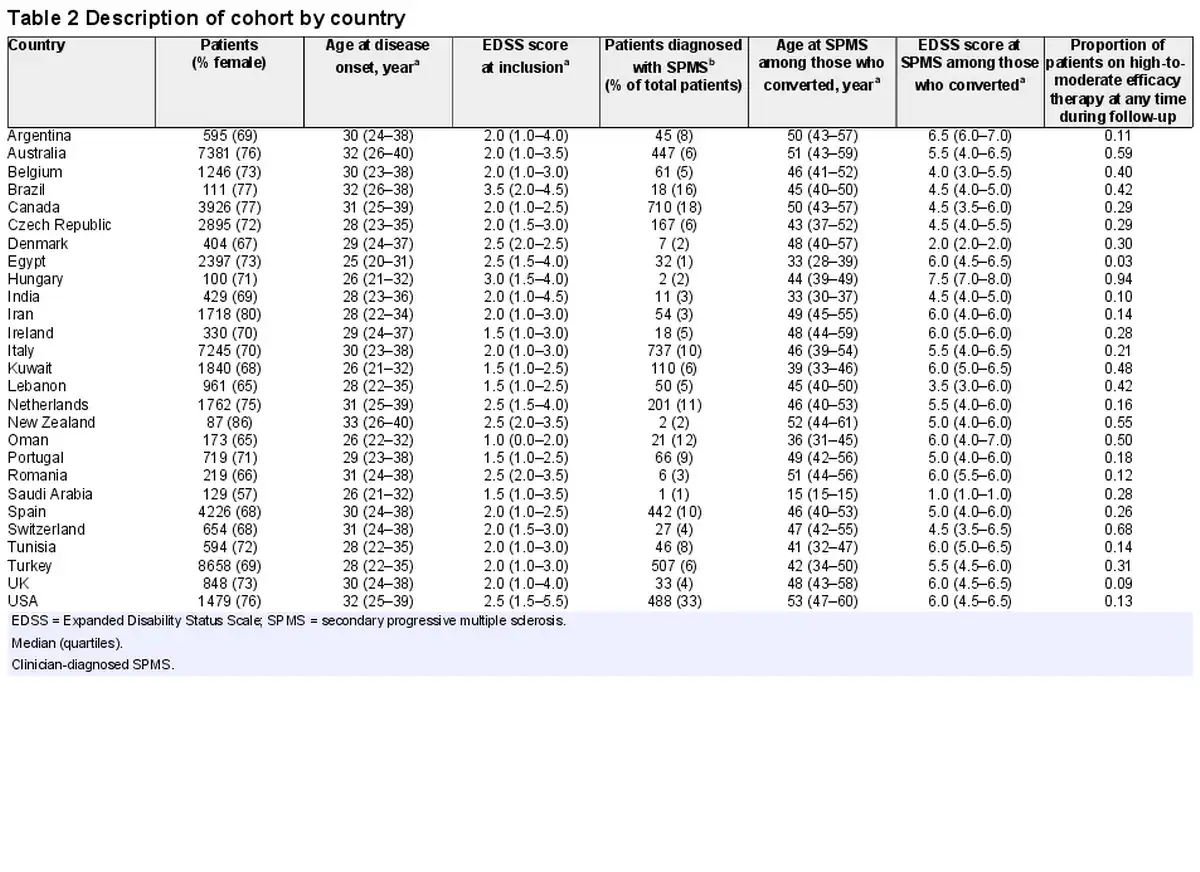
Fifty-one thousand one hundred and twenty-six patients from 27 countries were included in the analyses (Fig. 1), of which 72% were female (Table 1). Four thousand three hundred and nine patients were diagnosed with SPMS by their treating clinician. The median age at RRMS diagnosis was 32 (quartiles 26–40) years. The median time from RRMS to SPMS conversion was 39 [95% confidence interval (CI): 37 to 43] years, which means 50% of the whole study cohort converted to SPMS within 39 years from RRMS diagnosis. Among the 4309 patients with clinician-diagnosed SPMS, the median time from RRMS to SPMS conversion was 10 (quartiles 6–16) years. A description of the study cohort by country is provided in Table 2. There was a little evidence for multicollinearity of the analysed data (largest variance inflation factor of 1.3 for the national multiple sclerosis prevalence and latitude).
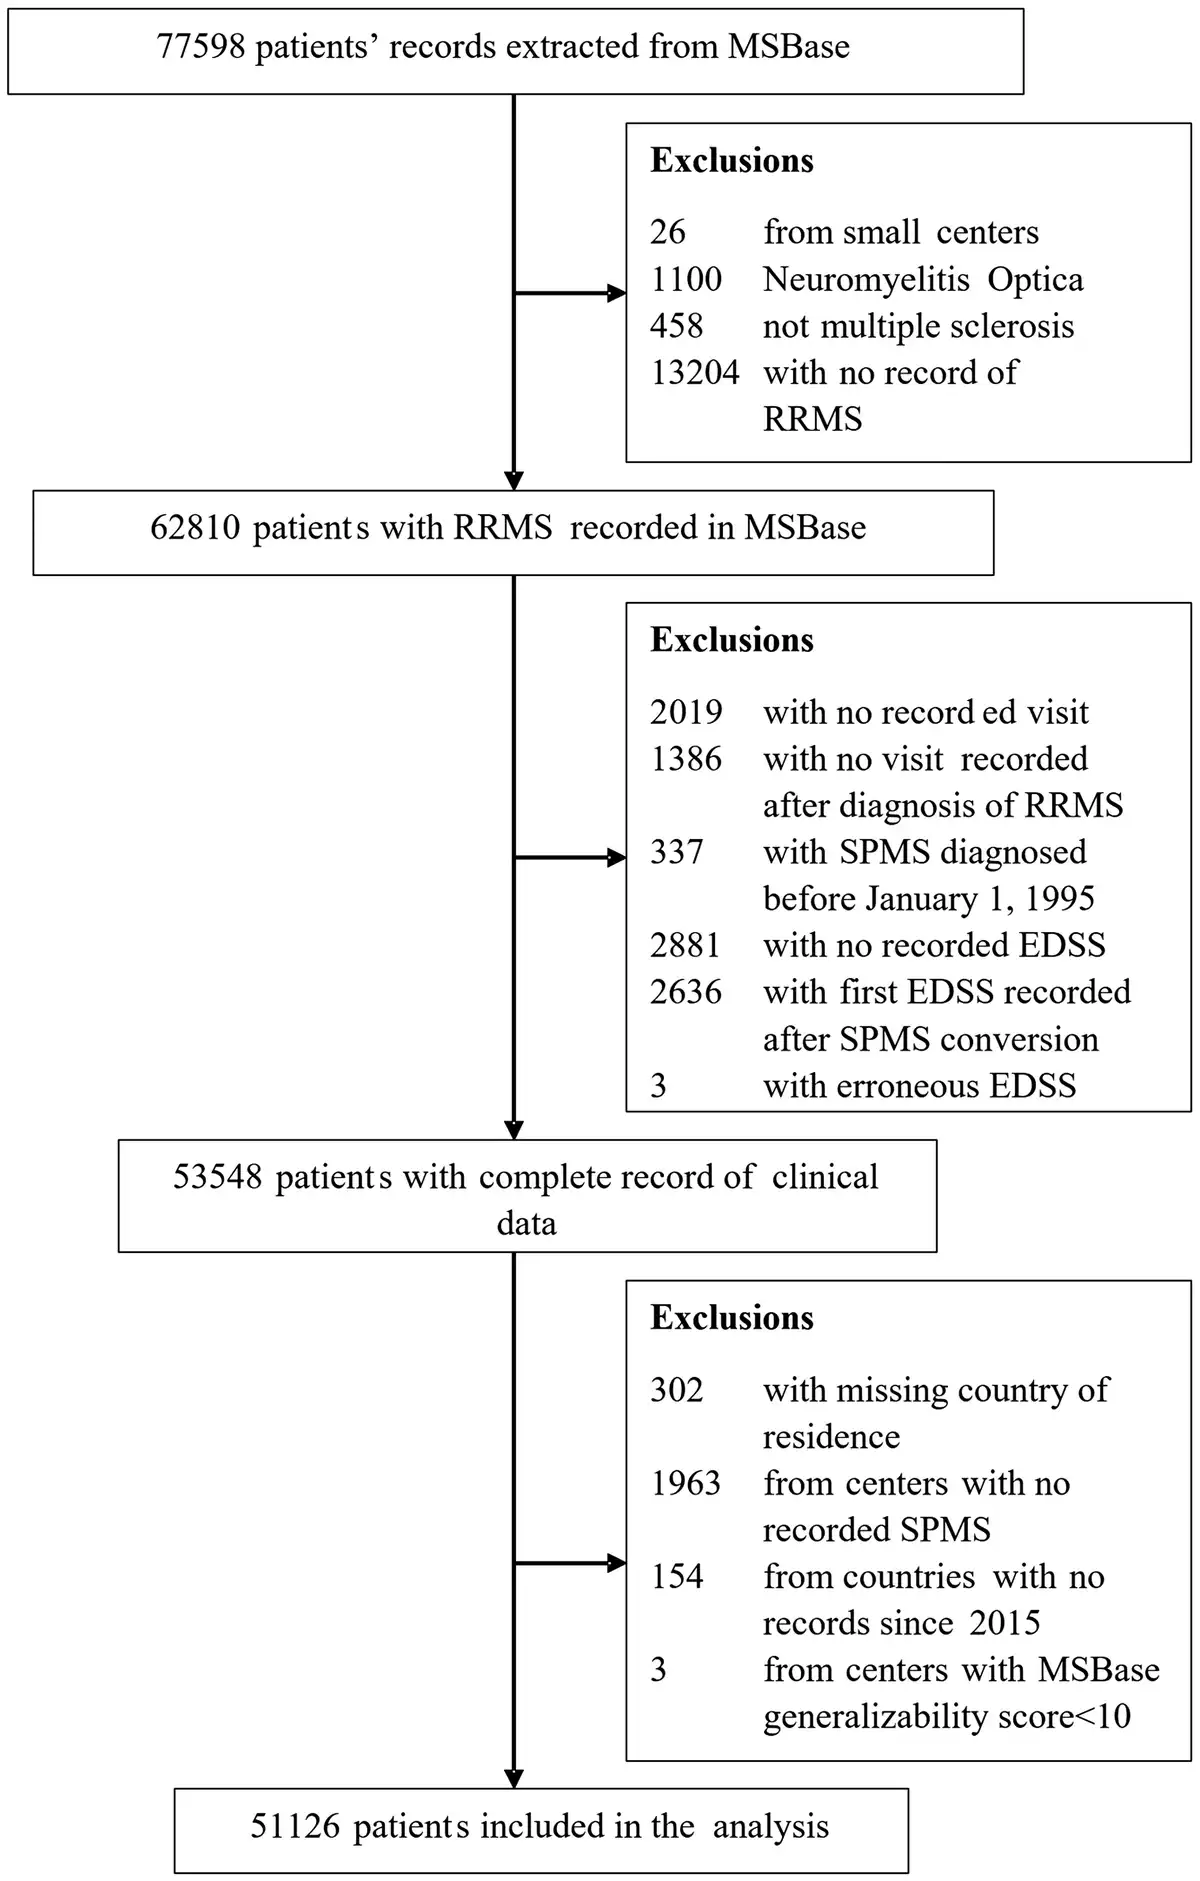
Figure 1
CONSORT chart of patient disposition. RRMS = relapsing-remitting multiple sclerosis; SPMS = secondary progressive multiple sclerosis.
The posterior median hazard ratio (HR) and associated 95% credible interval (CrI) for the parameters of Model (1) are given in Table 3. Higher latitude was associated with greater hazard of SPMS conversion [HR = 1.22 (95% CrI: 1.17 to 1.28)]. The median increase in the hazard of SPMS for every 27° (1 SD) increase in latitude was 22%. It is not surprising that higher national multiple sclerosis prevalence was associated with higher conversion risk of SPMS [1.06 (1.02 to 1.10)]. The median increase in the hazard of SPMS for every additional 70 (1 SD) patients with multiple sclerosis per 100 000 population was 6%. Importantly, longer time on high-to-moderate efficacy disease-modifying therapy was associated with a substantial reduction in the hazard of SPMS conversion [0.76 (0.73 to 0.79)]. With every 42% (1 SD) increase in the time treated with high-to-moderate efficacy therapy, the median hazard of SPMS decreased by 34%. Interaction term from secondary analysis revealed a 5% decline in the effect of latitude on median hazard of SPMS for every 42% (1 SD) increase in the time treated with high-to-moderate efficacy therapy [0.95 (0.92 to 0.99)].
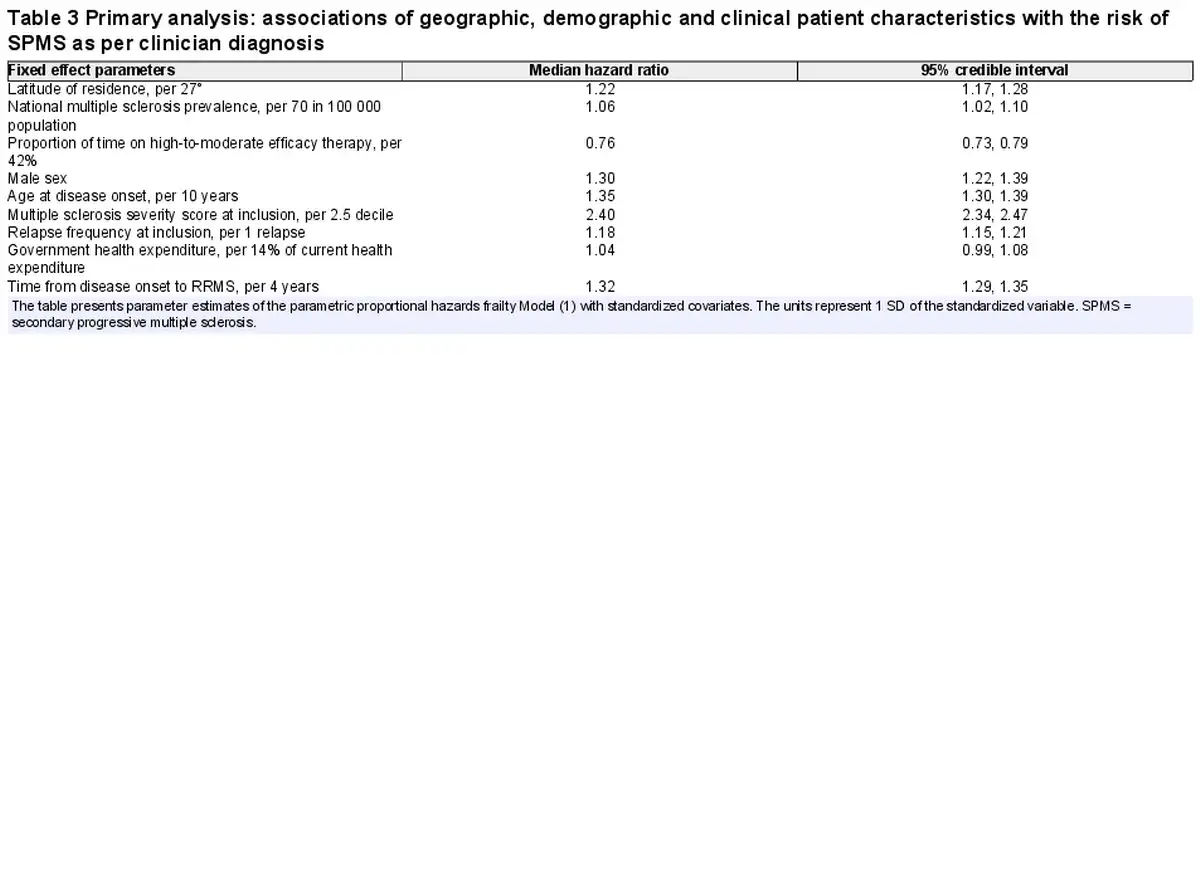
As expected, hazard of SPMS conversion was higher in males compared to females [1.30 (1.22 to 1.39)]. Also, older age at disease onset [1.35 (1.30 to 1.39), 35% higher hazard per 10 older years], higher MSSS [2.40 (2.34 to 2.47), 140% higher hazard per 2.5 higher MSSS decile] and more frequent relapses at study inclusion [1.18 (1.15 to 1.21), 18% higher hazard per one additional relapse] were associated with higher hazard of SPMS.
All these associations were robust to further adjustment for ethnicity and different multiple sclerosis diagnostic criteria. We did not observe any evidence for an association between ethnicity and the hazard of SPMS [Asian: ref; Black/African American: 1.15 (0.81 to 1.60); Caucasian: 1.17 (0.96 to 1.44); Middle Eastern: 0.93 (0.71 to 1.20); Others: 0.93 (0.31 to 3.08)]. Clinically definite multiple sclerosis cases diagnosed using McDonald 2010 [0.58 (0.51 to 0.67)] and 2017 diagnostic criteria [0.56 (0.36 to 0.88)] were associated with lower hazards of SPMS compared to the Poser diagnostic criteria.
To ensure that our findings were robust to under-reporting or delayed diagnosis of SPMS by clinicians, we performed two sensitivity analyses using (i) a merged cohort of clinician-diagnosed SPMS enriched with cases identified by the operationalized definition of SPMS; and (ii) SPMS identified by the Swedish decision tree classifier. The median survival time from RRMS to SPMS conversion was 34 (95% CI: 33 to 36) years in the former cohort and 24 (95% CI: 23 to 24) years in the latter. In both analyses, there was consistent evidence of the association of latitude with SPMS (Supplementary Table 1). Persistent treatment with high-to-moderate efficacy disease-modifying therapy was consistently associated with reduced risk of SPMS, although the narrow 95% CrI marginally cross the null value of one. Interestingly, in the analysis of SPMS identified by the decision tree classifier, the association of national multiple sclerosis prevalence with the hazard of SPMS was inverse [0.84 (0.82 to 0.86)].
The spatial parametric proportional hazards model showed that country of residence was associated with the risk of SPMS conversion. The spatial variance [0.73 (95% CrI: 0.55 to 0.96)] confirms presence of spatial heterogeneity in the risk of SPMS. The posterior median for the Weibull shape parameter is 1.80 (95% CrI: 1.76 to 1.84); a value >1 suggests increasing hazard of SPMS conversion over time.
Figure 2 illustrates predicted risk-exceedance probabilities for individual countries. Red colour indicates that the probability of the covariate-adjusted relative risk (‘cases’ relative to ‘controls’) of SPMS > 1 in the given country is close to 100%. In countries coloured green, the probability that their relative risk of SPMS exceeding 1 is close to 0%. Higher exceedance probabilities therefore indicate countries where time to SPMS conversion are usually short, given the clinical and demographic characteristics of patients recorded in these countries and considering the regional risk of SPMS. In the primary analysis of clinician-diagnosed SPMS, Oman, Kuwait, Canada, Iran, Brazil, Lebanon and Tunisia had substantially higher risk of SPMS conversion than the rest of the countries. The relatively higher risks of SPMS conversion in Oman, Tunisia, Iran and Canada are consistent in the sensitivity analyses using the two alternative SPMS definitions (Supplementary Figs 1 and 2).
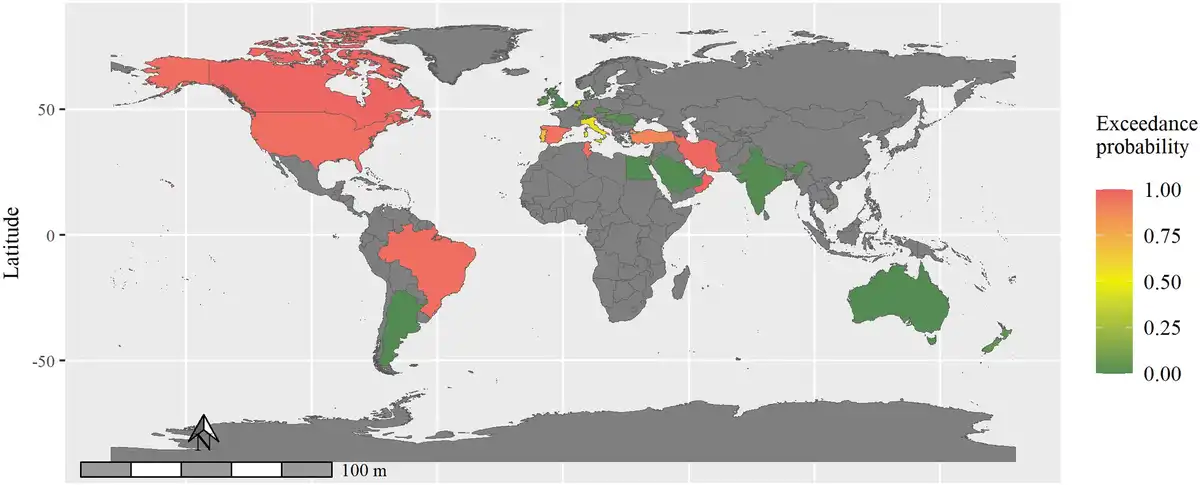
Figure 2
Map of predicted risk-exceedance probabilities. Shades of red indicate countries with substantially shorter time to secondary progressive multiple sclerosis (SPMS) conversion than those that are coloured with shades of green. Countries coloured in grey did not contribute to the MSBase registry or were excluded at the data quality assessment.
Figure 3 highlights the difference in the posterior median probabilities of remaining SPMS free for four randomly selected patients of similar clinical and demographic characteristics from Australia, Turkey, Canada and Oman.
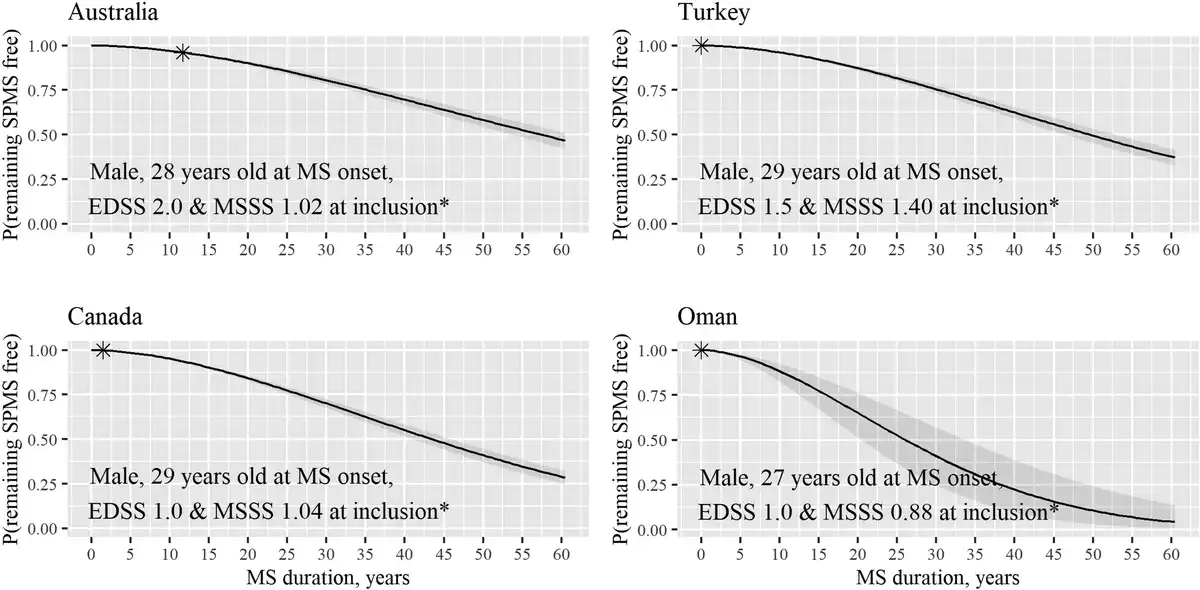
Figure 3
Posterior median probabilities of remaining SPMS-free. An example provided for four patients with similar characteristics at study inclusion (asterisk) from four countries. Grey areas represent the respective 95% credible bands. This example illustrates variability in the probability of remaining SPMS-free for patients living in four countries after accounting for patients’ clinical and demographic characteristics.
Discussion
In this large longitudinal study of 51 126 patients with multiple sclerosis from 27 countries, we have demonstrated significant geographical variation in the risk of SPMS. Higher latitude of country of residence was generally associated with increased risk of SPMS. The conversion to SPMS was further increased in certain countries, for example, in Oman, Tunisia, Iran or Canada. Importantly, persistent treatment with high-to-moderate efficacy disease-modifying therapy reduced this risk. These observations were consistent after accounting for ethnicity, differences in multiple sclerosis diagnostic criteria, and different diagnostic definitions of SPMS.
The median time to SPMS from RRMS diagnosis estimated in our study is significantly longer than previous estimates. In 2010, a study from the British Columbia, Canada, including patients with clinically definite multiple sclerosis, diagnosed according to the Poser diagnostic criteria estimated median survival time from disease onset to SPMS as 21.4 (95% CI: 20.6 to 22.2) years. In 2016, the EPIC study comprising a cohort of actively treated patients from the Multiple Sclerosis Center at the University of California, San Francisco, reported a median survival time of 35 years from disease onset to SPMS. In 2019, using data from the MSBase registry, we reported a median survival time from disease onset to SPMS of 32.4 (95% CI: 31.1 to 33.7) years. In this study, we report 39 (95% CI: 37 to 43) years as the median time to SPMS from RRMS diagnosis. The increasing time to SPMS conversion is driven by the increasing number of patients who do not convert to SPMS during the study follow-up. Among several factors, this trend may be driven by improvement in multiple sclerosis diagnostic criteria and more persistent use of high-to-moderate efficacy disease-modifying therapies during the relapsing-remitting phase. Among the subset of patients who converted to SPMS, median time to SPMS from RRMS diagnosis is 10 (quartiles 6–16) years, which is in line with the recent estimate reported in an Italian SPMS cohort.
Previous studies have documented considerable geographic variation in the incidence and prevalence of multiple sclerosis. A meta-analysis revealed a positive association between a higher latitude and the prevalence of multiple sclerosis, which peaked around 55° and reversed above 60°. In Australasia, UK, Atlantic region and Central Europe, North America and Western Europe, a positive latitudinal gradient for multiple sclerosis prevalence is well established. Further, our recent study among 46 128 patients from 26 countries demonstrated increased multiple sclerosis severity with increasing latitude above 40°, closely associated with the surface dose of the UV B radiation. Our present study extends our knowledge of the geographic determinants of multiple sclerosis, establishing a positive latitudinal gradient in the risk of SPMS. Furthermore, for the first time, it is now shown that persistent use of high-to-moderate efficacy disease-modifying therapy can mitigate this latitudinal effect on the risk of SPMS.
Interestingly, while adjusting for potential under-reporting in clinician-diagnosed SPMS, we have identified an association between government health expenditure and SPMS conversion risk. Even though the magnitude of the observed effect size is small, our result suggests that important health disparities exist between countries, with impact on the course and outcomes of multiple sclerosis.
We observed an association between higher national multiple sclerosis prevalence and greater risk of clinician-diagnosed SPMS. This association is probably driven by greater experience of neurologists with management of multiple sclerosis and confidence in diagnosing SPMS in countries with higher disease prevalence. In contrast, in sensitivity analysis higher national prevalence of multiple sclerosis was associated with lower risk of SPMS diagnosed with the decision tree algorithm (i.e. independent from neurologists’ judgement). This most likely represents the results of better management of RRMS in countries with higher disease prevalence, and thereby a delayed progression to more substantial disability.
Many studies have reported associations of male sex, older age at disease onset, higher EDSS score and greater number of relapses early in the disease course with increased risk of SPMS., In our study, SPMS risk was elevated among patients with higher MSSS at the inclusion, more frequent relapses during the subsequent year, male sex, and older age at onset, in keeping with previous studies.
As expected, the more contemporary diagnostic criteria (McDonald 2010 and 2017) were associated with lower risk of SPMS than the Poser diagnostic criteria. This reflects the fact that the current diagnostic criteria enable diagnosis of less severe multiple sclerosis and facilitate the diagnosis earlier in the disease course, thus giving a longer duration of relapsing-remitting course before converting to SPMS. The average shorter delay to diagnosis may also contribute to the increasingly longer median time from RRMS to SPMS.
The findings of our study are strengthened by the use of three different definitions of SPMS to demonstrate geographical variation in the risk of SPMS in a large and diverse population from 27 countries and across a broad range of latitudes. The analysis accounted for the effects of country-specific variables, such as national multiple sclerosis prevalence and government health expenditure, to serve as a proxy for the experience with diagnosis and management of multiple sclerosis and availability of resources in the national healthcare systems, respectively. Most notably, we have employed a novel statistical approach to carry out a geographically informed search for the countries with above-average risk of SPMS conversion. The two-stage analytical approach allowed us to account for heterogeneity among individuals and among countries in unobserved factors associated with the risk of SPMS.
The results of this study need to be considered in the context of its limitations. First, the data of current residence were recorded at the time of entry to the MSBase registry. The registry does not monitor changes in residence and migration during the follow-up. Registry data are subject to heterogeneity associated with variability in data sources and data entry conventions at different countries and centres. The use of Neurostatus certification helps mitigate this heterogeneity in relation to disability assessment with EDSS—the key information that was used to identify SPMS by the operationalized definition and the decision tree algorithm. The patient datasets available at different countries may not be representative of the national multiple sclerosis populations. To maximize representativeness of the study population, we followed a rigorous data quality and generalizability procedure, with a special focus on compatibility of the reported clinical and demographic information with the known epidemiology of multiple sclerosis. Spatial frailty models are commonly used for modelling of spatial data at the small area scale while assuming that populations from neighbouring regions share more features than those from distant regions. Considering the regional similarities in environments, lifestyle, diet, epidemiology, diagnostics and management of multiple sclerosis, we extended this approach to model variations at the country level. The statistical significance of the spatial variance confirms the presence of spatial heterogeneity across the studied regions. Nonetheless, we acknowledge that our analysis does not capture the heterogeneity at the sub-country regional level.
In summary, the risk of SPMS is associated with higher latitude of residence, independent of ethnicity and multiple sclerosis diagnostic criteria. This geographically determined risk of SPMS can be mitigated by persistent treatment with high-to-moderate efficacy disease-modifying therapy.
Acknowledgements
We thank the patients who contributed to the MSBase registry, the participating neurologists, and the principal investigators for supporting this study. The list of MSBase Study Group contributors is provided in Appendix 1. Administrative and technical support was provided by the MSBase administrations Ms Charlotte Sartori, Dr Sabah Quddus and Ms Eloise Hinson.
References
- 1. Simpson S, Blizzard L, Otahal P, Van der Mei I, Taylor B. Latitude is significantly associated with the prevalence of multiple sclerosis: A meta-analysis. J Neurol Neurosurg Psychiatry. 2011;82:1132–1141.
- 2. Simpson S, Wang W, Otahal P, Blizzard L, van der Mei IA, Taylor BV. Latitude continues to be significantly associated with the prevalence of multiple sclerosis: An updated meta-analysis. J Neurol Neurosurg Psychiatry. 2019;90:1193–1200.
- 3. Lucas R, Ponsonby A-L, Dear K, et al Sun exposure and vitamin D are independent risk factors for CNS demyelination. Neurology. 2011;76:540–548.
- 4. Simpson S Jr, Van der Mei I, Lucas RM, et al Sun exposure across the life course significantly modulates early multiple sclerosis clinical course. Front Neurol. 2018;9:16.
- 5. Vitkova M, Diouf I, Malpas C, et al Association of latitude and exposure to ultraviolet B radiation with severity of multiple sclerosis: An international registry study. Neurology. 2022;98:e2401–e2412.
- 6. Banerjee S, Carlin BP, Gelfand AE. Hierarchical modeling and analysis for spatial data. Chapman and Hall/CRC; 2003.
- 7. Butzkueven H, Chapman J, Cristiano E, et al MSBase: An international, online registry and platform for collaborative outcomes research in multiple sclerosis. Mult Scler. 2006;12:769–774.
- 8. Kalincik T, Kuhle J, Pucci E, et al Data quality evaluation for observational multiple sclerosis registries. Mult Scler. 2017;23:647–655.
- 9. Lublin FD, Reingold SC, Cohen JA, et al Defining the clinical course of multiple sclerosis: The 2013 revisions. Neurology. 2014;83:278–286.
- 10. Lublin FD, Reingold SC. Defining the clinical course of multiple sclerosis: Results of an international survey. Neurology. 1996;46:907–911.
- 11. The Multiple Sclerosis International Federation. Atlas of MS, 3rd ed.The Multiple Sclerosis International Federation (MSIF); 2020.
- 12. World Bank. World development indicators 2019. The World Bank; 2019.
- 13. Lorscheider J, Buzzard K, Jokubaitis V, et al Defining secondary progressive multiple sclerosis. Brain. 2016;139:2395–2405.
- 14. Ramanujam R, Zhu F, Fink K, et al Accurate classification of secondary progression in multiple sclerosis using a decision tree. Mult Scler. 2021;27:1240–1249.
- 15. Koch M, Kingwell E, Rieckmann P, Tremlett H. The natural history of secondary progressive multiple sclerosis. J Neurol Neurosurg Psychiatry. 2010;81:1039–1043.
- 16. Cree BA, Gourraud PA, Oksenberg JR, et alUniversity of California SFMET Long-term evolution of multiple sclerosis disability in the treatment era. Ann Neurol. 2016;80:499–510.
- 17. Fambiatos A, Jokubaitis V, Horakova D, et al Risk of secondary progressive multiple sclerosis: A longitudinal study. Mult Scler. 2020;26:79–90.
- 18. Iaffaldano P, Lucisano G, Patti F, et al Transition to secondary progression in relapsing-onset multiple sclerosis: Definitions and risk factors. Mult Scler. 2021;27:430–438.
- 19. Scalfari A, Neuhaus A, Daumer M, Muraro PA, Ebers GC. Onset of secondary progressive phase and long-term evolution of multiple sclerosis. J Neurol Neurosurg Psychiatry. 2014;85:67–75.
- 20. Vukusic S, Confavreux C. Prognostic factors for progression of disability in the secondary progressive phase of multiple sclerosis. J Neurol Sci. 2003;206:135–137.
- 21. Confavreux C, Vukusic S, Adeleine P. Early clinical predictors and progression of irreversible disability in multiple sclerosis: An amnesic process. Brain. 2003;126:770–782.
- 22. Stankoff B, Mrejen S, Tourbah A, et al Age at onset determines the occurrence of the progressive phase of multiple sclerosis. Neurology. 2007;68:779–781.