INTRODUCTION
Cancer is the second leading cause of death in the United States overall and the leading cause among people younger than 85 years. The coronavirus disease 2019 (COVID‐19) pandemic caused delays in the diagnosis and treatment of cancer in 2020 because of health care setting closures, loss of employment and health insurance, and fear of COVID‐19 exposure., The extent to which these delays lead to increased diagnosis of advanced‐stage disease and higher cancer mortality will be revealed gradually over many years. A recent modeling study estimated 4000 to 7000 excess deaths from colorectal cancer (CRC) by 2040, depending on the speed of screening recovery. What is already established is the disproportionate direct and indirect impact of the pandemic on communities of color,, including slower recovery of cancer screening, which will likely exacerbate existing cancer disparities.
In this article, we provide the estimated numbers of new cancer cases and deaths in 2025 in the United States nationally and for each state as well as a comprehensive overview of cancer occurrence based on up‐to‐date, population‐based data for cancer incidence and mortality through 2021 and 2022, respectively. We also estimate the total number of cancer deaths averted through 2022 because of the continuous decline in the cancer death rate over the past several decades.
MATERIALS AND METHODS
Data sources
Population‐based cancer incidence data in the United States have been collected by the National Cancer Institute's (NCI's) Surveillance, Epidemiology, and End Results (SEER) program since 1973 and by the Centers for Disease Control and Prevention's (CDC's) National Program of Cancer Registries (NPCR) since 1995. The SEER program is the only source for historic population‐based incidence data from the eight oldest SEER areas (Connecticut, Hawaii, Iowa, New Mexico, Utah, and the metropolitan areas of Atlanta, San Francisco‐Oakland, and Seattle‐Puget Sound), representing approximately 8% of the US population. Historical survival data (1975–1977 and 1995–1997) are based on the SEER 8 areas plus the Detroit metropolitan area, as published previously. Contemporary survival statistics are based on data from the SEER 8 registries plus the Alaska Native Tumor Registry and the registries in California, Georgia, Idaho, Kentucky, Louisiana, New Jersey, New York, and Texas, representing 42% of the US population, with vital status follow‐up through 2021. All 22 SEER registries (with the addition of Massachusetts and Illinois), covering 48% of the United States, were the source for the probability of developing cancer.
The North American Association of Central Cancer Registries (NAACCR) compiles and reports incidence data from 1995 forward for registries that participate in the SEER program and/or the NPCR. These data approach 100% coverage of the US population for the most recent years and were the source for the projected new cancer cases in 2025, contemporary incidence trends, cross‐sectional incidence rates, and stage distribution., The incidence data presented herein differ slightly from those published online in the NAACCR's Cancer in North America (CiNA) Explorer (apps.naaccr.org/explorer/, September 1, 2024) because rates are adjusted for delays in case reporting using national delay factors. Incidence data for Puerto Rico were abstracted from the CiNA Explorer.
Mortality data from 1930 to 2022 were provided by the National Center for Health Statistics (NCHS)., Forty‐seven states and the District of Columbia met data quality requirements for reporting to the national vital statistics system in 1930, and Texas, Alaska, and Hawaii began reporting in 1933, 1959, and 1960, respectively. The methods for abstraction and age‐adjustment of mortality data before 1969 are described elsewhere., Contemporary 5‐year mortality rates for Puerto Rico were obtained from State Cancer Profiles (statecancerprofiles.cancer.gov, August 1, 2024), a collaboration between the CDC and the NCI.
All cancer cases were classified according to the International Classification of Diseases for Oncology, third edition, except childhood and adolescent cancers, which were classified according to the International Classification of Childhood Cancer., , Causes of death were classified according to the International Classification of Diseases.
Statistical analysis
Incidence and mortality
All incidence and death rates were age standardized to the 2000 US standard population (19 age groups) and expressed per 100,000 persons (or per million for childhood and adolescent cancer incidence), as calculated by the NCI's SEER*Stat software, version 8.4.2. Population data were modified intercensal annual county estimates by age, sex, race, and Hispanic origin produced by the US Census Bureau and the NCHS with support from the NCI except for 2010–2019 data, which were produced by Woods & Poole Economics, Inc. through a contract with the NCI, and 2020–2022 data, which were based on Vintage 2022 estimates. Official US Census Bureau intercensal population estimates are anticipated to be released in fall 2024 and will be incorporated into 2025 data releases (https://seer.cancer.gov/popdata/, September 1, 2024). Population estimates incorporate race‐bridging, which combines multiple‐race categories in the 2000 and 2010 census into individual race categories. For more information on population estimates issued by the US Census Bureau, see census.gov/programs‐surveys/popest/guidance.html, July 1, 2024.
The probability of developing cancer was calculated using the NCI's DevCan software, version 6.9.1, and the annual percent change (APC) in rates was quantified using the NCI's Joinpoint Regression Program, version 5.2.0. Trends were described as increasing or decreasing when the APC was statistically significant based on a two‐sided p value < .05, calculated using the parametric method, and otherwise were described as stable. Trend and lifetime risk analyses exclude cancer incidence in 2020 because the Joinpoint and DevCan modeling programs were not designed to accommodate such a large, single‐year data anomaly as occurred because of pandemic‐related disruptions in health care.
All statistics presented by race are exclusive of Hispanic ethnicity for reduced racial misclassification. Racial misclassification for the American Indian and Alaska Native (AIAN) population was further mitigated by restricting incidence rates to Purchased/Referred Care Delivery Area counties and adjusting nationally representative mortality rates using classification ratios previously published by the NCHS. Life tables by Hispanic ethnicity were published in 2018 and were used for relative survival comparisons between White and Black individuals.
Whenever possible, cancer incidence rates were adjusted for delays in reporting, which occur because of lags in case capture and data corrections. Delay adjustment has the largest effect on the most recent data years and for cancers that are frequently diagnosed in outpatient settings (e.g., melanoma, leukemia, and prostate cancer). For example, the leukemia incidence rate for 2021 was 13% higher after adjusting for reporting delays (15.4 vs. 13.6 per 100,000 persons). Delay adjustment is particularly important when quantifying contemporary trends.
Projected cancer cases and deaths in 2025
The most recent year for which incidence and mortality data are available lags 2–3 years behind the current year because of the time required for data collection, compilation, quality control, and dissemination. Therefore, we project the numbers of new cancer cases and deaths in the United States in 2025 to estimate the contemporary cancer burden using two‐step statistical modeling described in detail elsewhere., Briefly, complete cancer diagnoses were estimated for every state from 2007 through 2021 based on high‐quality, delay‐adjusted incidence data from 50 states and the District of Columbia (99.7% population coverage) and state‐level variations in sociodemographic characteristics, lifestyle factors, medical settings, and cancer screening behaviors. Counts were adjusted for the deficit in cases during March through May 2020 because of the COVID‐19 pandemic based on the proportion of cases diagnosed in those months in previous years. Modeled state and national counts were then projected 4 years ahead using a novel, data‐driven Joinpoint algorithm. Basal cell and squamous cell skin cancers cannot be estimated because these diagnoses are not recorded by most cancer registries.
Ductal carcinoma in situ of the female breast and in situ melanoma of the skin were estimated by approximating annual case counts from 2012 through 2021 based on NAACCR age‐specific incidence rates, delay factors for invasive disease (delay factors are unavailable for in situ cases), and US population estimates. Counts were then projected 4 years ahead based on the average APC generated by the Joinpoint regression model. The number of cancer deaths expected to occur in 2025 was estimated by applying the previously described, data‐driven Joinpoint algorithm to reported cancer deaths from 2008 through 2022 at the state and national levels.
Other statistics
The number of cancer deaths averted in men and women because of the reduction in cancer death rates since the early 1990s was estimated by summing the annual difference between the number of cancer deaths recorded and the number that would have been expected if cancer death rates had remained at their peak. The expected number of deaths was estimated by applying the 5‐year, age‐specific and sex‐specific cancer death rate in the peak year for age‐standardized cancer death rates (1990 in men, 1991 in women) to the corresponding age‐specific and sex‐specific population in subsequent years through 2022.
SELECTED FINDINGS
Expected number of new cancer cases and deaths
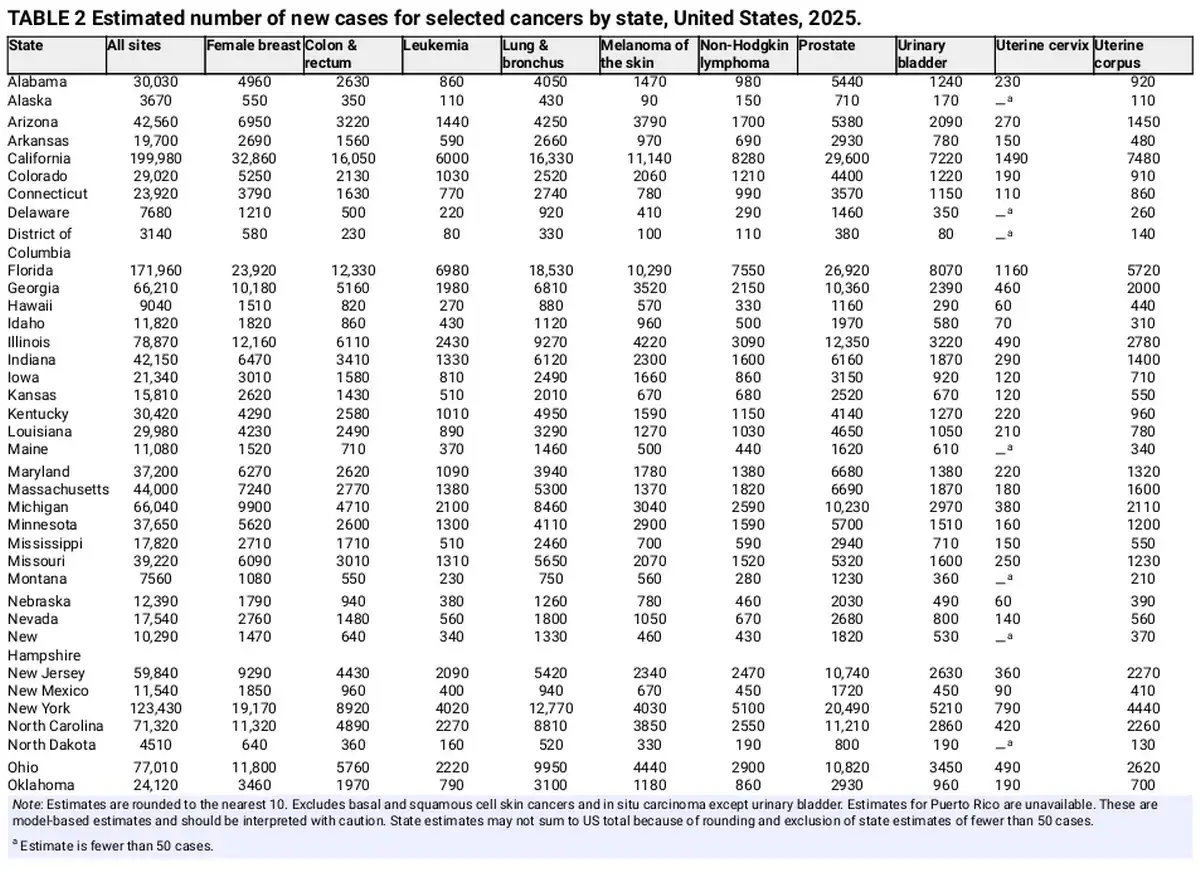
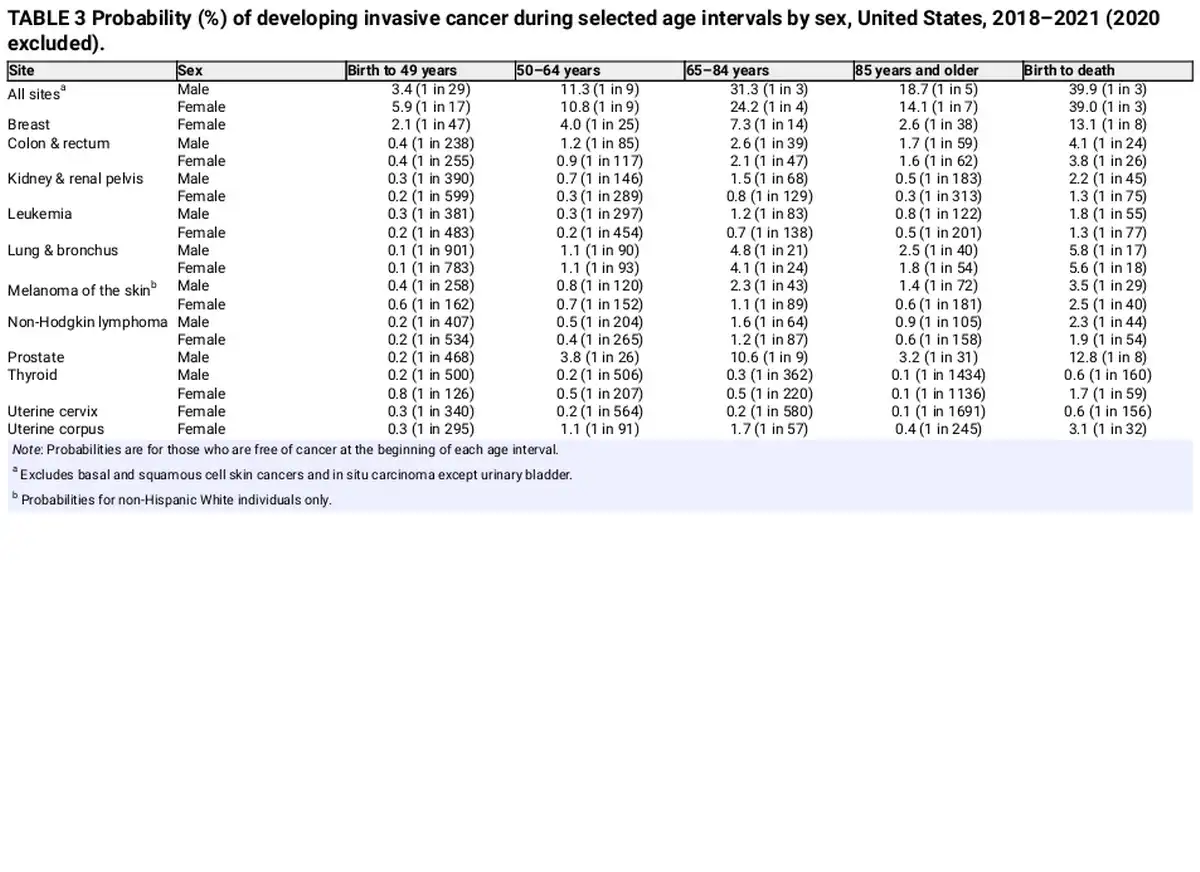
Table 1 presents the estimated numbers of new invasive cancer cases in the United States in 2025 by sex and cancer type. In total, there will be approximately 2,041,910 new cancer diagnoses, the equivalent of about 5600 cases each day. In addition, there will be about 59,080 new cases of ductal carcinoma in situ in women and 107,240 new cases of melanoma in situ of the skin in 2025. The estimated numbers of new cases for selected cancers by state are shown in Table 2. The lifetime probability of being diagnosed with invasive cancer is only slightly higher for men (39.9%) than for women (39.0%; Table 3).
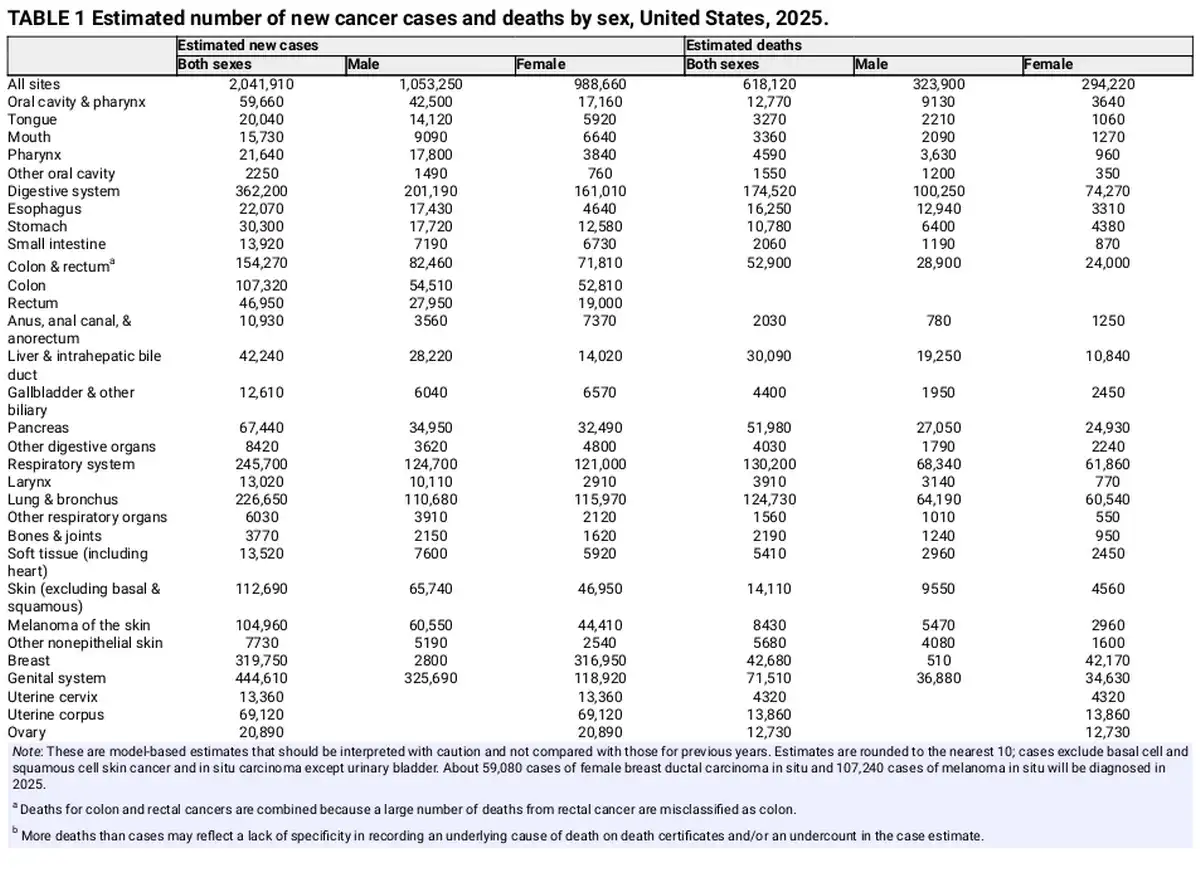
Although cancer risk increases exponentially with advancing age, the proportion of new diagnoses in adults aged 65 years and older decreased from 61% in 1995 to 59% in 2021 despite the growth of this age group in the general population from 13% to 17%. In contrast, the proportion of adults aged 50–64 years increased in both the cancer patient population, from 25% to 29%, and the general population, from 13% to 19%. The shift toward more middle‐aged patients partly reflects steep declines in incidence among older men for smoking‐related cancers and prostate cancer from the early 1990s through the late 2000s. Also contributing more recently is increased cancer risk in people born since the 1950s because of changing patterns in known exposures (e.g., higher obesity rates), as well as other factors yet to be elucidated. Although people younger than 50 years were the only age group to experience an increase in cancer incidence from 1995 through 2021, the steep drop in population size (from 74% to 64%) drove a decrease in the proportion of cancer diagnoses in this age group from 15% to 12%.
Figure 1 depicts the most common cancers diagnosed in men and women in 2025. Prostate cancer, lung and bronchus (hereinafter lung) cancer, and CRC account for almost one half (48%) of all incident cases in men, with prostate cancer alone accounting for 30% of diagnoses. For women, breast cancer, lung cancer, and CRC account for 51% of all new diagnoses, with breast cancer alone accounting for 32% of cases.
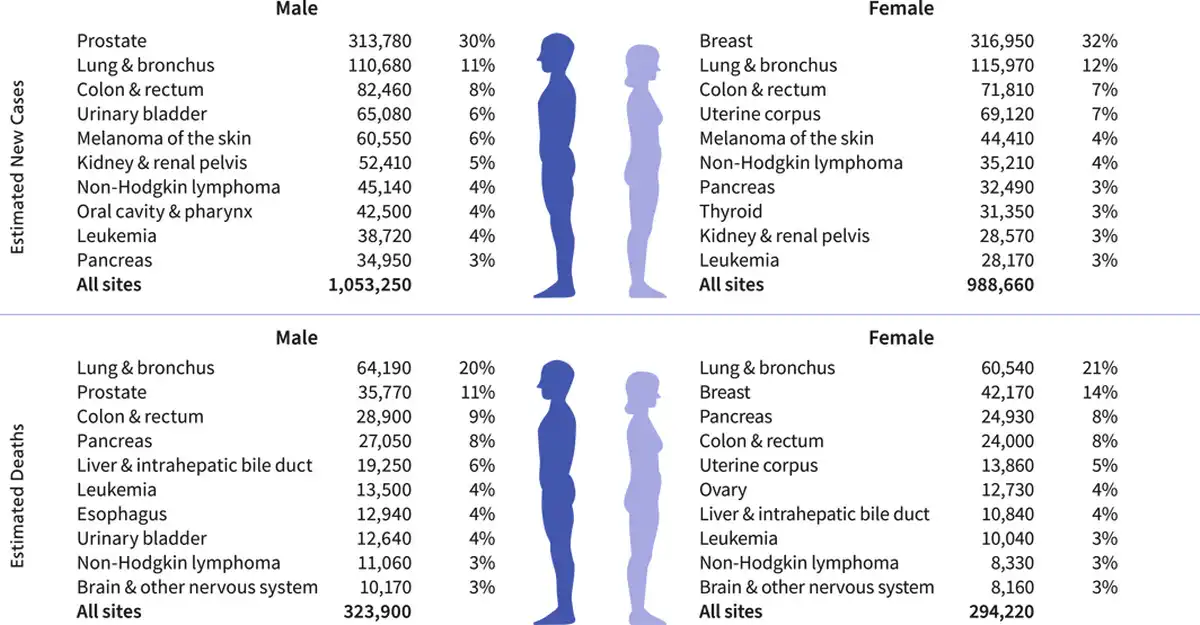
FIGURE 1
Leading sites of estimated new cancer cases and deaths by sex, United States, 2025. Estimates exclude US territories and are rounded to the nearest 10, and cases exclude basal cell and squamous cell skin cancers and in situ carcinoma except urinary bladder. Ranking is based on modeled projections and may differ from the most recent observed data.
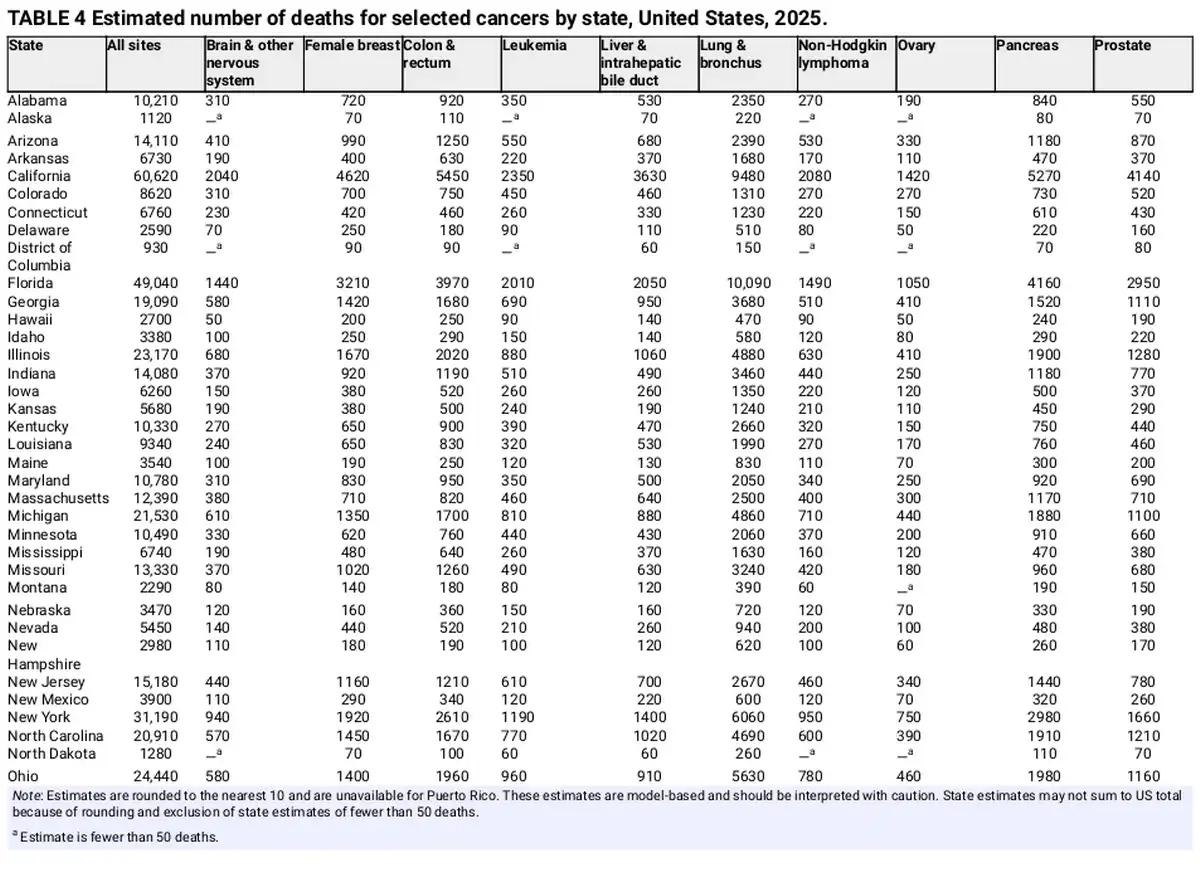
An estimated 618,120 people in the United States will die from cancer in 2025, corresponding to approximately 1700 deaths per day (Table 1). Despite steep declines in cigarette smoking prevalence, from 42% in 1965 to 12% in 2022, smoking continues to be the leading cause of preventable death in the United States, accounting for almost 500 cancer deaths each day in 2025, most from lung cancer. Approximately 85% (106,150) of lung cancer deaths in 2025 (124,730) will be caused by cigarette smoking directly, with an additional 3500 caused by second‐hand smoke and 15,100 caused by a combination of other combustible tobacco products (e.g., cigar or pipe smoking),, radon, occupational exposures, air pollution, and other environmental exposures. There is growing concern that e‐cigarettes and vaping may contribute to this burden in the future given their carcinogenic potential and wide popularity. Lung cancer causes nearly 2.5 times more deaths than second‐ranking CRC and third‐ranking pancreatic cancer. Table 4 provides the estimated number of deaths for these and other common cancers by state.
Trends in cancer incidence
Figure 2 illustrates long‐term trends in overall cancer incidence rates from 1975 through 2021 by sex. Observed rates in 2020 are shown separate from the trend line because of the large deficit in cancer diagnoses that resulted from pandemic‐related health care closures. The 2020 rate for cancer overall was 9% lower than the 2019 rate, with the largest reductions for asymptomatic (in situ and localized stage) disease because of both less screening and less incidental detection through provider visits and imaging., Analyses of 2021 incidence rates indicate a continuation of prepandemic trends without an obvious recovery of deficient cases from 2020 except for breast cancer.,
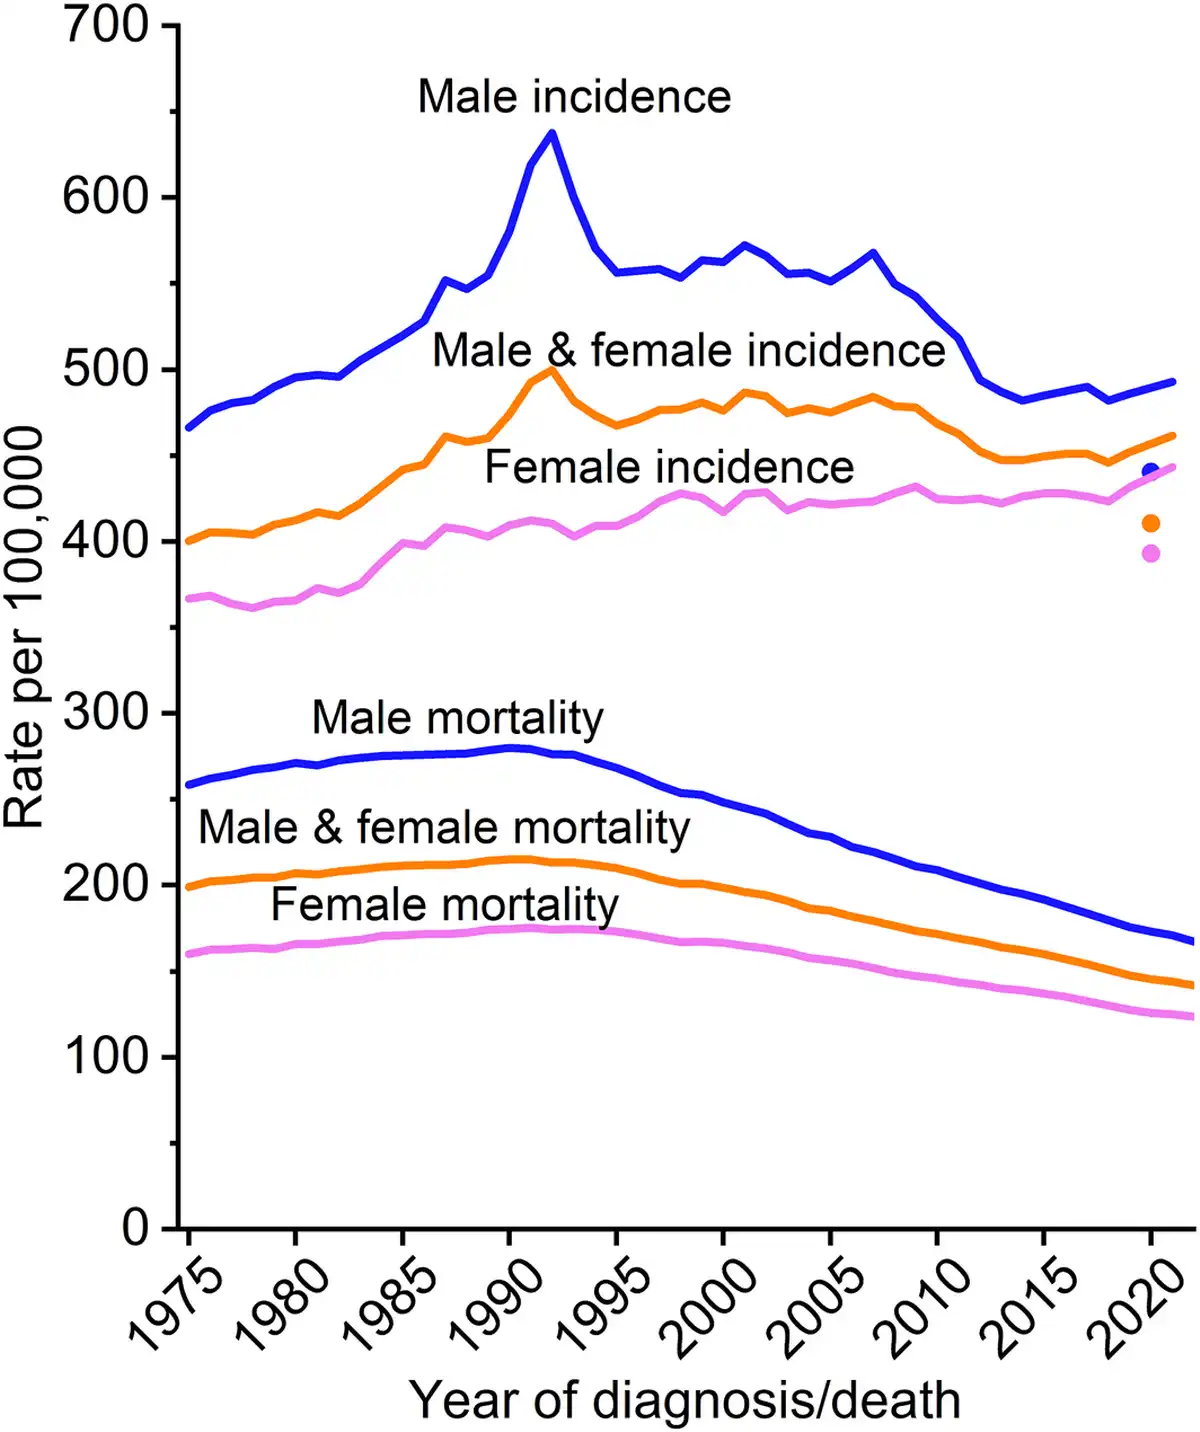
FIGURE 2
Trends in cancer incidence (1975–2021) and mortality (1975–2022) rates by sex, United States. Rates are age adjusted to the 2000 US standard population, and incidence rates are adjusted for delays in case reporting. Incidence data for 2020 are shown separate from trend lines.
Overall cancer incidence in men spiked during the early 1990s because of a surge in the detection of asymptomatic prostate cancer as a result of rapid, widespread uptake of prostate‐specific antigen (PSA) testing. The steep decline from 2007 through 2013 was similarly driven by prostate cancer, although rates leveled off thereafter and have remained stable through 2021 (Table 5). In contrast, cancer incidence in women has been much less erratic and gradually rose from a nadir of 361.2 per 100,000 in 1978 to 443.2 in 2021, an overall increase of 23%. Generally declining trends in men alongside increasing incidence in women has narrowed the male‐to‐female rate ratio from a peak of 1.6 in 1992 to 1.1 in 2021. (Even preceding the prostate/PSA peak in men, the rate ratio was 1.4.) Higher risk in men for most cancer types reflects greater exposure to carcinogenic environmental and lifestyle factors, such as smoking, as well as other factors, including height,, endogenous hormone exposure, and immune function and response.,
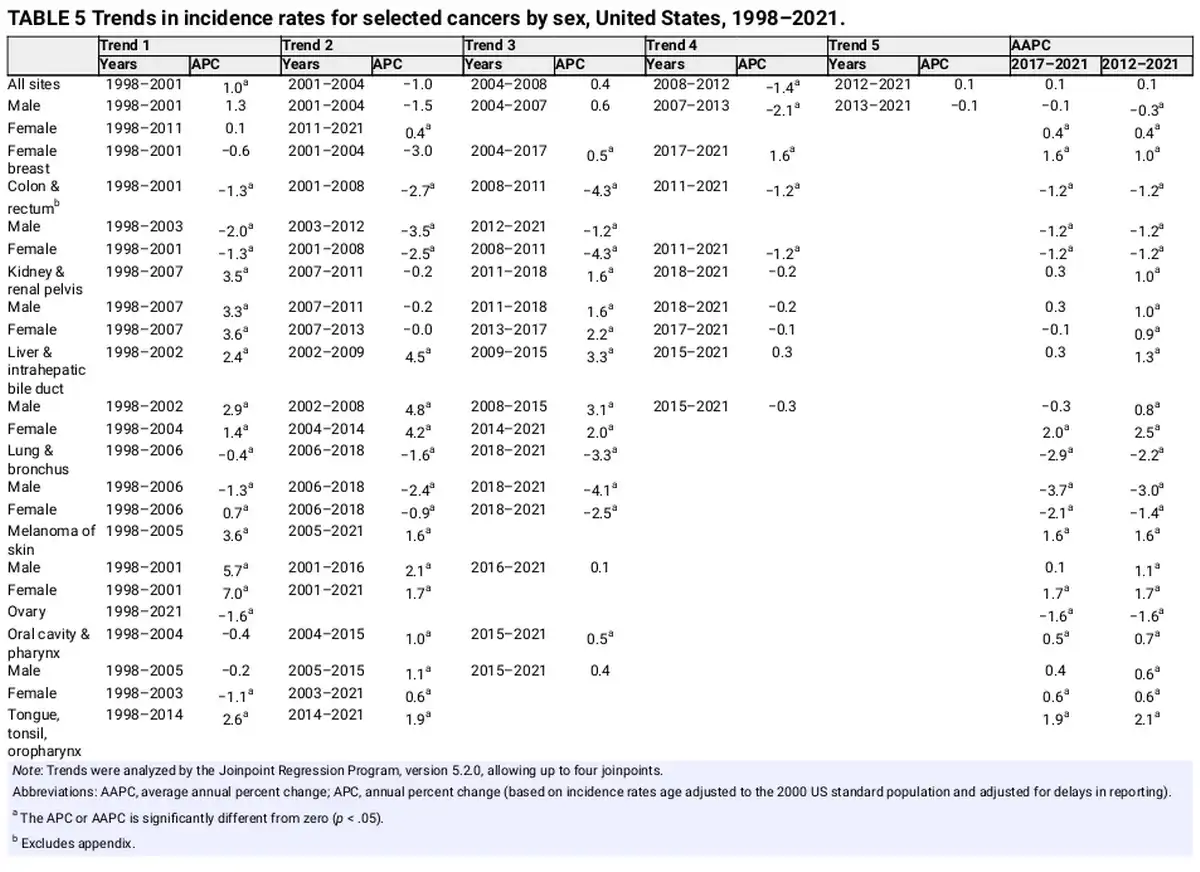
However, sex differences in cancer risk vary markedly by age because of variation in both cancer distribution and age‐specific temporal trends. For example, incidence rates in middle‐aged women (50–64 years) have already surpassed those of men and were statistically equivalent in 2021 (832.5 vs. 830.6 per 100,000, respectively) after being 21% lower than in men in 2007 (780.1 vs. 992.6 per 100,000; Figure 3). Among people younger than 50 years, for whom the burden in women is already greater largely because of breast cancer, the chasm is widening. The incidence rate in women younger than 50 years was 82% higher than in their male counterparts in 2021 (141.1 vs. 77.4 per 100,000), up from 51% higher in 2002. During this period, incidence declined slightly in young men, but rose in young women by nearly 20%, largely because of increasing trends for breast and thyroid cancers, which make up almost one half (46%) of all cancers in this age group. Although rates in men younger than 50 years are increasing for the four leading cancers (colorectal, testicular, kidney, and leukemia), these trends were offset by declines for other common cancers (e.g., melanoma, non‐Hodgkin lymphoma, and prostate). Notably, among those younger than 65 years, lung cancer incidence was higher in women than in men in 2021 for the first time (15.7 versus 15.4 per 100,000; p = .03). These patterns harken back to the pretobacco epidemic era, when the cancer burden was higher in women than in men, and may be a bellwether for the future cancer landscape.
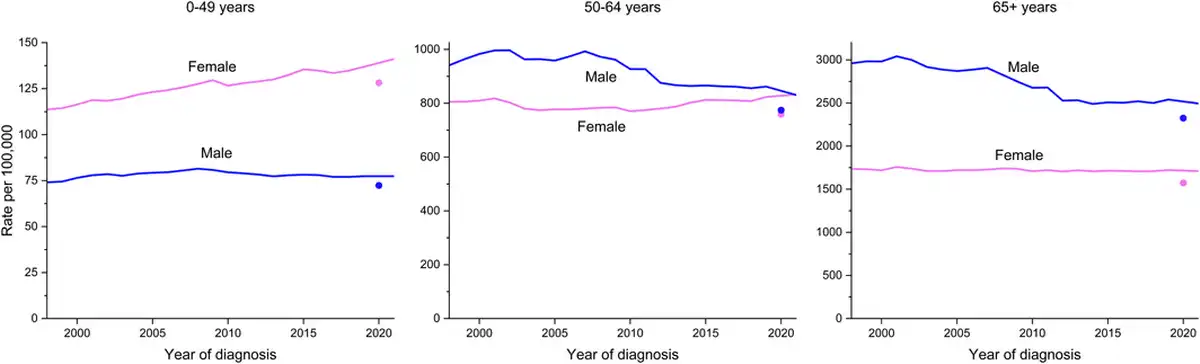
FIGURE 3
Trends in cancer incidence by age and sex, United States, 1998–2021. Rates are age adjusted to the 2000 US standard population and adjusted for delays in case reporting. Data for 2020 are shown separate from trend lines.
Figure 4 shows incidence rates by sex for all ages combined for the most common cancers. The incidence rate for prostate cancer dropped by almost 40% from 2007 to 2014 because of reductions in PSA testing and the diagnosis of localized tumors that coincided with recommendations against screening by the US Preventive Services Task Force (USPSTF) for men aged 75 years and older in 2008 and for all men (temporarily) in 2012., Since 2014, however, the prostate cancer incidence rate has risen by 3% per year, ranging from an increase of 2.4% per year for localized disease to more than 4.5% per year for advanced (regional or distant‐stage) disease diagnoses that began as early as 2011. A recent study estimated that more than one half of men in the United States living with metastatic prostate cancer were initially diagnosed with localized or regional‐stage disease.
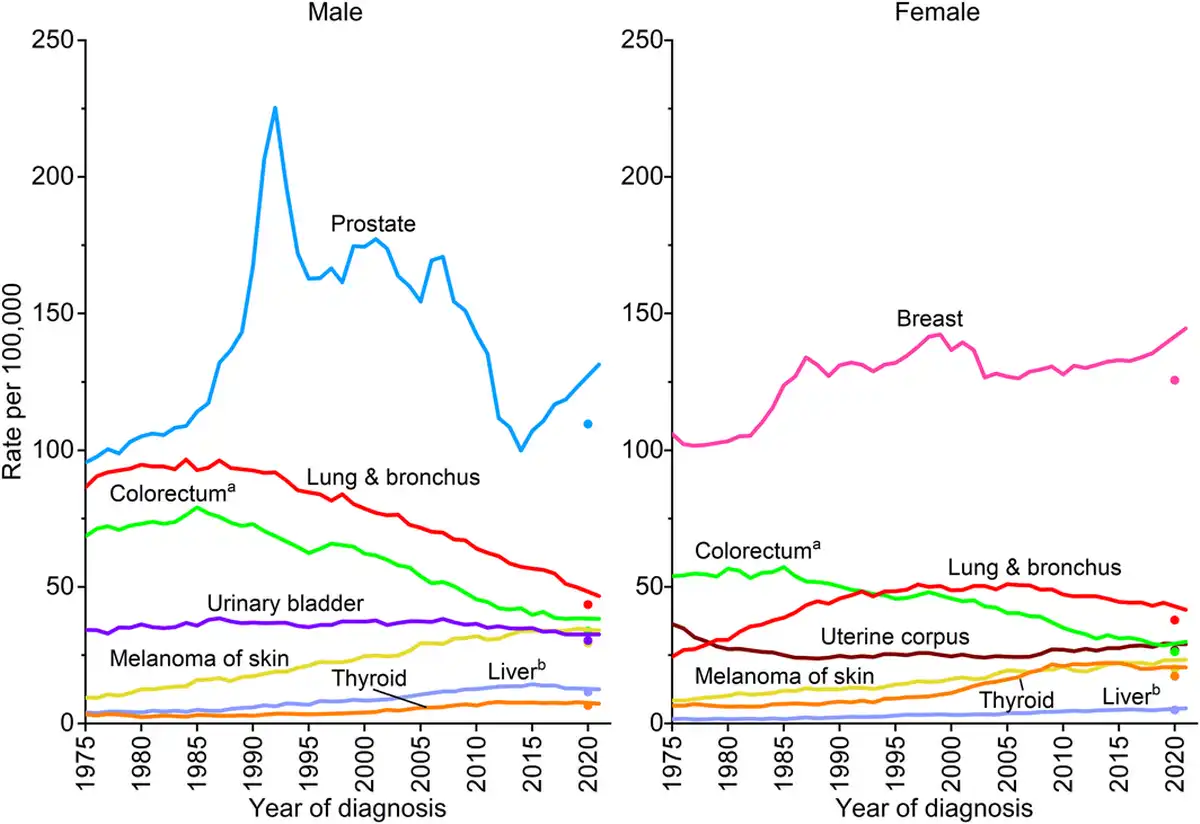
FIGURE 4
Trends in incidence rates for selected cancers by sex, United States, 1975 to 2021. Rates are age adjusted to the 2000 US standard population and adjusted for delays in reporting. Data for 2020 are shown separate from trend lines. aExcludes appendix. bIncludes intrahepatic bile duct.
Untethered PSA screening of the 1990s and 2000s was plagued by diagnosis and treatment of clinically insignificant prostate cancer while simultaneously credited with steep reductions in prostate cancer mortality., Fortunately, refined early detection strategies, genetic testing for disease aggressiveness, and more conservative treatment have emerged rapidly. A Swedish population‐based trial reported that the diagnosis of clinically insignificant tumors was reduced by more than one half when biopsy was limited to men with positive magnetic resonance imaging (MRI) results. Similarly, a recent meta‐analysis found that MRI‐integrated screening reduced the odds of biopsy by 72% and the diagnosis of clinically insignificant cancers by 66%. The inclusion of MRI and genomic testing is associated with increased active surveillance management, although uptake of these strategies is low and geographically uneven., In the United States, approximately 60% of men with low‐risk disease are managed with active surveillance, versus 9% with intermediate‐risk disease. PSA testing increased slightly after the USPSTF upgraded their recommendation to informed decision making in men aged 55–69 years in 2018,, , but it remains underused at only 37% in men aged 50 years and older overall and 34% among Black men, who tend to have more aggressive disease and thus greater benefit., , , A recent review supports screening Black men from ages 45–75 years at potentially more frequent intervals than other men depending on baseline PSA, consistent with long‐standing American Cancer Society recommendations.
Female breast cancer incidence rates have been slowly increasing since the mid‐2000s (Table 5), largely driven by diagnoses of localized‐stage and hormone receptor‐positive disease. In the past decade (2012–2021), the rate increased by 1% per year overall, with the steepest slope in women younger than 50 years (1.4% per year) and Hispanic (1.6% per year) or Asian American and Pacific Islander (AAPI, 2.6% per year) women. Although rising incidence is largely attributed to a decreasing fertility rate and increasing obesity prevalence, excess body weight is associated with a decreased risk of breast cancer in premenopausal women. Physical inactivity and alcohol consumption account for 7% and 16% of breast cancers, respectively, and may also contribute. Binge and heavy drinking is increasing in women younger than 50 years, especially among those with high education and income and without children. Many of these same risk factors, including increased adiposity and sedentary lifestyle and less and/or later childbearing, also likely contribute to the increase in uterine corpus cancer incidence of about 1% annually also since the mid‐2000s.
After decades of increase, thyroid cancer incidence rates have declined since 2014 by 2% per year (Table 5) because of changes in clinical practice designed to mitigate overdiagnosis, including recommendations against thyroid cancer screening by the USPSTF and for more restrictive criteria by professional societies for performing and interpreting biopsies., Data from autopsy studies indicate that the occurrence of clinically relevant tumors has remained stable since 1970 and is generally similar in males and females,, despite three‐fold higher incidence rates in females. Even among adolescents (aged 15–19 years), incidence rates are five times higher in girls than in boys (5 vs. 1 per 100,000), increased steeply through 2018, but show signs of leveling in more recent years.
Lung cancer incidence declined over the past decade (2012–2021) by 3% per year in men and 1.4% per year in women (Table 5). The downturn began later and remains slower in women than in men because women took up cigarette smoking in large numbers later and were also slower to quit, including upticks in smoking prevalence in some generations born after 1965., In contrast, CRC incidence patterns have long been similar by sex, with rates declining since 2011/2012 by 1.2% per year in both men and women. However, these declines are increasingly driven by adults aged 65 years and older because CRC is rising in people born after the 1950s, some of whom are now middle‐aged. From 2012 through 2021, incidence increased by 0.4% per year in those aged 50–64 years and by 2.4% per year in younger adults. Rising incidence in the United States and several other high‐income countries since the mid‐1990s remains unexplained but likely reflects changes in lifestyle exposures that began with generations born during the last one half of the 20th century. In response, the American Cancer Society recommended beginning CRC screening at age 45 years instead of 50 years in 2018, and the USPSTF followed suit in a draft statement in 2020 that was finalized in 2021. Although only 20% of people aged 45–49 years reported being up to date for CRC screening in 2021, we may already be seeing signs of prevalent disease detection in this newly eligible cohort. The CRC incidence rate jumped 17% in people aged 45–49 years from 2018 to 2021 (vs. 1.2% in the previous 3 years). Claims data on 10 million private health insurance beneficiaries aged 45–49 years showed a three‐fold increase in CRC screening from January 2021 to December 2022, when it reached the same level as that in people aged 50–75 years.
After a long history of increase, non‐Hodgkin lymphoma incidence decreased by about 1% per year in both men and women from 2017 through 2021, and liver cancer and melanoma have stabilized in men, although both cancers continue to increase in women by about 2% per year (Table 5). In adults younger than 50 years, melanoma has stabilized in women, but liver cancer continues to increase by about 2% per year; whereas rates for both cancers have decreased in men by about 1% and 2.5% per year, respectively. The decline in urinary bladder cancer since the mid‐2000s accelerated from <1% per year to 1.4% per year during 2015 through 2021 overall. Incidence rates appear to have finally stabilized for kidney cancer after increasing since the 1970s, but they continue to increase by about 1% per year for cancers of the pancreas and oral cavity and pharynx. Increasing trends for oral cavity are mostly confined to cancers of the tongue, tonsil, and oropharynx (increasing by 1.9% per year), which are usually associated with human papillomavirus (HPV).
Cervical cancer incidence has decreased by more than one half since the mid‐1970s because of the widespread uptake of vaccination, screening, and treatment of precursor lesions. Although incidence overall has stabilized in the past decade, trends vary widely by age. For example, rates in women aged 30–44 years have increased by 11%, from 12.7 in 2013 to 14.1 in 2021 after decades of decline, consistent with persistent reports of underscreening among young women in recent studies., In contrast, rates in women aged 20–24 years who were first to be exposed to the HPV vaccine, have plummeted by 69% during this time. A recent study based on data from the New Mexico HPV Pap Registry found that the incidence of cervical intraepithelial neoplasia grades 2 and 3 had dropped from 153 and 41 cases, respectively, in 2007 to zero in 2019 among adolescents 15‐19 years. Vaccine efficacy against other HPV‐related cancers is also emerging, including a 70% reduction in high‐grade anal squamous intraepithelial lesions and cancer among women who were vaccinated before age 17 years. Surprisingly large herd immunity and single‐dose efficacy, spurred the UK Health Security Agency to move to single‐dose vaccination in 2023. In the United States, where the annual number of HPV‐associated cancers is estimated at greater than 37,000, 77% of adolescents had received at least one vaccine dose in 2023, and 61% were up to date (2 doses if initiated before 15th birthday, 3 doses otherwise), down from 63% in 2022.
Cancer survival
The 5‐year relative survival rate for all cancers combined has increased from 49% for diagnoses during the mid‐1970s to 69% during 2014–2020 (Table 6),, with the highest contemporary survival for cancers of the thyroid (98%), prostate (97%), testis (95%), and melanoma (94%). Earlier diagnosis through screening and incidental detection through imaging has contributed to gains in survival for some cancers (e.g., breast, prostate, thyroid, and kidney) both by increasing the likelihood of successful treatment and through lead‐time bias and the detection of indolent cancers (e.g., overdiagnosis)., , Liver cancer has the largest increase in survival (in relative terms), from 3% to 22%, but remains among the least favorable prognosis, along with cancers of the lung (27%), esophagus (22%), and pancreas (13%).
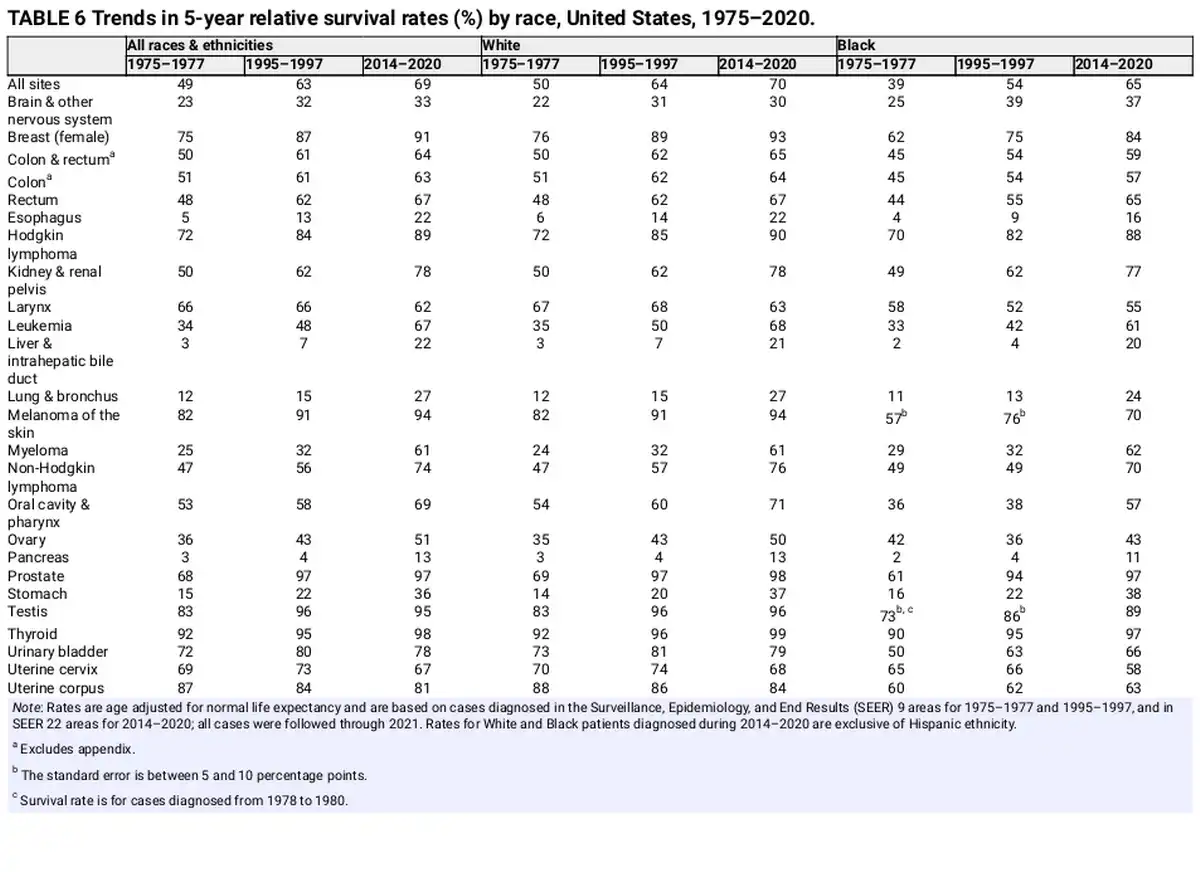
Gains in survival have been especially rapid for hematopoietic and lymphoid malignancies because of improvements in treatment protocols, including the development of targeted therapies and immunotherapies, likely in part because of a history of high research funding. The 5‐year relative survival rate for chronic myeloid leukemia has more than tripled, from 22% in the mid‐1970s to 70% for those diagnosed during 2014–2020, with tyrosine‐kinase inhibitors providing most patients with near‐normal life expectancy. Although three generations of tyrosine‐kinase inhibitors have been approved, drug resistance and risk of progression to acute disease occurs in 5% to 10% of patients with chronic myeloid leukemia and is an active area of research. Metabolic intervention is an emerging therapeutic strategy for resistant chronic myeloid leukemia as well as acute myeloid leukemia, for which 5‐year relative survival remains just 32%.
A cascade of new regimens of immunotherapy and targeted therapy has also revolutionized the management of cancer, particularly melanoma, over the past 2 decades, especially in the treatment of metastatic disease. Consequently, 5‐year relative survival for distant‐stage melanoma has doubled, from 18% for patients diagnosed in 2009 to 35% in 2014–2020 (Figure 5). Immunotherapy has also shown efficacy for nonsmall and small cell lung cancer. Advances in treatment for lung cancer have been almost exclusively confined to nonsmall cell disease, for which 3‐year relative survival has increased from 26% in 2004 to 43% in 2018, compared with an increase from 9% to 12% for small cell lung cancer. Progress not only reflects improved disease management, , but also advances in staging and earlier detection.,
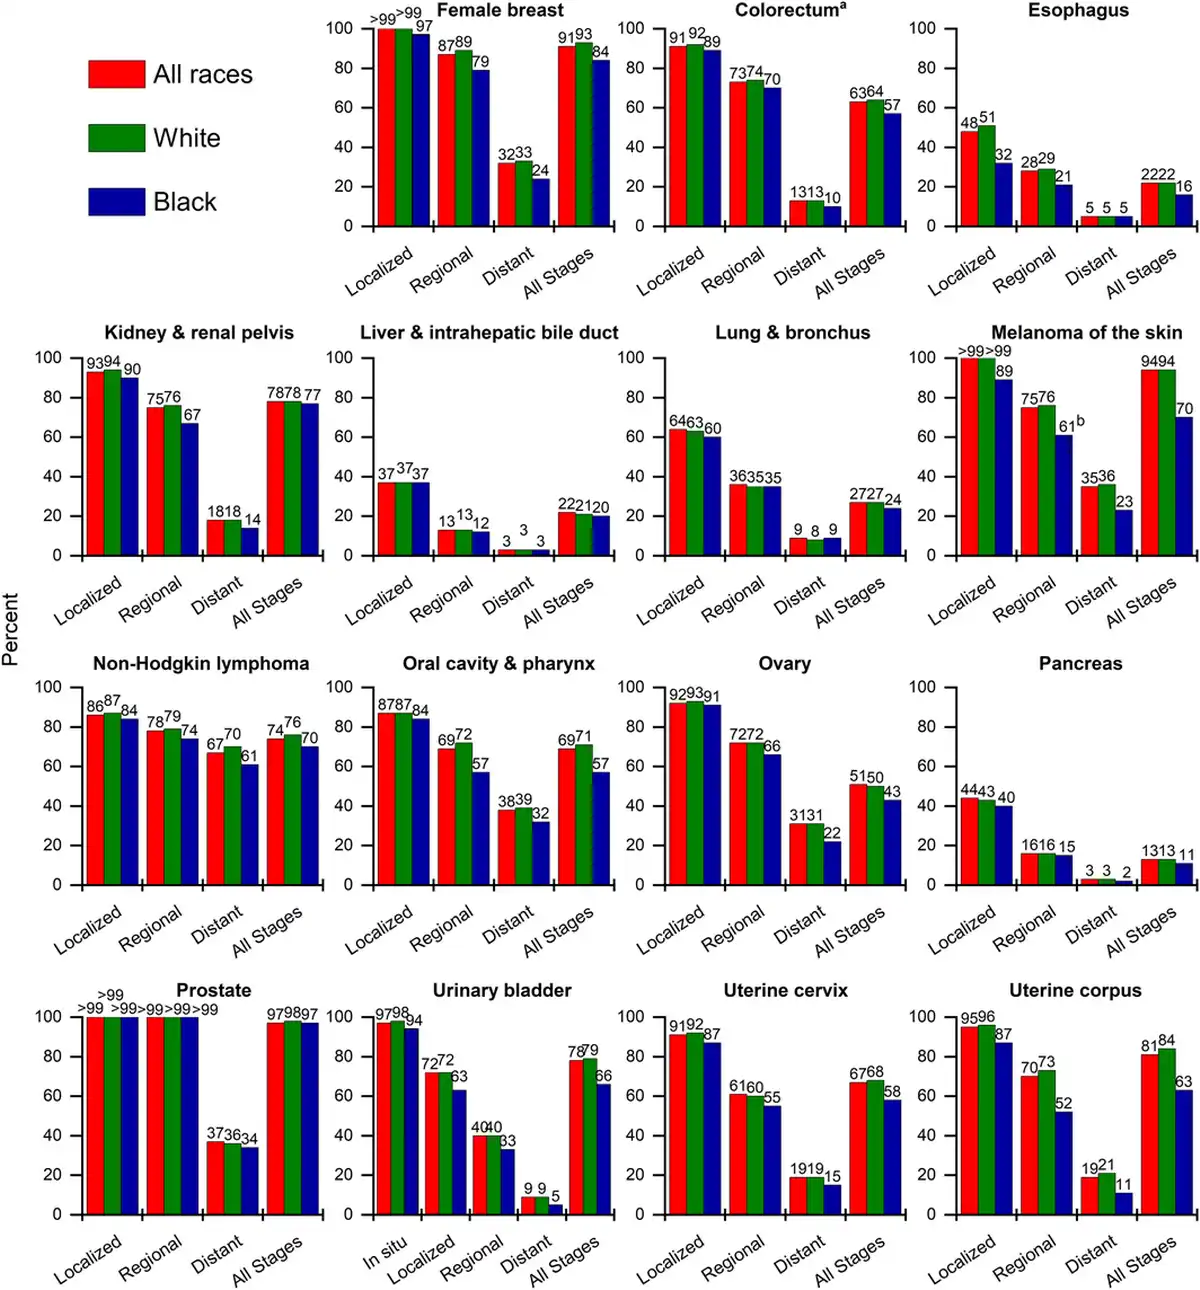
FIGURE 5
Five‐year relative survival rates for selected cancers by race and stage at diagnosis, United States, 2014 to 2020. All patients were followed through 2021. White and Black race are exclusive of Hispanic ethnicity. aExcludes appendix. bStandard error is between 5 and 10 percentage points.
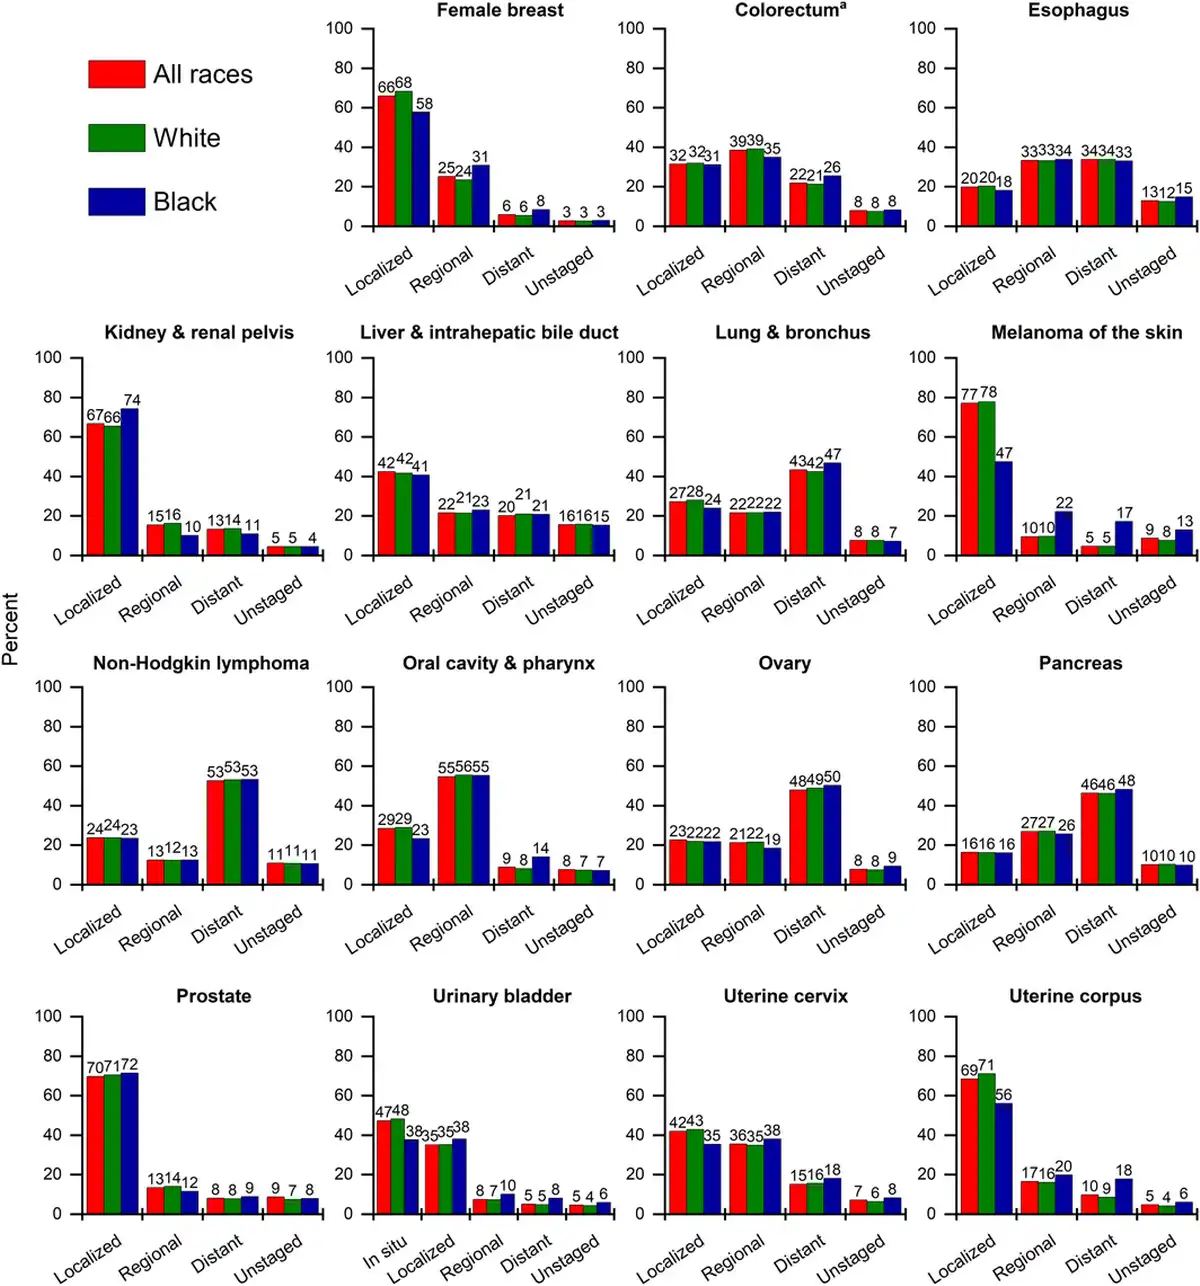
FIGURE 6
Stage distribution for selected cancers by race, United States, 2017 to 2021. White and Black race are exclusive of Hispanic ethnicity. Stage categories may not sum to 100% because of rounding. aExcludes appendix.
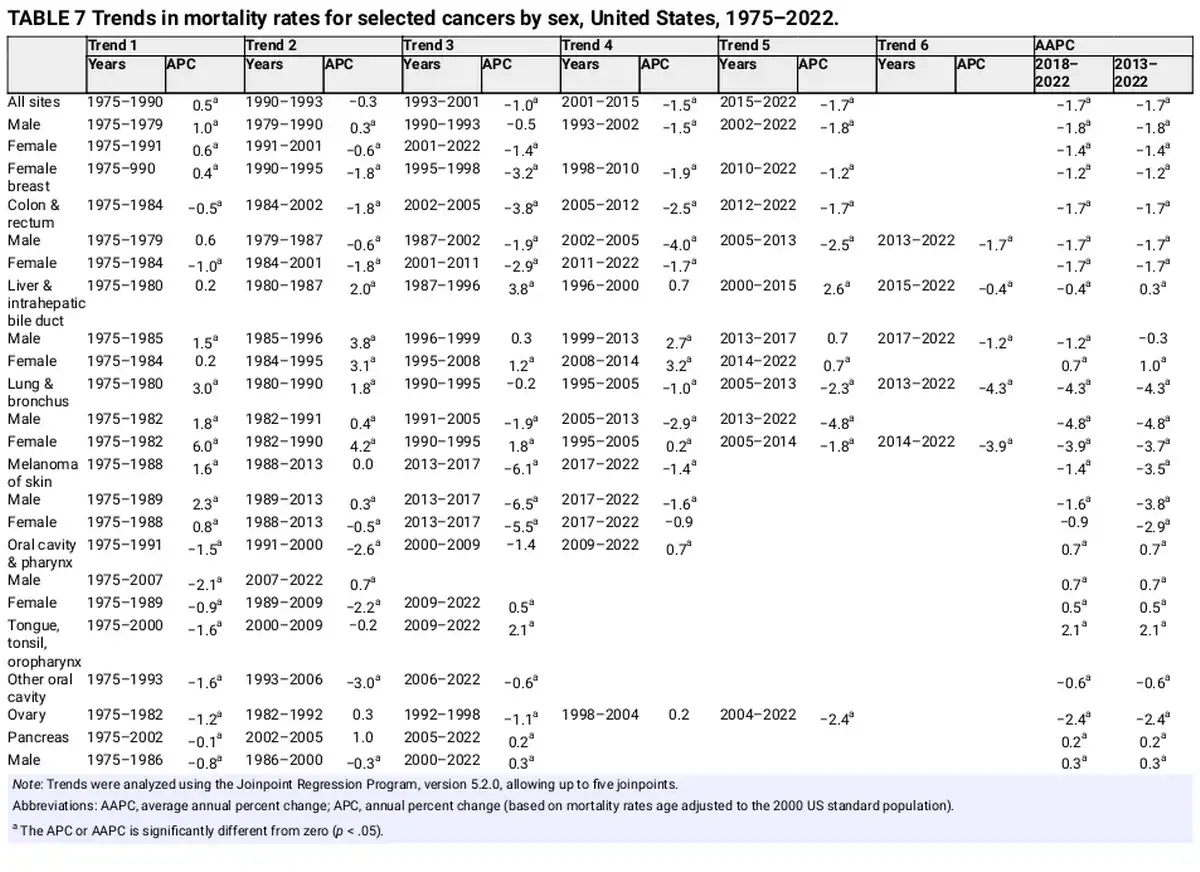
The only cancer for which survival has decreased over the past 4 decades is uterine corpus cancer (Table 6), which is the fourth most common cancer in women and the fifth most common cause of cancer death. Uterine corpus cancer is one of only a handful of cancers with increasing mortality (Table 7) and also has among the largest Black–White mortality disparity (Table 8), with a 5‐year relative survival rate of just 63% among Black women versus 84% among White women (Figure 5). Aside from modest advances in treatment and slightly improved survival for women with regional stage disease, progress has lagged behind other common cancers, at least in part reflecting persistent underfunding. The NCI allocated almost six times more research dollars in 2019 for cervical cancer ($86 million) than for uterine corpus cancer ($14.9 million), which killed three times more women in 2022 (4051 vs. 12,763, respectively).
Cervical cancer survival rates have also stagnated, although this partly reflects an increased proportion of adenocarcinoma, which has less favorable survival, as a result of high cytology screening, which disproportionately detects and removes squamous cell carcinoma., Cervical cancer has the highest screening prevalence of any screen‐detectable cancer at 75% among women aged 25–65 years in 2021.
Trends in cancer mortality
Mortality rates are a better indicator of progress against cancer than incidence or survival because they are less affected by detection biases, such as those that can occur for screen‐detected cancers. Cancer mortality rose during most of the 20th century (Figure 7), largely because of a rapid increase in lung cancer among men as a consequence of the tobacco epidemic. However, reductions in smoking as well as improvements in disease management and the uptake of screening have resulted in a 34% overall drop in the cancer death rate from 1991 through 2022, translating to nearly 4.5 million fewer cancer deaths (3,021,200 in men and 1,437,500 in women) than if mortality had remained at its peak (Figure 8). The number of averted deaths is twice as large for men than for women because the death rate in men peaked higher and declined faster (Figure 7).
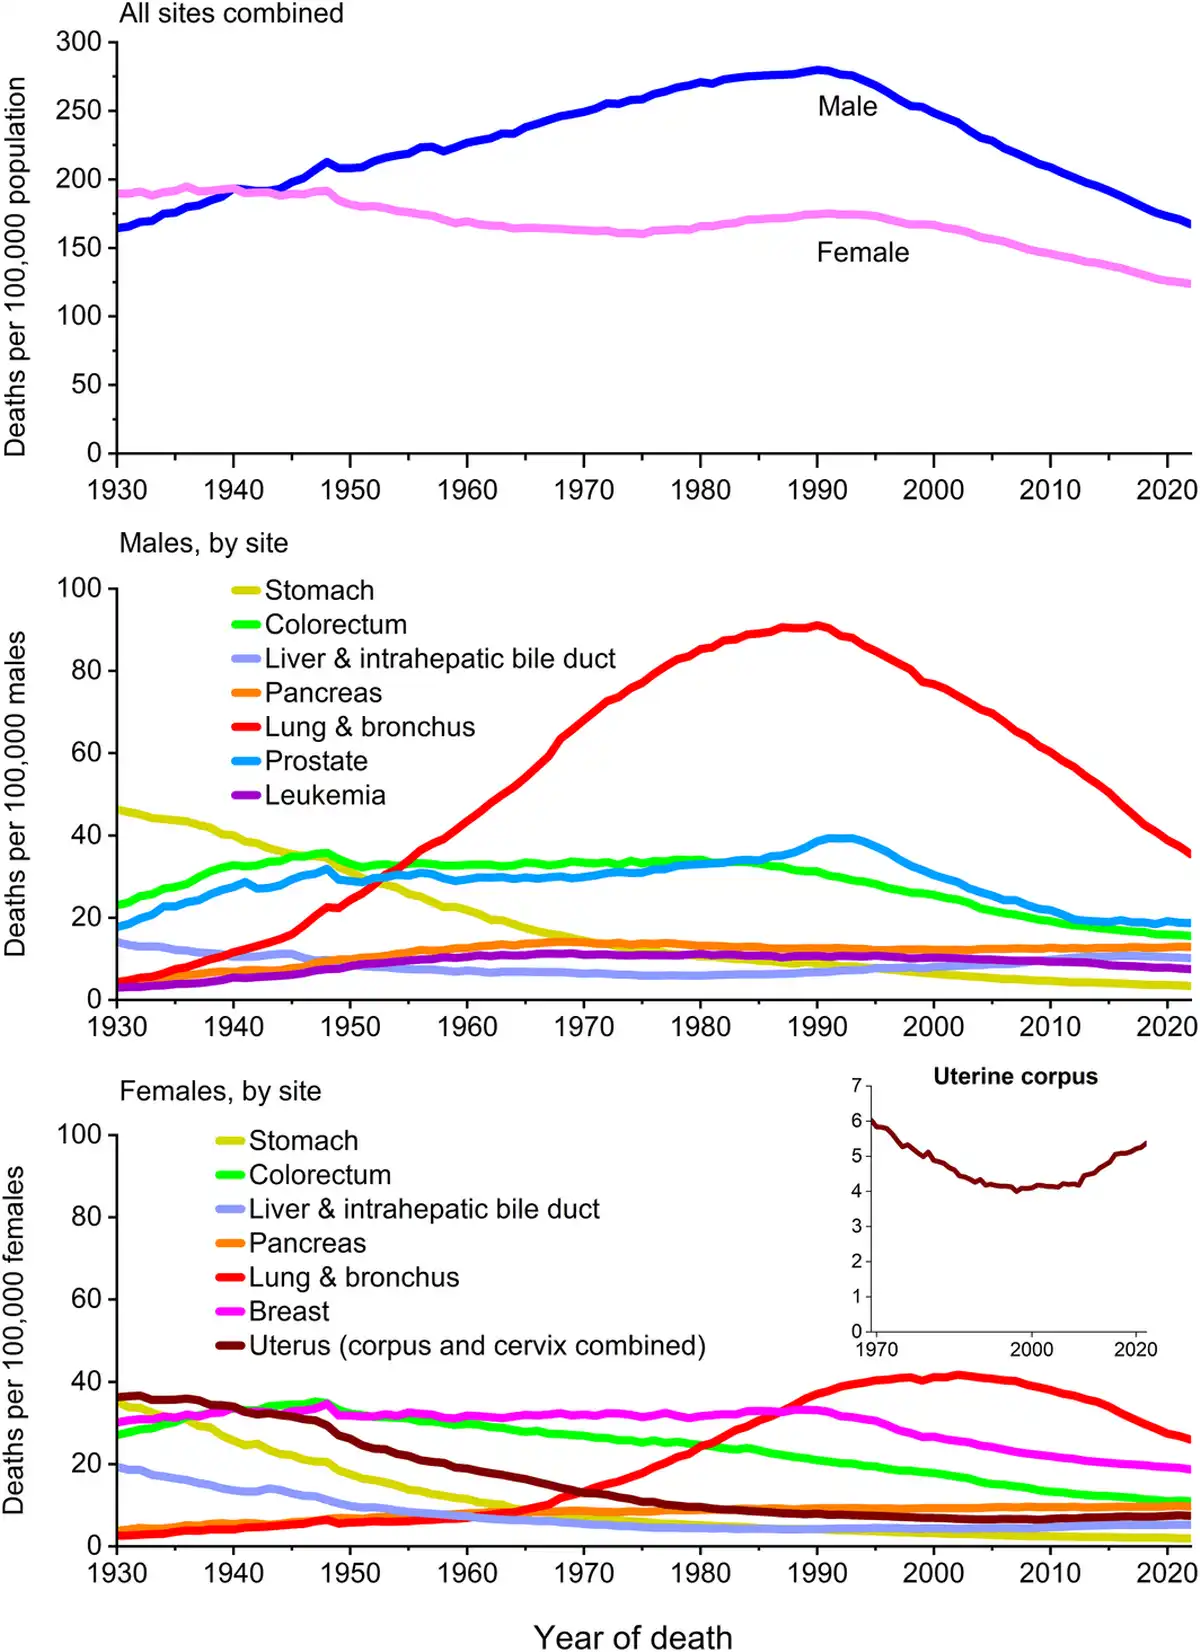
FIGURE 7
Trends in cancer mortality rates by sex overall and for selected cancers by sex, United States, 1930 to 2022. Rates are age adjusted to the 2000 US standard population. Numerator data for cancers of the lung and bronchus, colon and rectum, liver, and uterus differ from the contemporary time period because of improvements in International Classification of Diseases coding over time. For example, rates for lung and bronchus include pleura, trachea, mediastinum, and other respiratory organs.
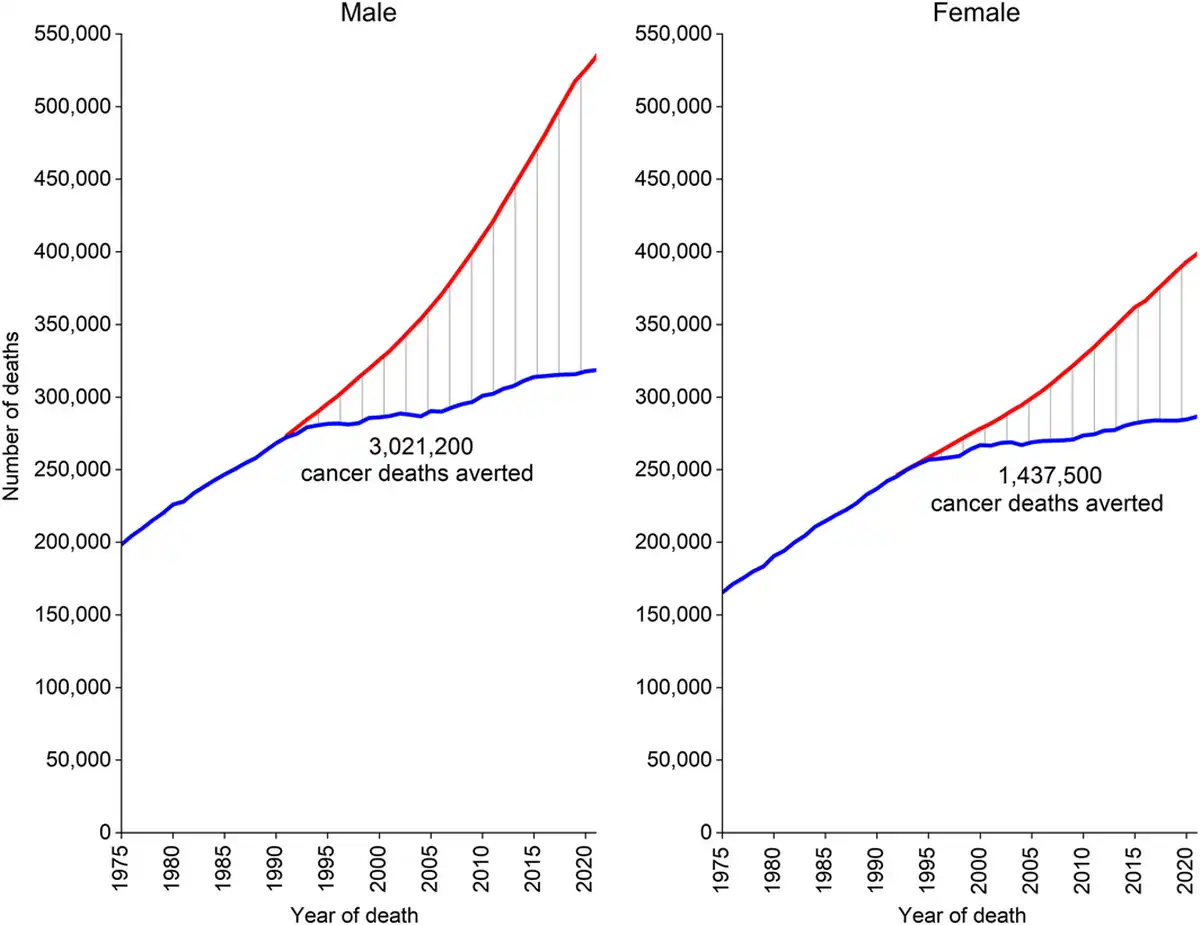
FIGURE 8
Total number of cancer deaths averted during 1991 to 2022 in men and 1992 to 2022 in women, United States. The blue line represents the actual number of cancer deaths recorded in each year; the red line represents the number of cancer deaths that would have been expected if cancer death rates had remained at their peak.
Despite decades of decline, lung cancer continues to dwarf other cancers in the number of deaths, causing more deaths in 2022 than colorectal, breast, and prostate cancers combined (Figure 7). The lung cancer death rate has dropped by 61% from the peak in 1990 among men and by 38% from the peak in 2002 among women, consistent with the later downturn in incidence. Since 2013/2014, the pace of decline accelerated from 3% to almost 5% per year in men and from 2% to 4% per year in women (Table 7) because of earlier detection and treatment advances that have extended survival. A recent study found that mortality declines accelerated for both smoking‐related and smoking‐unrelated lung cancer but are slower for the latter because they are not influenced by reductions in incidence. Low‐dose computed tomography screening reduces the odds of lung cancer mortality by 16%–24% among high‐risk individuals, and is associated with a substantial survival advantage. The potential for reducing the mortality burden is further increased by updated American Cancer Society guidelines that expanded screening eligibility to an additional 5 million people by eliminating cessation time among former smokers because of protracted excess risk. Nevertheless, lung cancer screening prevalence remains low, ranging from one of 10 eligible adults in most Western states to three of 10 in the Northeast, and most cases (43%) are diagnosed at a distant stage (Figure 6).
Sustained reductions in mortality for CRC, the second‐most common cause of cancer death in men and women combined, are the result of changing patterns in risk factors, such as declines in smoking, screening uptake, and improved treatment. The CRC death rate has dropped by 55% among males since 1980 and by 60% among females since 1969. (The rate in women began declining before 1969, but those data are not exclusive of cancer in the small intestine.) Contemporary trends in CRC are remarkably similar by sex, with rates decreasing during the most recent decade (2013–2022) by 1.7% per year in both men and women (Table 7).
In contrast, death rates for pancreatic cancer, the third leading cause of cancer death, have gradually increased since cancer mortality reporting began, from about five per 100,000 in both men and women in the 1930s to 13 per 100,000 men and 10 per 100,000 women today (Figure 7). This trend reflects improved classification on death certificates as well as increased incidence since the mid‐1990s, in part because of the obesity epidemic. In contrast to most cancers, however, therapeutic advances are also lacking despite substantial effort that includes national legislation to focus attention on pancreatic cancer (House Resolution 733: Recalcitrant Cancer Research Act of 2012). Since 2000, there have been 481 phase 1 clinical trials and 85 phase 3 trials conducted on metastatic pancreatic cancer, along with five new drug approvals; yet median survival for the disease remains less than 1 year. The appearance of a three‐fold increase in the 5‐year relative survival rate, from 4% in the mid‐1990s to 13% in 2014–2020, is partly an artifact of a burgeoning number of incidentally detected, well differentiated neuroendocrine tumors., For the nine in 10 patients diagnosed with pancreatic adenocarcinoma, 5‐year survival remains just 8%.
Female breast cancer mortality peaked in 1989 and has since decreased by 44% through 2022, translating to the avoidance of more than 517,900 deaths. A recent study attributed three fourths of this progress to treatment advances and the remainder to earlier diagnosis through screening. Declines in breast cancer mortality have slowed from 2% per year during the 2000s to 1% per year since 2010 (Table 7), reflecting relatively stable mammography prevalence over the past 2 decades and perhaps increased incidence. Reductions in prostate cancer mortality have similarly decelerated from 3.6% per year during the late 1990s and 2000s to 0.5% per year from 2012 through 2022 (Table 7, Figure 7). The prostate cancer death rate in 2022 was 52% lower than the peak in 1993 because of earlier detection through PSA screening and advances in treatment., Steep declines in melanoma mortality during 2013–2017 (6.1% per year) because of breakthrough treatments noted earlier have slowed to 1.4% during 2017–2022 (Table 7). Declining mortality trends for melanoma, leukemia, and cancers of the kidney, prostate, and breast, despite increasing or stable (leukemia) incidence, underscore the impact of advances in treatment, but perhaps also signal some overdiagnosis.
The decades‐long increase in liver cancer mortality has finally reversed in men, as rates decreased by 1.2% per year from 2018–2022, but continued in women with an increase of 0.7% per year during this time period. Mortality rates also continue to rise for uterine corpus cancer by 1.5% per year from 2013 through 2022 and for HPV‐associated oral cancers (tongue, tonsil, and oropharynx) by 2% per year (Table 7).
Recorded number of deaths in 2022
In 2022, a total of 3,279,857 deaths were recorded in the United States: 184,374 fewer than in 2021 (Table 9). The large drop is because the number of COVID‐19 deaths fell by more than one half, from 12% of total deaths in 2021 (416,893) to 6% in 2022 (186,552). This large shift altered the proportion of other deaths as well. For example, the percentage of deaths from cancer increased from 17% in 2021 to 19% in 2022; however, in the absence of COVID‐19 deaths, cancer accounted for 20% of deaths in both years. The age‐adjusted cancer death rate decreased by 1.5% from 2021 to 2022 despite 3158 more cancer deaths in 2022 because of the aging and growth of the population.
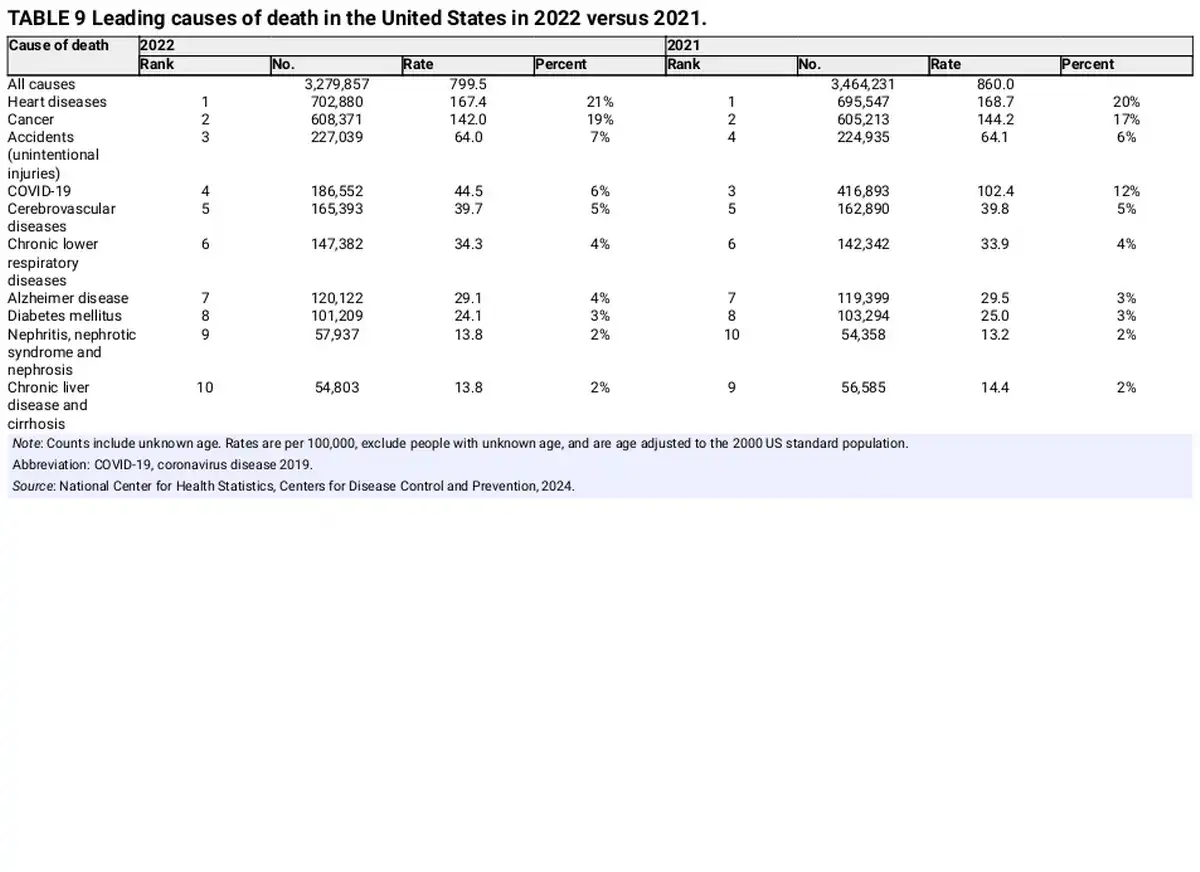
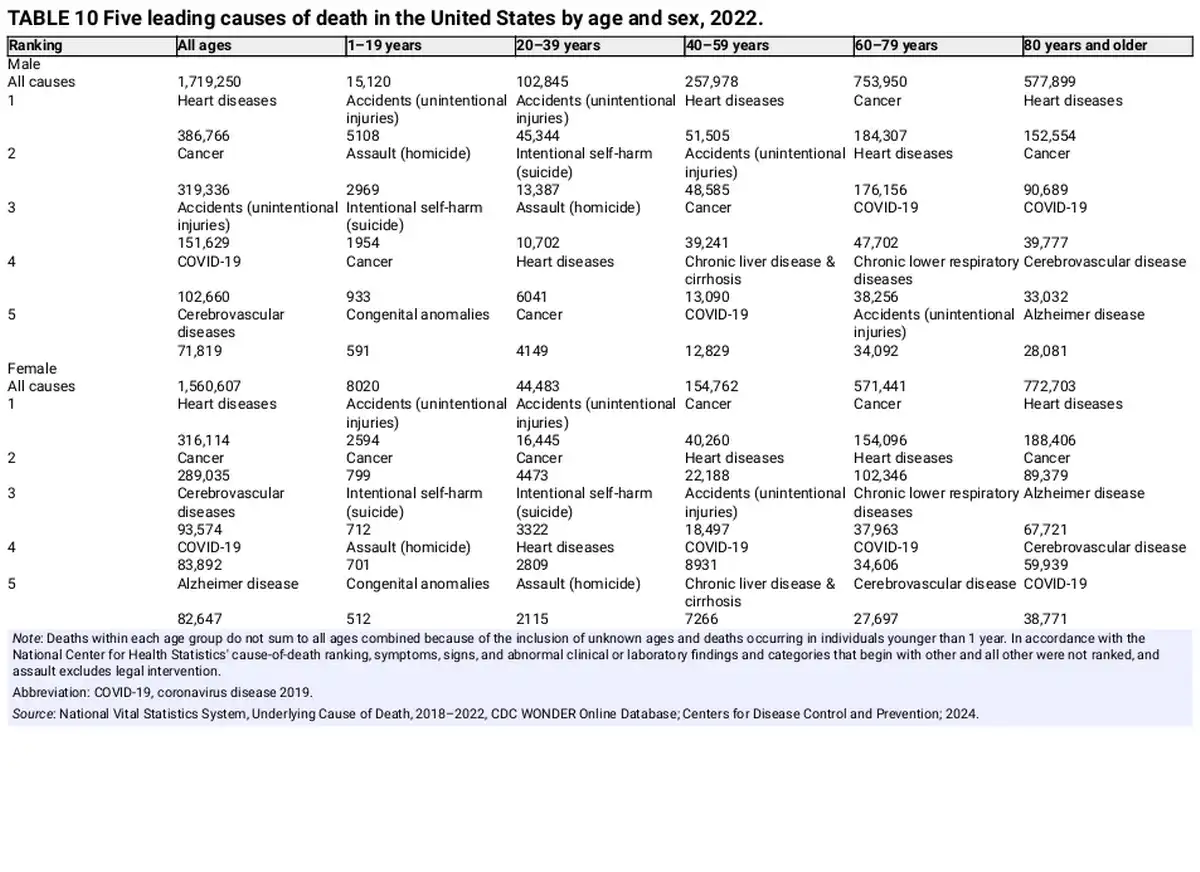
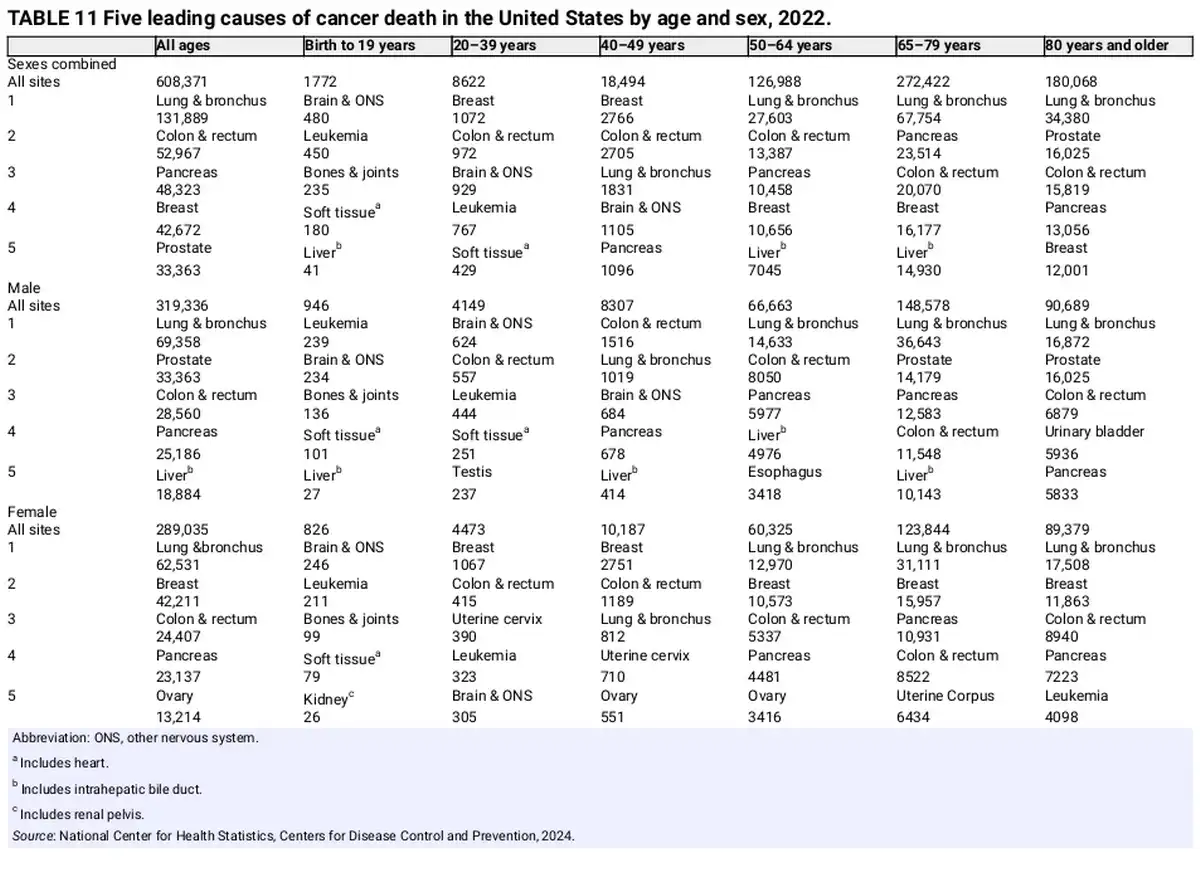
Although cancer remained the second leading cause of death after heart diseases in 2022 overall, it is the leading cause of death among men aged 60–79 years and women aged 40–79 years (Table 10). Notably, suicide was the second leading cause of death in young adult men (aged 20–39 years). Table 11 presents the number of deaths in 2022 for the five leading cancer types by age and sex. Brain and other nervous system (hereafter brain) tumors are the leading cause of cancer death among children and adolescents younger than 20 years (480 deaths), followed closely by leukemia (450 deaths). Brain is also the leading cause of cancer death in men aged 20–39 years, causing twice as many deaths as in women in this age group (624 vs. 305). Breast cancer is the leading cause of cancer death among women younger than 50 years, and lung cancer leads among both men and women aged 50 years and older.
Cancer disparities by race and ethnicity
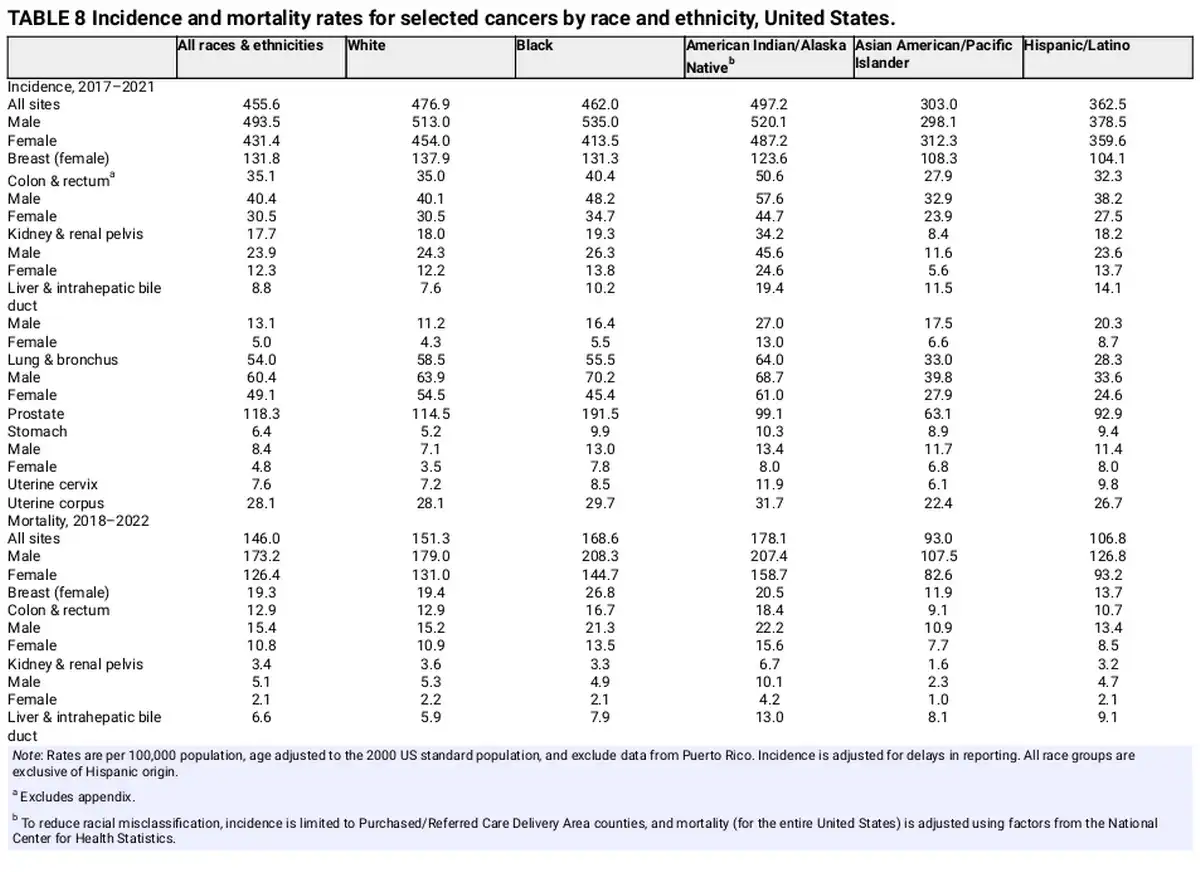
This section highlights the most striking cancer disparities among the five broadly defined racial and ethnic groups shown in Table 8. Although race and ethnicity are social constructs that aggregate heterogeneous population groups, they are useful for examining the influence of discrimination and inequality in health disparities. Cancer incidence and mortality are highest among AIAN people overall and in women, whereas Black men have the highest sex‐specific rates (Table 8). The incidence rate in Black men during 2017–2021 was about 80% higher than in AAPI men (535 vs. 298 per 100,000), who have the lowest rate of any sex‐race group. AAPI people are the only group for which the incidence in men is lower than in women.
AIAN people have the highest cancer mortality of any group for cancers of the colorectum, kidney, liver, lung, stomach, and cervix. Black men have the highest prostate cancer mortality, from two‐fold to four‐fold that in any other group, whereas Black women have the highest breast and uterine corpus cancer mortality, with the latter from two‐fold to three‐fold that of all other women. Although Hispanic and AAPI people have relatively low risk for most common cancers, their rates of liver cancer mortality are approximately 40%–50% higher than in White people, and their stomach cancer mortality is two‐fold higher. Aggregated data for broad racial and ethnic groups mask substantial heterogeneity. For example, combined AAPI data mask even larger disparities among Pacific Islander people, who have three‐fold higher stomach cancer mortality and from two and one half–fold to three‐fold higher rates of uterine corpus and cervical cancer mortality compared with White women.
Disparities in cancer occurrence and outcomes are often the result of socioeconomic deprivation as a consequence of structural racism, which limits opportunities for education and other mechanisms of upward mobility. For example, the historical practice of mortgage lending discrimination known as redlining is associated with later stage cancer diagnosis, lower likelihood of receiving recommended treatment, and higher cancer mortality., , , , Inequalities in wealth lead to differences in the prevalence of risk factor exposures as well as access to high‐quality cancer prevention, early detection, and treatment., Even beyond higher prevalence of common risk factors like smoking and obesity, exposure to carcinogenic air emissions is up to 50% higher among people experiencing poverty, regardless of race or ethnicity. In 2022, 25% of AIAN people lived below the federal poverty level ($27,750 for a family of four), as well as 17% of Black and Hispanic people, compared with 9% of White and Asian people. Persistent poverty ranks among the leading causes of death alongside smoking and is consistently associated with higher cancer incidence, later stage diagnosis, and worse outcomes., , The effects of poverty are both compounded by and independent of racial status. A recent study found that living in a disadvantaged neighborhood increased the likelihood of aggressive prostate cancer by 30% among Black men but had no impact on risk in White men, suggesting the contribution of race‐specific factors, such as minority stress.
Cancer survival after diagnosis is lower among Black people than among White people for almost every cancer type shown in Figure 5, even after controlling for stage at diagnosis (Figure 6) and socioeconomic status. A higher likelihood of more aggressive disease (e.g., triple‐negative breast cancer, nonendometrioid uterine corpus cancer) explains a small portion of this gap, but the largest contributor is less access to high‐quality care across the cancer continuum from prevention to diagnosis and treatment. Black women are one half as likely as White women to receive guideline‐concordant diagnostic procedures for the workup of uterine corpus cancer, less likely to receive a provider referral for mammography, and less likely to receive timely follow‐up after an abnormal mammogram. These inequalities directly translate to later stage disease, as only 56% of uterine corpus cancers and 58% of breast cancers are diagnosed at a localized stage in Black women versus 71% and 68%, respectively, in White women (Figure 6). A recent study estimated that CRC mortality rates in Black people would be reduced by 19%, eliminating two thirds of the Black–White disparity, merely by ensuring the same quality screening as White people. Asian, Black, and Hispanic people are less likely to receive both a physician recommendation for cancer screening and recommended germline genetic testing necessary for receipt of game‐changing targeted therapies. The economic burden of racial and ethnic health inequalities was estimated at $421–$451 billion in 2018 and will surely rise in the wake of the COVID‐19 pandemic because of a slower rebound in screening and other routine care among people of color.
Geographic variation in cancer occurrence
Tables 12 and 13 show the 5‐year average annual incidence and mortality rates for selected cancers by state. Geographic variation reflects population demographic characteristics and differences in the prevalence of cancer risk factors, early detection practices, and access to care, including state and local public health policies. For example, states have a large influence on the health of their residents by controlling accessibility and affordability of health insurance through the Marketplace and Medicaid., Cancer death rates range from <150 per 100,000 people in Utah, Hawaii, and New York to >210 per 100,000 people in West Virginia, Kentucky, and Mississippi (Table 13). This gap is largely driven by lung cancer and mirrors patterns in smoking prevalence, which have remained consistent geographically despite temporal declines. In 2022, the highest smoking prevalence was in West Virginia (22%); Arkansas (20%); Tennessee (19%); and Mississippi, Missouri, Ohio, and Kentucky (18%) compared with 7% in Utah and 10% in California.
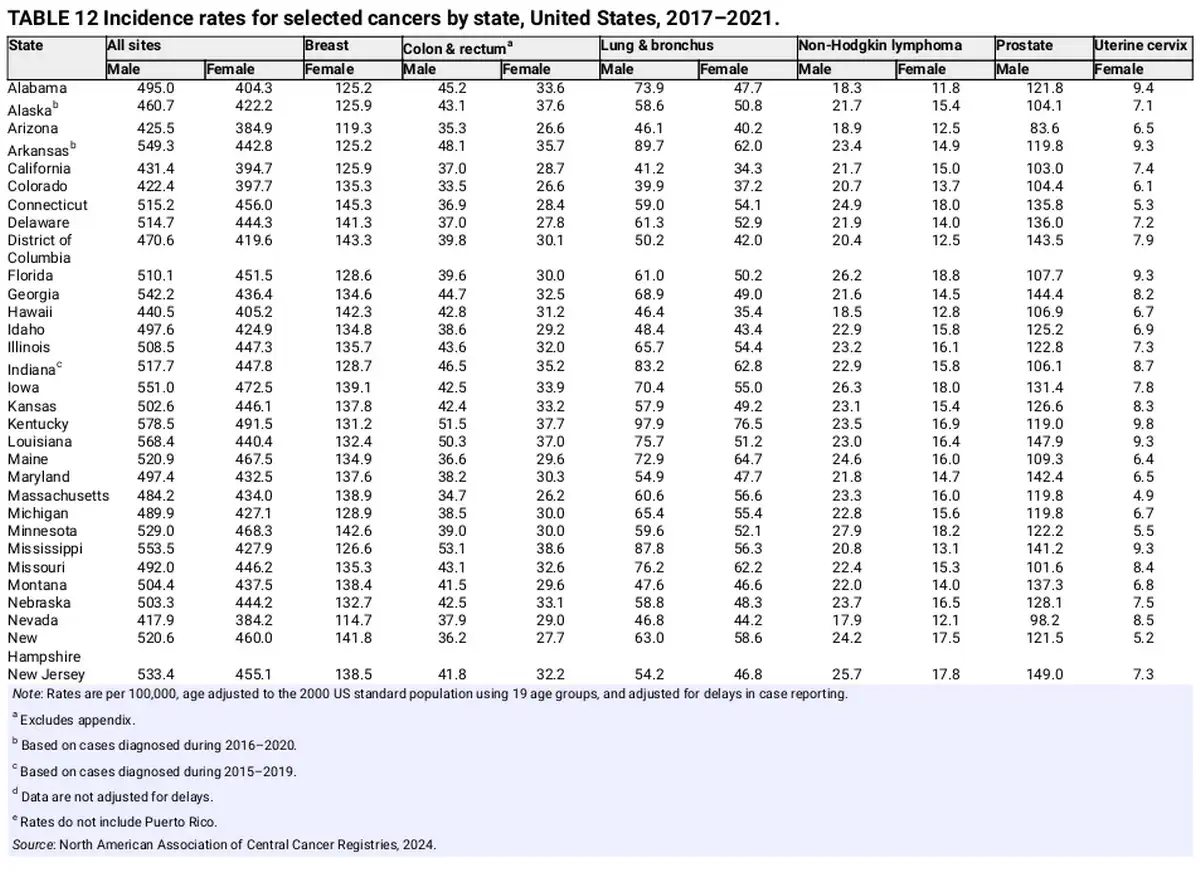
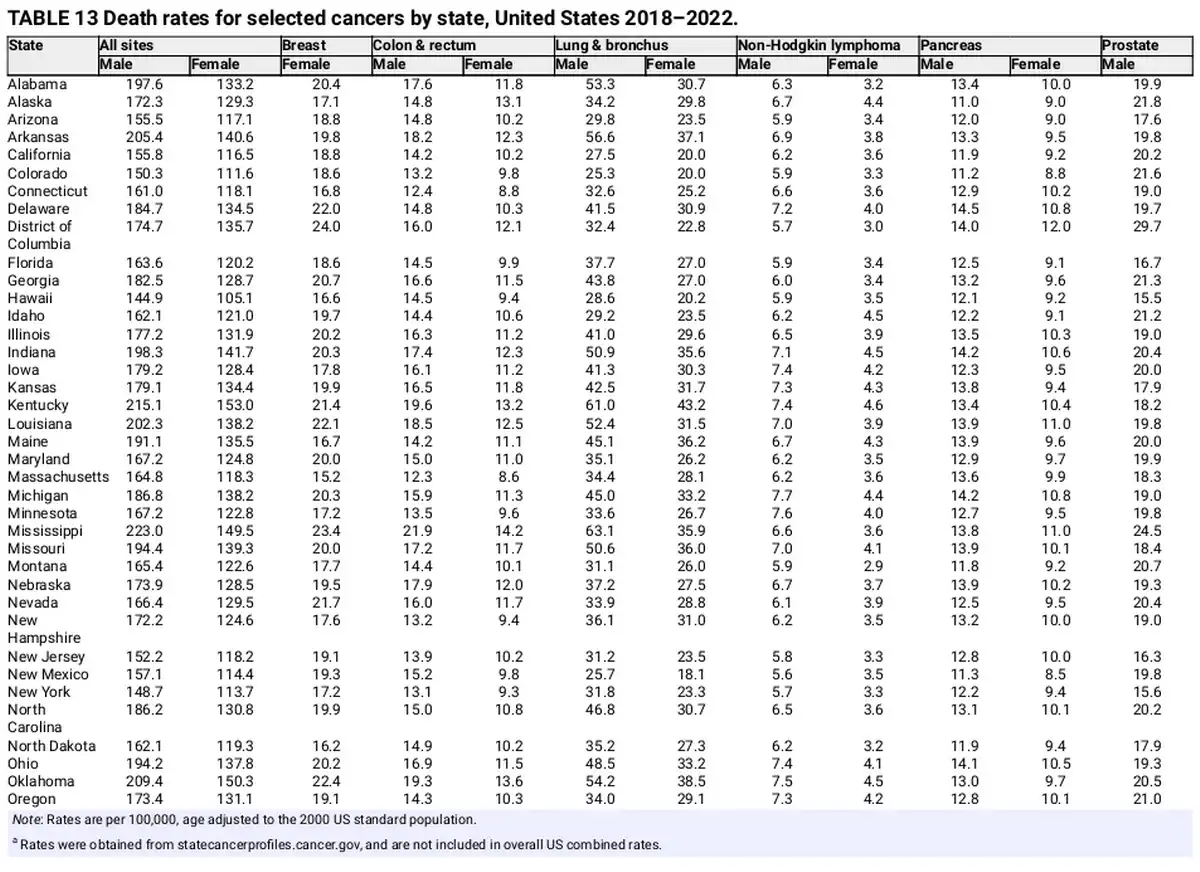
Although it is mostly preventable, cervical cancer incidence varies two‐fold by state, ranging from five per 100,000 women in Massachusetts, New Hampshire, and Connecticut to ≥10 per 100,000 women in Texas, Kentucky, West Virginia, Oklahoma, and Puerto Rico (Table 12). Advances in cancer control create or exacerbate disparities because of the unequal dissemination of interventions. Although HPV vaccination can virtually eliminate cervical cancer and prevent against numerous other cancers, large state differences in coverage will likely widen existing disparities. In 2022, up‐to‐date HPV vaccination among boys and girls aged 13 to 17 years per 100,000 people ranged from 38% in Mississippi and 46% in Oklahoma to 78% in the District of Columbia and 85% in Rhode Island.
Cancer in children and adolescents
Cancer is the second most common cause of death among children aged 1–14 years (after accidents) and the fourth most common cause of death among adolescents (aged 15–19 years). In 2025, an estimated 9550 children (aged birth to 14 years) and 5140 adolescents (aged 15–19 years) will be diagnosed with cancer, and 1050 and 600, respectively, will die from the disease. An estimated one in 264 children and adolescents will be diagnosed with cancer before age 20 years.
Leukemia is the most common childhood cancer, accounting for 28% of cases, followed closely by central nervous system tumors (27%), one third of which are benign or borderline malignant (Table 14). Cancer types and their distribution differ in adolescents, among whom the most common cancer is central nervous system tumors (22%), more than one half of which are benign or borderline malignant, followed by lymphoma (19%) and leukemia (13%). In addition, Hodgkin lymphoma is much more common than non‐Hodgkin lymphoma among adolescents, whereas the reverse is true among children. Thyroid carcinoma accounts for 12% of cancers in adolescents but only 2% in children.
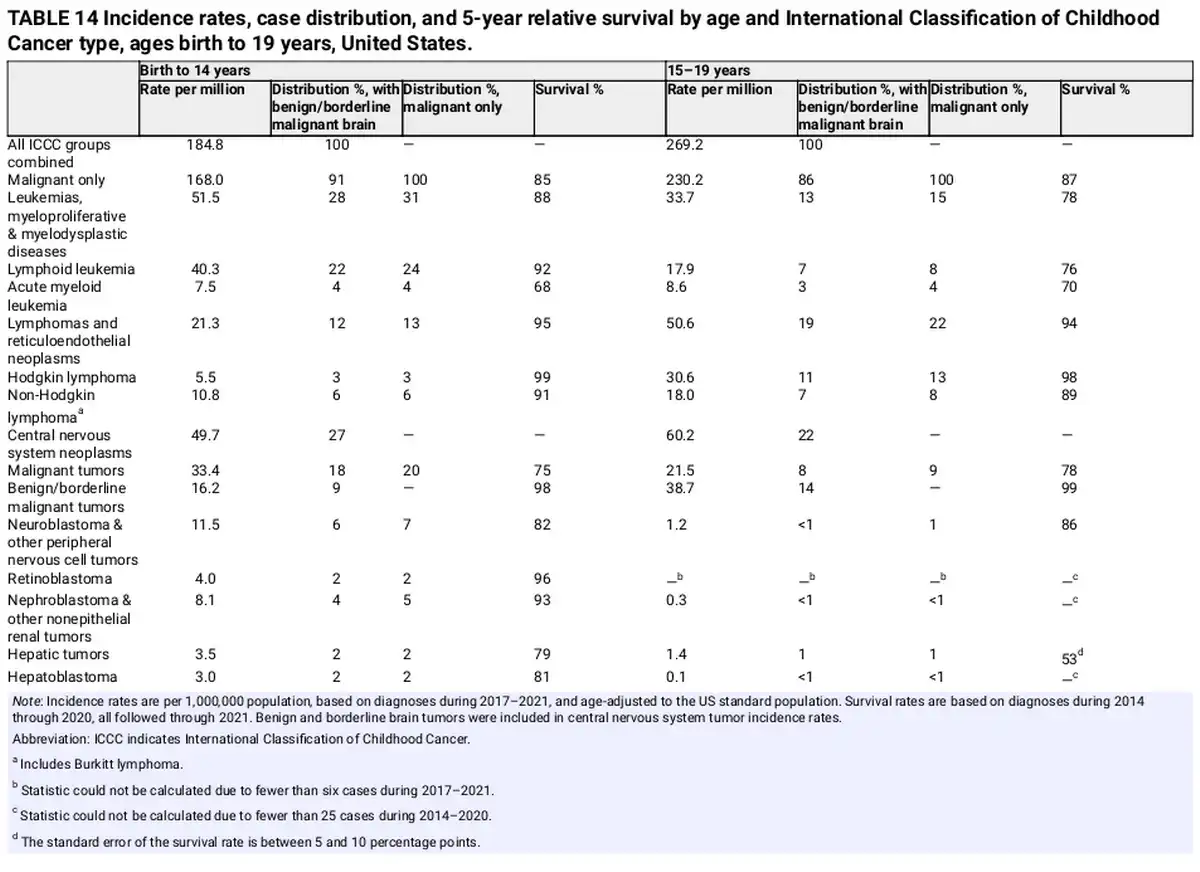
After increasing since at least 1975, the overall invasive cancer incidence rate in children declined slightly from 2015 through 2021 by 0.8% per year driven by a recent rapid decline in malignant brain tumors (from 37.3 per million in 2017 to 31.9 per million in 2021) and stabilized rates of lymphoid leukemia. In contrast, overall incidence continued a slow increase in adolescents (by 0.7% per year) because of climbing rates for both lymphoid leukemia and non‐Hodgkin lymphoma. Malignant brain tumors decreased rapidly, consistent with the pattern in children, but represent only 9% of all malignancies versus 20% in children. The steep (4% per year) rise in thyroid cancer incidence rates since at least 1998 may be stabilizing in recent years.
In contrast, cancer mortality has declined steadily since 1970, from 6.3 to 1.9 per 100,000 in 2020–2022 in children and from 7.2 to 2.7 in adolescents, for overall reductions of 70% and 63%, respectively. Much of this progress reflects the dramatic declines in mortality for leukemia of 83% in children and 73% in adolescents (based on the average rate during 2018–2022 compared to 1970). Remission rates of 90%–100% have been achieved for childhood acute lymphocytic leukemia over the past 4 decades, primarily through the optimization of established chemotherapeutic regimens as opposed to the development of new therapies. However, progress among adolescents has lagged behind that in children, partly because of differences in tumor biology, clinical trial enrollment, treatment protocols, and tolerance and adherence to treatment.
The 5‐year relative survival rate for all cancers combined improved from 58% for diagnoses during the mid‐1970s to 85% during 2014 through 2020 in children and from 68% to 87% in adolescents, but it varies substantially by cancer type and age at diagnosis. Survival is higher in children than in adolescents for lymphoid leukemia (92% vs. 76%), Ewing sarcoma (81% vs. 68%), hepatic tumors (79% vs. 53%), and rhabdomyosarcoma (66% vs. 53%) but is higher in adolescents (although not statistically significantly) for neuroblastoma (82% vs. 86%) and malignant brain tumors (75% vs. 78%; Table 14). Survival rates are lowest in both children and adolescents for hepatic tumors, osteosarcoma, and rhabdomyosarcoma. Long‐term survivors of childhood cancer are at substantially elevated risk of treatment‐related adverse health effects as they age. For example, one longitudinal study found that 18% of childhood cancer survivors had experienced a major cardiovascular event by the age of 50 years compared with 0.9% of community controls. Thus survivorship care plans are particularly critical for young survivors to help facilitate informed prevention and early detection interventions in addition to surveillance for subsequent cancers.
Limitations
The estimated numbers of new cancer cases and deaths in 2025 provide a reasonably accurate portrayal of the contemporary cancer burden, but these model‐based 3‐year to 4‐year projections should not be used to track temporal trends for several reasons. First, the methodology changes, most recently in 2021,, to take advantage of improved modeling techniques and cancer surveillance coverage. Second, although the models are robust, they can only account for trends through the most recent data year (currently, 2021 for incidence and 2022 for mortality) and cannot accommodate abrupt fluctuations caused by changes in detection practice, such as those that occurred for prostate cancer because of changes in PSA testing. Third, the model can be oversensitive to sudden or steep changes in observed data. The most informative metrics for tracking cancer trends are age‐standardized or age‐specific cancer incidence rates from SEER, NPCR, and/or NAACCR and cancer death rates from the NCHS.
Errors in reporting race and ethnicity in medical records and on death certificates result in underestimated cancer incidence and mortality in persons who are not White, particularly Native American populations. Racial misclassification for cancer incidence is reduced by confining cases to those diagnosed in Purchased/Referred Care Delivery Area counties, which are associated with the Indian Health Service, but thus excludes one third of the Native American population who reside in urban areas. In addition, mortality data for the Native American population are adjusted for racial misclassification using factors for all cancers combined and may overestimate or underestimate rates for individual cancer types. Cancer data for other non‐White groups in the United States are mostly limited to the broadly defined racial and ethnic categories developed by the Office of Management and Budget and mask important differences in the cancer burden within these heterogenous populations. For example, breast cancer mortality is approximately 40% lower in AAPI women than in White women overall (Table 8), but it is 30% higher in Native Hawaiian and other Pacific Islander women, who are classified within this category. Finally, the lack of sexual orientation and gender identity data collection precludes an analysis of cancer occurrence in the LGBTQ+ (lesbian, gay, bisexual, transgender, and queer or questioning) population, which would undoubtedly inform targeted cancer control efforts given the high prevalence of smoking in this group.
CONCLUSION
Cancer mortality continued to decline in the United States through 2022, resulting in an overall drop of 34% since 1991 because of reductions in smoking, earlier detection for some cancers, and improved treatment, including recent developments in targeted treatment and immunotherapy. However, progress is lagging in cancer prevention. Incidence continues to increase for six of the top 10 cancers (breast, prostate, melanoma, uterine corpus, pancreas, and CRC [aged <65 years]), two of which primarily affect women. Consequently, the cancer burden is shifting from older to younger adults and from men to women. Middle‐aged women now have slightly higher cancer risk than their male counterparts, and young women are almost twice as likely to be diagnosed as young men. Wide, unabated racial disparities are also alarming. Native American and Black people have two to three times the cancer death rate as White people for numerous cancers, many of which are largely preventable. Overall progress against cancer could be accelerated by increasing investment in both cancer prevention and treatment, especially for uterine corpus and pancreatic cancer, and mitigating disparities through expanded access to high‐quality care, with emphasis on AIAN and Black communities.
CONFLICT OF INTEREST STATEMENT
Rebecca L. Siegel, Tyler B. Kratzer, Angela N. Giaquinto, Hyuna Sung, and Ahmedin Jemal are employed by the American Cancer Society, which receives grants from private and corporate foundations, including foundations associated with companies in the health sector, for research outside of the submitted work. The authors are not funded by or key personnel for any of these grants, and their salary is solely funded through American Cancer Society funds. The authors disclosed no conflicts of interest.
ACKNOWLEDGMENTS
The authors gratefully acknowledge all cancer registries and their staff for their hard work and diligence in collecting cancer information, without which this research could not have been accomplished.
REFERENCES
- 1. Howlader N, Chen HS, Noone AM, et al. Impact of COVID‐19 on 2021 cancer incidence rates and potential rebound from 2020 decline. J Natl Cancer Inst. Published online September 24, 2024. doi:10.1093/jnci/djae180
- 2. Yabroff KR, Wu XC, Negoita S, et al. Association of the COVID‐19 pandemic with patterns of statewide cancer services. J Natl Cancer Inst. 2022;114(6):907–909. 10.1093/jnci/djab122
- 3. van den Puttelaar R, Lansdorp‐Vogelaar I, Hahn AI, et al. Impact and recovery from COVID‐19–related disruptions in colorectal cancer screening and care in the US: a scenario analysis. Cancer Epidemiol Biomarkers Prev. 2023;32(1):22–29. doi:10.1158/1055‐9965.EPI‐22‐0544
- 4. Chen R, Aschmann HE, Chen YH, et al. Racial and ethnic disparities in estimated excess mortality from external causes in the US, March to December 2020. JAMA Intern Med. 2022;182(7):776–778. doi:10.1001/jamainternmed.2022.1461
- 5. Woolf SH, Chapman DA, Sabo RT, Zimmerman EB. Excess deaths from COVID‐19 and other causes in the US, March 1, 2020, to January 2, 2021. JAMA. 2021;325(17):1786–1789. doi:10.1001/jama.2021.5199
- 6. Richman I, Tessier‐Sherman B, Galusha D, Oladele CR, Wang K. Breast cancer screening during the COVID‐19 pandemic: moving from disparities to health equity. J Natl Cancer Inst. 2023;115(2):139–145. doi:10.1093/jnci/djac172
- 7. Surveillance, Epidemiology, and End Results (SEER) Program . SEER*Stat Database: Incidence‐SEER Research Data, 8 Registries, November 2023 Submission (1975–2021)‐Linked To County Attributes‐Time Dependent (1990–2022) Income/Rurality, 1969–2022 Counties, released April 2024, based on the November 2023 submission. National Cancer Institute, Division of Cancer Control and Population Sciences, Surveillance Research Program; 2024.
- 8. Surveillance, Epidemiology, and End Results (SEER) Program . SEER*Stat Database: Incidence‐SEER Research Data, 9 Registries (1975–2018), released April 2021, based on the November 2020 submission. National Cancer Institute, Division of Cancer Control and Population Sciences, Surveillance Research Program; 2021.
- 9. Surveillance, Epidemiology, and End Results (SEER) Program . SEER*Stat Database: Incidence‐SEER Research Limited‐Field Data, 22 Registries (excluding Illinois and Massachusetts), November 2023 Submission (2000–2021)‐Linked To County Attributes‐Time Dependent (1990–2022) Income/Rurality, 1969–2022 Counties, released April 2024, based on the November 2023 submission. National Cancer Institute, Division of Cancer Control and Population Sciences, Surveillance Research Program; 2024.
- 10. Surveillance, Epidemiology, and End Results (SEER) Program . SEER*Stat Database: North American Association of Central Cancer Registries (NAACCR) Incidence Data‐Cancer in North America Research Data, 1998–2021, Delay Adjusted Factors‐American Cancer Society Facts and Figures (which includes data from the Centers for Disease Control and Prevention's National Program of Cancer Registries, the Canadian Cancer Registry's Provincial and Territorial Registries, and the National Cancer Institute's SEER Registries), certified by the NAACCR as meeting high‐quality incidence data standards for the specified time periods, submitted December 2023. National Cancer Institute, Division of Cancer Control and Population Sciences, Surveillance Research Program, Surveillance Systems Branch; 2024.
- 11. Surveillance, Epidemiology, and End Results (SEER) Program . SEER*Stat Database: North American Association of Central Cancer Registries (NAACCR) Incidence Data‐Cancer in North America Research Data, 1995–2021, Standard File, American Cancer Society Facts and Figures (which includes data from the Centers for Disease Control and Prevention's National Program of Cancer Registries, the Canadian Cancer Registry's Provincial and Territorial Registries, and the National Cancer Institute's SEER Registries), certified by the NAACCR as meeting high‐quality incidence data standards for the specified time periods, submitted December 2023. National Cancer Institute, Division of Cancer Control and Population Sciences, Surveillance Research Program, Surveillance Systems Branch; 2024.
- 12. Surveillance, Epidemiology, and End Results (SEER) Program . SEER*Stat Database: Mortality‐All Causes of Death, Total U.S. (1969–2022) <Katrina/Rita Population Adjustment>‐Linked To County Attributes‐Total U.S., 1969–2022 Counties [underlying mortality data provided by the National Center for Health Statistics], released April 2024. National Cancer Institute, Division of Cancer Control and Population Sciences, Surveillance Research Program; 2024.
- 13. Wingo PA, Cardinez CJ, Landis SH, et al. Long‐term trends in cancer mortality in the United States, 1930–1998. Cancer. 2003;97(12 suppl):3133–3275. doi:10.1002/cncr.11380
- 14. Murphy SL, Kochanek KD, Xu J, Heron M. Deaths: final data for 2012. Natl Vital Stat Rep. 2015;63(9):1–117.
- 15. Steliarova‐Foucher E, Stiller C, Lacour B, Kaatsch P. International Classification of Childhood Cancer, third edition. Cancer. 2005;103(7):1457–1467. doi:10.1002/cncr.20910
- 16. Fritz A, Percy C, Jack A, et al., eds. International Classification of Diseases for Oncology. World Health Organization; 2000.
- 17. Steliarova‐Foucher E, Colombet M, Ries LAG, et al. International incidence of childhood cancer, 2001–10: a population‐based registry study. Lancet Oncol. 2017;18(6):719–731. doi:10.1016/S1470‐2045(17)30186‐9
- 18. World Health Organization (WHO) . International Statistical Classification of Diseases and Related Health Problems., 10th revision, volumes I–III. WHO; 2011.
- 19. Mariotto AB, Feuer EJ, Howlader N, Chen HS, Negoita S, Cronin KA. Interpreting cancer incidence trends: challenges due to the COVID‐19 pandemic. J Natl Cancer Inst. 2023. doi:10.1093/jnci/djad086
- 20. Arias E, Xu J, Curtin S, Bastian B, Tejada‐Vera B. Mortality profile of the non‐Hispanic American Indian or Alaska Native population, 2019. Natl Vital Stat Rep. 2021;70(12):1–27.
- 21. Mariotto AB, Zou Z, Johnson CJ, Scoppa S, Weir HK, Huang B. Geographical, racial and socio‐economic variation in life expectancy in the US and their impact on cancer relative survival. PLoS One. 2018;13(7):e0201034. doi:10.1371/journal.pone.0201034
- 22. Clegg LX, Feuer EJ, Midthune DN, Fay MP, Hankey BF. Impact of reporting delay and reporting error on cancer incidence rates and trends. J Natl Cancer Inst. 2002;94(20):1537–1545. doi:10.1093/jnci/94.20.1537
- 23. Liu B, Zhu L, Zou J, et al. Updated methodology for projecting U.S.‐ and state‐level cancer counts for the current calendar year: Part I: spatio‐temporal modeling for cancer incidence. Cancer Epidemiol Biomarkers Prev. 2021;30(9):1620–1626. doi:10.1158/1055‐9965.EPI‐20‐1727
- 24. Miller KD, Siegel RL, Liu B, et al. Updated methodology for projecting U.S.‐ and state‐level cancer counts for the current calendar year: Part II: evaluation of incidence and mortality projection methods. Cancer Epidemiol Biomarkers Prev. 2021;30(11):1993–2000. doi:10.1158/1055‐9965.EPI‐20‐1780
- 25. Pickle LW, Hao Y, Jemal A, et al. A new method of estimating United States and state‐level cancer incidence counts for the current calendar year. CA Cancer J Clin. 2007;57(1):30–42. doi:10.3322/canjclin.57.1.30
- 26. Sung H, Siegel RL, Rosenberg PS, Jemal A. Emerging cancer trends among young adults in the USA: analysis of a population‐based cancer registry. Lancet Public Health. 2019;4(3):e137–e147. doi:10.1016/S2468‐2667(18)30267‐6
- 27. American Cancer Society . Cancer Prevention & Early Detection Facts & Figures Tables and Figures 2024. American Cancer Society; 2024. Accessed August 1, 2024. https://www.cancer.org/content/dam/cancer‐org/research/cancer‐facts‐and‐statistics/cancer‐prevention‐and‐early‐detection‐facts‐and‐figures/2024‐cped‐files/cped‐2024‐cff‐tables‐and‐figures.pdf
- 28. Islami F, Marlow EC, Thomson B, et al. Proportion and number of cancer cases and deaths attributable to potentially modifiable risk factors in the United States, 2019. CA Cancer J Clin. 2024;74(5):405–432. doi:10.3322/caac.21858
- 29. Christensen CH, Rostron B, Cosgrove C, et al. Association of cigarette, cigar, and pipe use with mortality risk in the US population. JAMA Intern Med. 2018;178(4):469–476. doi:10.1001/jamainternmed.2017.8625
- 30. Mamtani R, Cheema S, Sheikh J, Al Mulla A, Lowenfels A, Maisonneuve P. Cancer risk in waterpipe smokers: a meta‐analysis. Int J Public Health. 2017;62(1):73–83. doi:10.1007/s00038‐016‐0856‐2
- 31. National Research Council Committee on Health Risks of Exposure to Radon (BEIR VI) . Health Effects of Exposure to Radon: BEIR VI. National Academies Press; 1999.
- 32. Straif K, Benbrahim‐Tallaa L, Baan R, et al. A review of human carcinogens—Part C: metals, arsenic, dusts, and fibres. Lancet Oncol. 2009;10(5):453–454. doi:10.1016/s1470‐2045(09)70134‐2
- 33. LoPiccolo J, Gusev A, Christiani DC, Jänne PA. Lung cancer in patients who have never smoked—an emerging disease. Nat Rev Clin Oncol. 2024;21(2):121–146. 10.1038/s41571‐023‐00844‐0
- 34. Bracken‐Clarke D, Kapoor D, Baird AM, et al. Vaping and lung cancer—a review of current data and recommendations. Lung Cancer. 2021;153:11–20. doi:10.1016/j.lungcan.2020.12.030
- 35. Negoita S, Chen HS, Sanchez PV, et al. Annual Report to the Nation on the Status of Cancer, part 2: early assessment of the COVID‐19 pandemic's impact on cancer diagnosis. Cancer. 2024;130(1):117–127. doi:10.1002/cncr.35026
- 36. Burus T, Lei F, Huang B, et al. COVID‐19 and rates of cancer diagnosis in the US. JAMA Netw Open. 2024;7(9):e2432288. doi:10.1001/jamanetworkopen.2024.32288
- 37. Potosky AL, Miller BA, Albertsen PC, Kramer BS. The role of increasing detection in the rising incidence of prostate cancer. JAMA. 1995;273(7):548–552.
- 38. Choi YJ, Lee DH, Han K‐D, et al. Adult height in relation to risk of cancer in a cohort of 22,809,722 Korean adults. Br J Cancer. 2019;120(6):668–674. doi:10.1038/s41416‐018‐0371‐8
- 39. Green J, Cairns BJ, Casabonne D, et al. Height and cancer incidence in the Million Women Study: prospective cohort, and meta‐analysis of prospective studies of height and total cancer risk. Lancet Oncol. 2011;12(8):785–794. doi:10.1016/S1470‐2045(11)70154‐1
- 40. Klein SL, Flanagan KL. Sex differences in immune responses. Nat Rev Immunol. 2016;16:626–638. doi:10.1038/nri.2016.90
- 41. Jackson SS, Marks MA, Katki HA, et al. Sex disparities in the incidence of 21 cancer types: quantification of the contribution of risk factors. Cancer. 2022;128(19):3531–3540. doi:10.1002/cncr.34390
- 42. Jemal A, Fedewa SA, Ma J, et al. Prostate cancer incidence and PSA testing patterns in relation to USPSTF screening recommendations. JAMA. 2015;314(19):2054–2061. doi:10.1001/jama.2015.14905
- 43. Moyer VA, U.S. Preventive Services Task Force . Screening for prostate cancer: U.S. Preventive Services Task Force recommendation statement. Ann Intern Med. 2012;157(2):120–134. doi:10.7326/0003‐4819‐157‐2‐201207170‐00459
- 44. Devasia TP, Mariotto AB, Nyame YA, Etzioni R. Estimating the number of men living with metastatic prostate cancer in the United States. Cancer Epidemiol Biomarkers Prev. 2023;32(5):659–665. doi:10.1158/1055‐9965.EPI‐22‐1038
- 45. Etzioni R, Tsodikov A, Mariotto A, et al. Quantifying the role of PSA screening in the US prostate cancer mortality decline. Cancer Causes Control. 2008;19(2):175–181. doi:10.1007/s10552‐007‐9083‐8
- 46. Sherer MV, Qiao EM, Kotha NV, Qian AS, Rose BS. Association between prostate‐specific antigen screening and prostate cancer mortality among non‐Hispanic Black and Non‐Hispanic White US veterans. JAMA Oncol. 2022;8(10):1471–1476. doi:10.1001/jamaoncol.2022.2970
- 47. Hugosson J, Godtman RA, Wallstrom J, et al. Results after four years of screening for prostate cancer with PSA and MRI. N Engl J Med. 2024;391(12):1083–1095. doi:10.1056/NEJMoa2406050
- 48. Fazekas T, Shim SR, Basile G, et al. Magnetic resonance imaging in prostate cancer screening: a systematic review and meta‐analysis. JAMA Oncol. 2024;10(6):745–754. doi:10.1001/jamaoncol.2024.0734
- 49. Leapman MS, Wang R, Park HS, et al. Adoption of new risk stratification technologies within US hospital referral regions and association with prostate cancer management. JAMA Netw Open. 2021;4(10):e2128646. doi:10.1001/jamanetworkopen.2021.28646
- 50. Mukand NH, Chirikova E, Lichtensztajn D, et al. Assessing sociodemographic and regional disparities in Oncotype DX Genomic prostate score uptake. Cancer. Published online August 19, 2024. doi:10.1002/cncr.35511
- 51. Cooperberg MR, Meeks W, Fang R, Gaylis FD, Catalona WJ, Makarov DV. Time trends and variation in the use of active surveillance for management of low‐risk prostate cancer in the US. JAMA Netw Open. 2023;6(3):e231439. doi:10.1001/jamanetworkopen.2023.1439
- 52. Al Hussein AAB, Barocas DA, Zhu A, et al. Use of active surveillance vs definitive treatment among men with low‐ and favorable intermediate‐risk prostate cancer in the US between 2010 and 2018. JAMA Intern Med. 2023;183(6):608–611. doi:10.1001/jamainternmed.2022.7100
- 53. Diven MA, Tshering L, Ma X, et al. Trends in active surveillance for men with intermediate‐risk prostate cancer. JAMA Netw Open. 2024;7(8):e2429760. doi:10.1001/jamanetworkopen.2024.29760
- 54. Leapman MS, Wang R, Park H, et al. Changes in prostate‐specific antigen testing relative to the revised US Preventive Services Task Force recommendation on prostate cancer screening. JAMA Oncol. 2022;8(1):41–47. doi:10.1001/jamaoncol.2021.5143
- 55. Fenton J, Weyrick M, Durbin S, Liu Y, Bang H, Melnikow J. Prostate‐specific antigen‐based screening for prostate cancer: a systematic evidence review for the U.S. Preventive Services Task Force. AHRQ Report. 17‐05229‐EF‐1, No. 154. Agency for Healthcare and Research Quality; 2017.
- 56. US Preventive Services Task Force ; Grossman DC, Curry SJ, et al. Screening for prostate cancer: US Preventive Services Task Force recommendation statement. JAMA. 2018;319(18):1901–1913. doi:10.1001/jama.2018.3710
- 57. National Center for Health Statistics, Centers for Disease Control and Prevention .2023 National Health Interview Survey. Public‐use data file and documentation. National Center for Health Statistics; 2023. Accessed August 1, 2024. https://www.cdc.gov/nchs/nhis/2023nhis.htm
- 58. Basourakos SP, Gulati R, Vince RA, et al. Harm‐to‐benefit of three decades of prostate cancer screening in Black men. NEJM Evid. 2022;1(6):evidoa2200031. doi:10.1056/evidoa2200031
- 59. Awasthi S, Grass GD, Torres‐Roca J, et al. Genomic testing in localized prostate cancer can identify subsets of African‐Americans with aggressive disease. J Natl Cancer Inst. 2022;114(12):1656–1664. doi:10.1093/jnci/djac162
- 60. American Cancer Society . Cancer Prevention & Early Detection Facts & Figures 2023–2024. American Cancer Society;2023. Accessed August 1, 2024. https://www.cancer.org/research/cancer‐facts‐statistics/cancer‐prevention‐early‐detection.html
- 61. Kensler KH, Johnson R, Morley F, et al. Prostate cancer screening in African American men: a review of the evidence. J Natl Cancer Inst. 2024;116(1):34–52. doi:10.1093/jnci/djad193
- 62. Wolf AMD, Wender RC, Etzioni RB, et al. American Cancer Society guideline for the early detection of prostate cancer: update 2010. CA Cancer J Clin. 2010;60(2):70–98. doi:10.3322/caac.20066
- 63. Giaquinto AN, Sung H, Newman LA, et al. Breast cancer statistics 2024. CA Cancer J Clin. Published online October 1, 2024. doi:10.3322/caac.21863
- 64. Pfeiffer RM, Webb‐Vargas Y, Wheeler W, Gail MH. Proportion of U.S. trends in breast cancer incidence attributable to long‐term changes in risk factor distributions. Cancer Epidemiol Biomarkers Prev. 2018;27(10):1214–1222. doi:10.1158/1055‐9965.EPI‐18‐0098
- 65. Premenopausal Breast Cancer Collaborative Group; Schoemaker MJ, Nichols HB, et al. Association of body mass index and age with subsequent breast cancer risk in premenopausal women. JAMA Oncol. 2018;4(11):e181771. doi:10.1001/jamaoncol.2018.1771
- 66. Keyes KM, Jager J, Mal‐Sarkar T, Patrick ME, Rutherford C, Hasin D. Is there a recent epidemic of women's drinking? A critical review of national studies. Alcohol Clin Exp Res. 2019;43(7):1344–1359. doi:10.1111/acer.14082
- 67. McKetta SC, Keyes KM. Trends in U.S. women's binge drinking in middle adulthood by socioeconomic status, 2006–2018. Drug Alcohol Depend. 2020;212:108026. doi:10.1016/j.drugalcdep.2020.108026
- 68. Adams RS, McKetta SC, Jager J, Stewart MT, Keyes KM. Cohort effects of women's mid‐life binge drinking and alcohol use disorder symptoms in the United States: impacts of changes in timing of parenthood. Addiction. 2023;118(10):1932–1941. doi:10.1111/add.16262
- 69. US Preventive Services Task Force ; Bibbins‐Domingo K, Grossman C, et al. Screening for thyroid cancer: US Preventive Services Task Force recommendation statement. JAMA. 2017;317(18):1882–1887. doi:10.1001/jama.2017.4011
- 70. Haugen BR. 2015 American Thyroid Association management guidelines for adult patients with thyroid nodules and differentiated thyroid cancer: what is new and what has changed? Cancer. 2017;123(3):372–381. doi:10.1002/cncr.30360
- 71. Furuya‐Kanamori L, Bell KJL, Clark J, Glasziou P, Doi SAR. Prevalence of differentiated thyroid cancer in autopsy studies over six decades: a meta‐analysis. J Clin Oncol. 2016;34(30):3672–3679. doi:10.1200/JCO.2016.67.7419
- 72. LeClair K, Bell KJL, Furuya‐Kanamori L, Doi SA, Francis DO, Davies L. Evaluation of gender inequity in thyroid cancer diagnosis: differences by sex in US thyroid cancer incidence compared with a meta‐analysis of subclinical thyroid cancer rates at autopsy. JAMA Intern Med. 2021;181(10):1351–1358. doi:10.1001/jamainternmed.2021.4804
- 73. Harris JE. Cigarette smoking among successive birth cohorts of men and women in the United States during 1900‐80. J Natl Cancer Inst. 1983;71(3):473–479.
- 74. Jemal A, Miller KD, Ma J, et al. Higher lung cancer incidence in young women than young men in the United States. N Engl J Med. 2018;378(21):1999–2009. doi:10.1056/NEJMoa1715907
- 75. Siegel RL, Torre LA, Soerjomataram I, et al. Global patterns and trends in colorectal cancer incidence in young adults. Gut. 2019;68(12):2179–2185. doi:10.1136/gutjnl‐2019‐319511
- 76. Siegel RL, Miller KD, Jemal A. Colorectal cancer mortality rates in adults aged 20 to 54 years in the United States, 1970–2014. JAMA. 2017;318(6):572–574. doi:10.1001/jama.2017.7630
- 77. Wolf AMD, Fontham ETH, Church TR, et al. Colorectal cancer screening for average‐risk adults: 2018 guideline update from the American Cancer Society. CA Cancer J Clin. 2018;68(4):250–281. doi:10.3322/caac.21457
- 78. US Preventive Services Task Force ; Davidson KW, Barry MJ, et al. Screening for Colorectal Cancer: US Preventive Services Task Force recommendation statement. JAMA. 2021;325(19):1965–1977. doi:10.1001/jama.2021.6238
- 79. Siegel RL, Wagle NS, Cercek A, Smith RA, Jemal A. Colorectal cancer statistics, 2023. CA Cancer J Clin. 2023;73(3):233–254. doi:10.3322/caac.21772
- 80. Siddique S, Wang R, Yasin F, et al. USPSTF colorectal cancer screening recommendation and uptake for individuals aged 45 to 49 years. JAMA Netw Open. 2024;7(10):e2436358. doi:10.1001/jamanetworkopen.2024.36358
- 81. Suk R, Hong YR, Rajan SS, Xie Z, Zhu Y, Spencer JC. Assessment of US Preventive Services Task Force guideline–concordant cervical cancer screening rates and reasons for underscreening by age, race and ethnicity, sexual orientation, rurality, and insurance, 2005 to 2019. JAMA Netw Open. 2022;5(1):e2143582. doi:10.1001/jamanetworkopen.2021.43582
- 82. Watson M, Benard V, Flagg EW. Assessment of trends in cervical cancer screening rates using healthcare claims data: United States, 2003–2014. Prev Med Rep. 2018;9:124–130. doi:10.1016/j.pmedr.2018.01.010
- 83. de Martel C, Plummer M, Vignat J, Franceschi S. Worldwide burden of cancer attributable to HPV by site, country and HPV type. Int J Cancer. 2017;141(4):664–670. doi:10.1002/ijc.30716
- 84. Markowitz LE, Dunne EF, Saraiya M, et al. Quadrivalent human papillomavirus vaccine: recommendations of the Advisory Committee on Immunization Practices (ACIP). MMWR Recomm Rep. 2007;56(RR‐2):1–24.
- 85. Adcock R, Kang H, Castle PE, et al. Population‐based incidence of cervical intraepithelial neoplasia across 14 years of HPV vaccination. JAMA Oncol. 2024;10(9):1287–1290. doi:10.1001/jamaoncol.2024.2673
- 86. Baandrup L, Maltesen T, Dehlendorff C, Kjaer SK. HPV vaccination and anal high‐grade precancerous lesions and cancer: a real‐world effectiveness study. J Natl Cancer Inst. 2024;116(2):283–287. doi:10.1093/jnci/djad189
- 87. Rosenblum HG, Lewis RM, Gargano JW, Querec TD, Unger ER, Markowitz LE. Human papillomavirus vaccine impact and effectiveness through 12 years after vaccine introduction in the United States, 2003 to 2018. Ann Intern Med. 2022;175(7):918–926. doi:10.7326/M21‐3798
- 88. Kreimer AR, Sampson JN, Porras C, et al. Evaluation of durability of a single dose of the bivalent HPV vaccine: the CVT trial. J Natl Cancer Inst. 2020;112(10):1038–1046. doi:10.1093/jnci/djaa011
- 89. Rodriguez AM, Zeybek B, Vaughn M, et al. Comparison of the long‐term impact and clinical outcomes of fewer doses and standard doses of human papillomavirus vaccine in the United States: a database study. Cancer. 2020;126(8):1656–1667. doi:10.1002/cncr.32700
- 90. UK Health Security Agency . HPV vaccination programme moves to single dose from September 2023. Teenagers and eligible GBMSM under the age of 25 will only require a single HPV jab from September, following updated advice from JCVI [press release]. UK Health Security Agency; 2023.
- 91. Markowitz LE, Unger ER. Human papillomavirus vaccination. N Engl J Med. 2023;388(19):1790–1798. doi:10.1056/NEJMcp2108502
- 92. Pingali C, Yankey D, Chen M, et al. National vaccination coverage among adolescents aged 13–17 years—National Immunization Survey‐Teen, United States, 2023. MMWR Morb Mortal Wkly Rep. 2024;73(33):708–714. doi:10.15585/mmwr.mm7333a1
- 93. Croswell JM, Ransohoff DF, Kramer BS. Principles of cancer screening: lessons from history and study design issues. Semin Oncol. 2010;37(3):202–215. doi:10.1053/j.seminoncol.2010.05.006
- 94. O'Grady TJ, Gates MA, Boscoe FP. Thyroid cancer incidence attributable to overdiagnosis in the United States 1981‐2011. Int J Cancer. 2015;137(11):2664–2673. doi:10.1002/ijc.29634
- 95. Haghighat S, Jiang C, El‐Rifai W, Zaika A, Goldberg DS, Kumar S. Urgent need to mitigate disparities in federal funding for cancer research. J Natl Cancer Inst. 2023;115(10):1220–1223. doi:10.1093/jnci/djad097
- 96. Sasaki K, Strom SS, O'Brien S, et al. Relative survival in patients with chronic‐phase chronic myeloid leukaemia in the tyrosine‐kinase inhibitor era: analysis of patient data from six prospective clinical trials. Lancet Haematol. 2015;2(5):e186–e193. doi:10.1016/S2352‐3026(15)00048‐4
- 97. Osman AEG, Deininger MW. Chronic myeloid leukemia: modern therapies, current challenges and future directions. Blood Rev. 2021;49:100825. doi:10.1016/j.blre.2021.100825
- 98. Li Y, Zeng P, Xiao J, Huang P, Liu P. Modulation of energy metabolism to overcome drug resistance in chronic myeloid leukemia cells through induction of autophagy. Cell Death Discov. 2022;8(1):212. doi:10.1038/s41420‐022‐00991‐w
- 99. Chen Y, Chen J, Zou Z, Xu L, Li J. Crosstalk between autophagy and metabolism: implications for cell survival in acute myeloid leukemia. Cell Death Discov. 2024;10(1):46. doi:10.1038/s41420‐024‐01823‐9
- 100. Curti BD, Faries MB. Recent advances in the treatment of melanoma. N Engl J Med. 2021;384(23):2229–2240. doi:10.1056/NEJMra2034861
- 101. Aredo JV, Wakelee HA. Top advances of the year: Perioperative therapy for lung cancer. Cancer. 2024;130(17):2897–2903. doi:10.1002/cncr.35357
- 102. Howlader N, Forjaz G, Mooradian MJ, et al. The effect of advances in lung‐cancer treatment on population mortality. N Engl J Med. 2020;383(7):640–649. doi:10.1056/NEJMoa1916623
- 103. Muthusamy B, Patil PD, Pennell NA. Perioperative systemic therapy for resectable non‐small cell lung cancer. J Natl Compr Canc Netw. 2022;20(8):953–961. doi:10.6004/jnccn.2022.7021
- 104. Jones GS, Baldwin DR. Recent advances in the management of lung cancer. Clin Med (Lond). 2018;18(suppl 2):s41–s46. doi:10.7861/clinmedicine.18‐2‐s41
- 105. Rami‐Porta R, Call S, Dooms C, et al. Lung cancer staging: a concise update. Eur Respir J. 2018;51(5);1800190. doi:10.1183/13993003.00190‐2018
- 106. Potter AL, Rosenstein AL, Kiang MV, et al. Association of computed tomography screening with lung cancer stage shift and survival in the United States: quasi‐experimental study. BMJ. 2022;376:e069008. doi:10.1136/bmj‐2021‐069008
- 107. Kratzer TB, Bandi P, Freedman ND, et al. Lung cancer statistics, 2023. Cancer. 2024;130(8):1330–1348. doi:10.1002/cncr.35128
- 108. Erickson BK, Slomovitz B, Powell M, Eskander RN. Top advances of the year: uterine cancer. Cancer. 2024;130(14):2409–2412. doi:10.1002/cncr.35321
- 109. Forjaz G, Ries L, Devasia TP, Flynn G, Ruhl J, Mariotto AB. Long‐term cancer survival trends by updated summary stage. Cancer Epidemiol Biomarkers Prev. 2023;32(11):1508–1517. doi:10.1158/1055‐9965.EPI‐23‐0589
- 110. Hu K, Wang W, Liu X, Meng Q, Zhang F. Comparison of treatment outcomes between squamous cell carcinoma and adenocarcinoma of cervix after definitive radiotherapy or concurrent chemoradiotherapy. Radiat Oncol. 2018;13(1):249. doi:10.1186/s13014‐018‐1197‐5
- 111. Sherman ME, Wang SS, Carreon J, Devesa SS. Mortality trends for cervical squamous and adenocarcinoma in the United States. Relation to incidence and survival. Cancer. 2005;103(6):1258–1264. doi:10.1002/cncr.20877
- 112. Welch HG, Schwartz LM, Woloshin S. Are increasing 5‐year survival rates evidence of success against cancer? JAMA. 2000;283(22):2975–2978. doi:10.1001/jama.283.22.2975
- 113. Shiels MS, Graubard BI, McNeel TS, Kahle L, Freedman ND. Trends in smoking‐attributable and smoking‐unrelated lung cancer death rates in the United States, 1991–2018. J Natl Cancer Inst. 2024;116(5):711–716. doi:10.1093/jnci/djad256
- 114. de Koning HJ, van der Aalst CM, de Jong PA, et al. Reduced lung‐cancer mortality with volume CT screening in a randomized trial. N Engl J Med. 2020;382(6):503–513. doi:10.1056/NEJMoa1911793
- 115. Pinsky PF, Church TR, Izmirlian G, Kramer BS. The National Lung Screening Trial: results stratified by demographics, smoking history, and lung cancer histology. Cancer. 2013;119(22):3976–3983. doi:10.1002/cncr.28326
- 116. Henschke CI, Yip R, Shaham D, et al. A 20‐year follow‐up of the International Early Lung Cancer Action Program (I‐ELCAP). Radiology. 2023;309(2):e231988. doi:10.1148/radiol.231988
- 117. Wolf AMD, Oeffinger KC, Shih TYC, et al. Screening for lung cancer: 2023 guideline update from the American Cancer Society. CA Cancer J Clin. 2024;74(1):50–81. doi:10.3322/caac.21811
- 118. Bandi P, Star J, Ashad‐Bishop K, Kratzer T, Smith R, Jemal A. Lung cancer screening in the US, 2022. JAMA Intern Med. 2024;184(8):882–891. doi:10.1001/jamainternmed.2024.1655
- 119. Gyawali B, Booth CM. Treatment of metastatic pancreatic cancer: 25 years of innovation with little progress for patients. Lancet Oncol. 2024;25(2):167–170. doi:10.1016/S1470‐2045(23)00516‐8
- 120. Dasari A, Shen C, Halperin D, et al. Trends in the incidence, prevalence, and survival outcomes in patients with neuroendocrine tumors in the United States. JAMA Oncol. 2017;3(10):1335–1342. doi:10.1001/jamaoncol.2017.0589
- 121. Pasaoglu E, Dursun N, Ozyalvacli G, Hacihasanoglu E, Behzatoglu K, Calay O. Comparison of World Health Organization 2000/2004 and World Health Organization 2010 classifications for gastrointestinal and pancreatic neuroendocrine tumors. Ann Diagn Pathol. 2015;19(2):81–87. doi:10.1016/j.anndiagpath.2015.01.001
- 122. Caswell‐Jin JL, Sun LP, Munoz D, et al. Analysis of breast cancer mortality in the US—1975 to 2019. JAMA. 2024;331(3):233–241. doi:10.1001/jama.2023.25881
- 123. Tsodikov A, Gulati R, Heijnsdijk EAM, et al. Reconciling the effects of screening on prostate cancer mortality in the ERSPC and PLCO trials. Ann Intern Med. 2017;167(7):449–455. doi:10.7326/M16‐2586
- 124. American Cancer Society . Cancer Facts & Figures for Asian American, Native Hawaiian, & Other Pacific Islander People 2024–2026. American Cancer Society; 2024. Accessed August 1, 2024. https://www.cancer.org/content/dam/cancer‐org/research/cancer‐facts‐and‐statistics/aanhpi‐cancer‐facts‐and‐figures/aanhpi‐cff.pdf
- 125. Bailey ZD, Krieger N, Agenor M, Graves J, Linos N, Bassett MT. Structural racism and health inequities in the USA: evidence and interventions. Lancet. 2017;389(10077):1453–1463. doi:10.1016/S0140‐6736(17)30569‐X
- 126. Beyer KMM, Zhou Y, Laud PW, et al. Mortgage lending bias and breast cancer survival among older women in the United States. J Clin Oncol. 2021;39(25):2749–2757. doi:10.1200/JCO.21.00112
- 127. Bikomeye JC, Zhou Y, McGinley EL, et al. Historical redlining and breast cancer treatment and survival among older women in the United States. J Natl Cancer Inst. 2023;115(6):652–661. doi:10.1093/jnci/djad034
- 128. Collin LJ, Gaglioti AH, Beyer KMM, et al. Neighborhood‐level redlining and lending bias are associated with breast cancer mortality in a large and diverse metropolitan area. Cancer Epidemiol Biomarkers Prev. 2021;30(1):53–60. doi:10.1158/1055‐9965.EPI‐20‐1038
- 129. Krieger N, Wright E, Chen JT, Waterman PD, Huntley ER, Arcaya M. Cancer stage at diagnosis, historical redlining, and current neighborhood characteristics: breast, cervical, lung, and colorectal cancers, Massachusetts, 2001–2015. Am J Epidemiol. 2020;189(10):1065–1075. doi:10.1093/aje/kwaa045
- 130. Lynch EE, Malcoe LH, Laurent SE, Richardson J, Mitchell BC, Meier HCS. The legacy of structural racism: associations between historic redlining, current mortgage lending, and health. SSM Popul Health. 2021;14:100793. doi:10.1016/j.ssmph.2021.100793
- 131. Ward E, Jemal A, Cokkinides V, et al. Cancer disparities by race/ethnicity and socioeconomic status. CA Cancer J Clin. 2004;54(2):78–93. doi:10.3322/canjclin.54.2.78
- 132. Bach PB, Schrag D, Brawley OW, Galaznik A, Yakren S, Begg CB. Survival of Blacks and Whites after a cancer diagnosis. JAMA. 2002;287(16):2106–2113. doi:10.1001/jama.287.16.2106
- 133. Madrigal JM, Flory A, Fisher JA, et al. Sociodemographic inequities in the burden of carcinogenic industrial air emissions in the United States. J Natl Cancer Inst. 2024;116(5):737–744. doi:10.1093/jnci/djae001
- 134. Shrider EA, Creamer J. Poverty in the United States: 2022. Current Population Reports, P60‐280. United States Census Bureau; 2023.
- 135. Brady D, Kohler U, Zheng H. Novel estimates of mortality associated with poverty in the US. JAMA Intern Med. 2023;183(6):618–619. doi:10.1001/jamainternmed.2023.0276
- 136. Singh GK, Jemal A. Socioeconomic and racial/ethnic disparities in cancer mortality, incidence, and survival in the United States, 1950–2014: over six decades of changing patterns and widening inequalities. J Environ Public Health. 2017;2017:2819372. doi:10.1155/2017/2819372
- 137. Islami F, Guerra CE, Minihan A, et al. American Cancer Society's report on the status of cancer disparities in the United States, 2021. CA Cancer J Clin. 2022;72(2):112–143. doi:10.3322/caac.21703
- 138. Moss JL, Pinto CN, Srinivasan S, Cronin KA, Croyle RT. Enduring cancer disparities by persistent poverty, rurality, and race: 1990–1992 to 2014–2018. J Natl Cancer Inst. 2022;114(6):829–836. doi:10.1093/jnci/djac038
- 139. Boyle J, Yau J, Slade JL, et al. Neighborhood disadvantage and prostate tumor aggressiveness among African American and European American men. Cancer Epidemiol Biomarkers Prev. 2024;33(10):1318–1326. doi:10.1158/1055‐9965.EPI‐24‐0450
- 140. Xu X, Chen L, Nunez‐Smith M, Clark M, Wright JD. Racial disparities in diagnostic evaluation of uterine cancer among Medicaid beneficiaries. J Natl Cancer Inst. 2023;115(6):636–643. doi:10.1093/jnci/djad027
- 141. Ganguly AP, Baker KK, Redman MW, McClintock AH, Yung RL. Racial disparities in the screening mammography continuum within a heterogeneous health care system. Cancer. 2023;129(S19):3171–3181. doi:10.1002/cncr.34632
- 142. Lawson MB, Bissell MCS, Miglioretti DL, et al. Multilevel factors associated with time to biopsy after abnormal screening mammography results by race and ethnicity. JAMA Oncol. 2022;8(8):1115–1126. doi:10.1001/jamaoncol.2022.1990
- 143. Alagoz O, May FP, Doubeni CA, et al. Impact of racial disparities in follow‐up and quality of colonoscopy on colorectal cancer outcomes. J Natl Cancer Inst. Published online July 24, 2024. doi:10.1093/jnci/djae140
- 144. Baeker Bispo J, Bandi P, Jemal A, Islami F. Receipt of clinician recommendation for colorectal cancer screening among underscreened U.S. adults. Ann Intern Med. 2023;176(9):1985–1987. doi:10.7326/M23‐1341
- 145. Kurian AW, Abrahamse P, Furgal A, et al. Germline genetic testing after cancer diagnosis. JAMA. 2023;330(1):43–51. doi:10.1001/jama.2023.9526
- 146. LaVeist TA, Perez‐Stable EJ, Richard P, et al. The economic burden of racial, ethnic, and educational health inequities in the US. JAMA. 2023;329(19):1682–1692. doi:10.1001/jama.2023.5965
- 147. Nguyen BT, Han X, Jemal A, Drope J. Diet quality, risk factors and access to care among low‐income uninsured American adults in states expanding Medicaid vs. states not expanding under the Affordable Care Act. Prev Med. 2016;91:169–171. doi:10.1016/j.ypmed.2016.08.015
- 148. Sommers BD, Gawande AA, Baicker K. Health insurance coverage and health—what the recent evidence tells us. N Engl J Med. 2017;377(6):586–593. doi:10.1056/NEJMsb1706645
- 149. Falcaro M, Castañon A, Ndlela B, et al. The effects of the national HPV vaccination programme in England, UK, on cervical cancer and grade 3 cervical intraepithelial neoplasia incidence: a register‐based observational study. Lancet. 2021;398(10316):2084–2092. doi:10.1016/S0140‐6736(21)02178‐4
- 150. Kantarjian HM, Keating MJ, Freireich EJ. Toward the potential cure of leukemias in the next decade. Cancer. 2018;124(22):4301–4313. doi:10.1002/cncr.31669
- 151. Barr RD, Ferrari A, Ries L, Whelan J, Bleyer WA. Cancer in adolescents and young adults: a narrative review of the current status and a view of the future. JAMA Pediatr. 2016;170(5):495–501. doi:10.1001/jamapediatrics.2015.4689
- 152. Hammoud RA, Liu Q, Dixon SB, et al. The burden of cardiovascular disease and risk for subsequent major adverse cardiovascular events in survivors of childhood cancer: a prospective, longitudinal analysis from the St Jude Lifetime Cohort Study. Lancet Oncol. 2024;25(6):811–822. doi:10.1016/S1470‐2045(24)00157‐8
- 153. Kratzer TB, Star J, Minihan AK, et al. Cancer in people who identify as lesbian, gay, bisexual, transgender, queer, or gender‐nonconforming. Cancer. 2024;130(17):2948–2967.