Introduction
Hemorrhagic transformation (HT) is a complication following acute ischemic stroke (AIS) leading to poor outcomes and mortality []. HT is classified based on imaging and clinical deterioration. The European Cooperative Acute Stroke Study classified the radiological appearance of petechiae as hemorrhagic infarction (HI) and severe forms as parenchymal hematoma (PH) []. The National Institutes of Neurological Disorders and Stroke (NINDS), classified HT into asymptomatic HT, which is detected by computed tomography (CT) or magnetic resonance imaging (MRI) of the brain and symptomatic HT (sHT), characterized by clinical deterioration along with the imaging evidence []. At least 2–6% of the patients who undergo thrombolytic therapy are at risk of developing sHT, whereas in 20–40% patients HT will be asymptomatic []. It is known to be associated with neurological worsening in at least 20% of patients thereby increasing morbidity and mortality []. Several studies have shown that older age, hypertension, hyperglycemia, stroke severity, and cardioembolic etiology add up to the risk [, ].
The pathophysiology of HT in cerebral infarction involves the disruption of the blood-brain barrier resulting from ischemic reperfusion injury activated by free radicals and proteolytic enzymes []. Nevertheless, it is speculated that HI and PH follow slightly different pathophysiological pathways []. Although HI type-1 and HI type-2 are usually associated with good outcomes, both parenchymal hemorrhage type-1 and type-2 lead to worse outcomes and increased mortality in at least 3% of patients [].
Circulating biomarkers have the potential to identify patients at risk of developing HT which would benefit clinical decision-making or may pave the way for novel therapeutic strategies []. Their use may also have implications in the timing of resuming anticoagulation treatment. Several biomarkers have been investigated previously. However, the lack of uniformity in defining HT across studies and the dearth of evidence makes it difficult to appraise them. To date, none of these markers have been validated for clinical use; however, an evidence-based study may determine the diagnostic performance best suited as an adjunct to clinical and imaging variables for predicting HT. Hence, the present systematic review and meta-analysis aimed to assess the relationship between blood biomarkers and HT by evaluating the diagnostic accuracy to predict HT in AIS and its correlation with outcome.
Methods
We evaluated biomarkers according to the following outcome measures: (i) comparison of baseline levels of biomarkers in HT and non-HT patients, (ii) biomarker estimation among HT subtypes, (iii) association of biomarker levels in HT post-intervention, and (iv) functional outcome at 90 days from onset, using the modified Rankin scale. The study protocol was registered in the PROSPERO database (reg. no. CRD42020201334) and adhered to Preferred Reporting Items for Systematic Reviews and Meta-Analyses statement [].
Search Strategy
Search Criteria and Databases
The Cochrane Library (CENTRAL), MEDLINE using PubMed, and Web of Science were searched for eligible studies using keywords and search strings for articles published in English between 1 October 2000 and 30 November 2020 (online suppl. Appendix 1; see http://www.karger.com/doi/10.1159/000518570 for all online suppl. material).
Study Selection
Eligible studies were reviewed and data extraction was carried out by 2 authors (S.K. and J.J.K.). The author (P.N.S.) was approached in case of discrepancies and was finalized based on consensus. Title and abstract screening were followed by full-text screening.
Inclusion Criteria
The inclusion criteria were (i) full-text publications which included only original articles, in English, (ii) ≥18 years AIS patients, (iii) HT confirmed by CT or MRI scan of the brain, (iv) biomarkers measured in baseline blood samples, (v) samples collected <24 h from stroke onset, and (vi) availability of baseline CT/MRI and follow-up CT/MRI data.
Exclusion Criteria
Articles were excluded if they were (i) related to gene, genetic variants, gene expression, microRNA, or metabolomic studies, (ii) tissue biopsies, cerebrospinal fluid, or any other body fluids apart from the blood were investigated, (iii) insufficient information and diagnostic data, and (iv) studies using only cell lines and animal models.
Operational Definitions
We defined sHT as any patient with clinical deterioration within 48 h along with HI or PH on follow-up neuroimaging [] and asymptomatic HT as neuroimaging-documented bleeding without neurological deterioration []. We defined sICH as per the NINDS definition [].
Risk of Bias in Individual Studies
Risk of bias and applicability concerns were estimated using the Quality Assessment of Diagnostic Accuracy Score-2 tool comprising 4 domains based on the patient selection, index test, reference standard, and flow and timing []. Selected studies were assessed using the questions provided under the tool (online suppl. Appendix 2) []. We evaluated the methodological quality according to the statement: guidelines for reporting observational studies (STROBE) criteria [].
Statistical Analysis
Descriptive statistics for the studies included sensitivity, specificity, diagnostic odds ratio (DOR), false-positive rates, and likelihood ratios of individual studies. χ2 tests were performed for equality of sensitivities and specificities. Univariate analysis for pooled estimates of DORs was carried out using DerSimonian-Laird estimator. Cochran’s Q statistic was used to estimate variance parameters. The hierarchical bivariate model (linear mixed model with known variances of the random effects) was used to develop hierarchical summary receiver operator characteristic curves. Variance components are estimated by restricted maximum likelihood. The area under the curve, pooled sensitivity, and false positivity rates were calculated. Deeks’ funnel plots were prepared to estimate publication bias. Weighted regression with multiplicative dispersion model using standard error and sample size as predictors were used to determining funnel plot asymmetry statistically. The analysis was carried out using RevMan 5.0.3 and R version 4.0.2 (mada and metafor packages) software.
Results
Study Selection
Database search identified 2,230 results, of which, 2,175 articles were excluded as duplicates and by screening titles and abstracts not relevant to the review. Of the 55 articles that were selected for full-text review, 30 quality-appraised articles were found eligible. The flow diagram is shown in Figure 1.
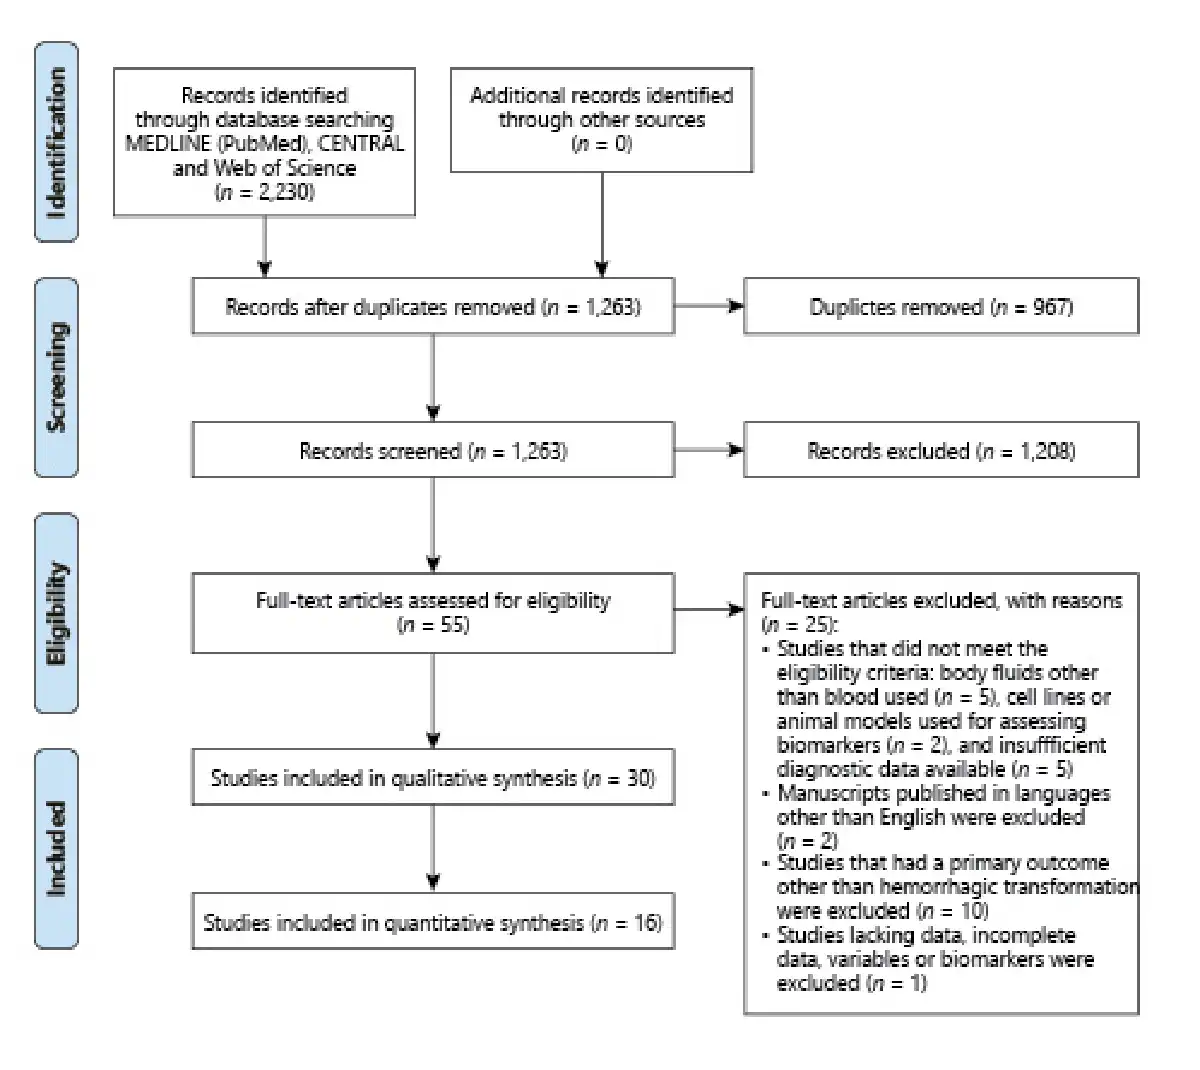
Fig. 1
PRISMA flow diagram outlining the process of study screening through final selection of articles. PRISMA, Preferred Reporting Items for Systematic Reviews and Meta-Analyses.
Study Characteristics
The total sample size of the eligible studies was 9,826. The baseline characteristics of the studies are given in Table 1.
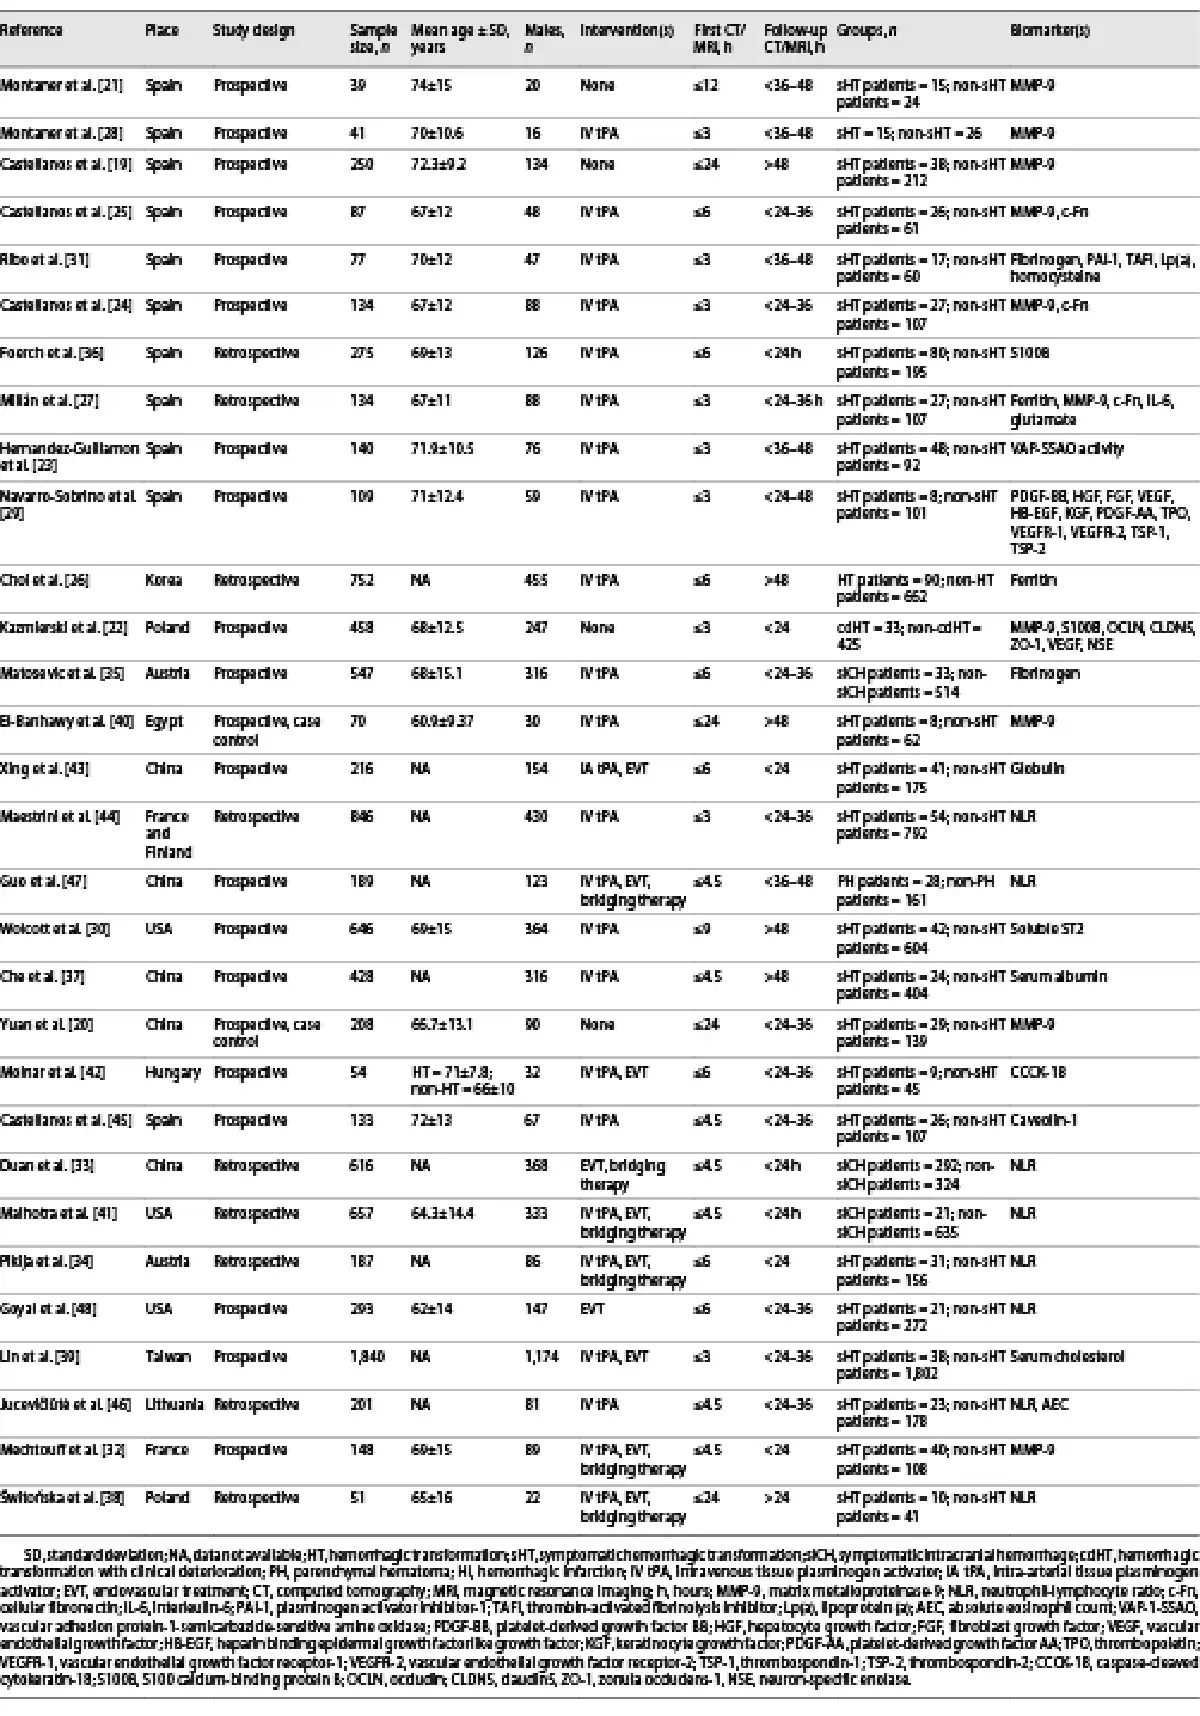
All studies recruited patients admitted within 24 h from stroke onset. Stroke etiology was determined by the Trial of Org 10,172 in Acute Stroke Treatment classification [] in eighteen studies [-]. One study only used the Oxfordshire Community for Stroke patients classification [] and one study used both Trial of Org 10,172 in Acute Stroke Treatment and Oxfordshire Community for Stroke patients classification []. Ten studies did not mention any specific classification for determining stroke etiology [-]. Stroke severity was assessed using the National Institutes of Health Stroke Scale score in all studies except for one [] which had used the Canadian Stroke Scale.
Apart from for 4 studies [-], all patients underwent interventions such as intravenous tissue plasminogen activator, endovascular treatment, or bridging therapy. One study included patients who received intra-arterial thrombolytic therapy [].
Assessment of HT varied across studies. Twenty-four studies [-, -, -] defined HT according to the European Cooperative Acute Stroke Study criteria, whereas 2 studies [, ] used the Heidelberg Bleeding Classification. Three studies [, , ] used the NINDS criteria. One study also used the Safe Implementation of Thrombolysis in Stroke-Monitoring Study criteria to define sICH []. One study assessed biomarker values in patients who developed early HT, that is, within 48 h from stroke onset compared to late HT detected 5–7 days from onset []. Cutoff values of biomarkers were determined in sixteen studies using ROC curve analysis. Sensitivity, specificity, positive predictive value, and negative predictive value (NPV) were examined in twenty studies. The remaining studies used prespecified thresholds as reference values for the markers.
Risk of Bias
Seventeen studies examined risk of bias, 2 studies included flow diagrams, 16 studies appropriately described their study population including details of missing data and patients lost during follow-up, and 20 studies disclosed funding details. The risk of bias and applicability of studies’ summary and graph for the included studies are shown in Figure 2 and online supplementary Appendix 2. The methodological quality of studies following the STROBE guidelines were given in online supplementary Appendix 3.
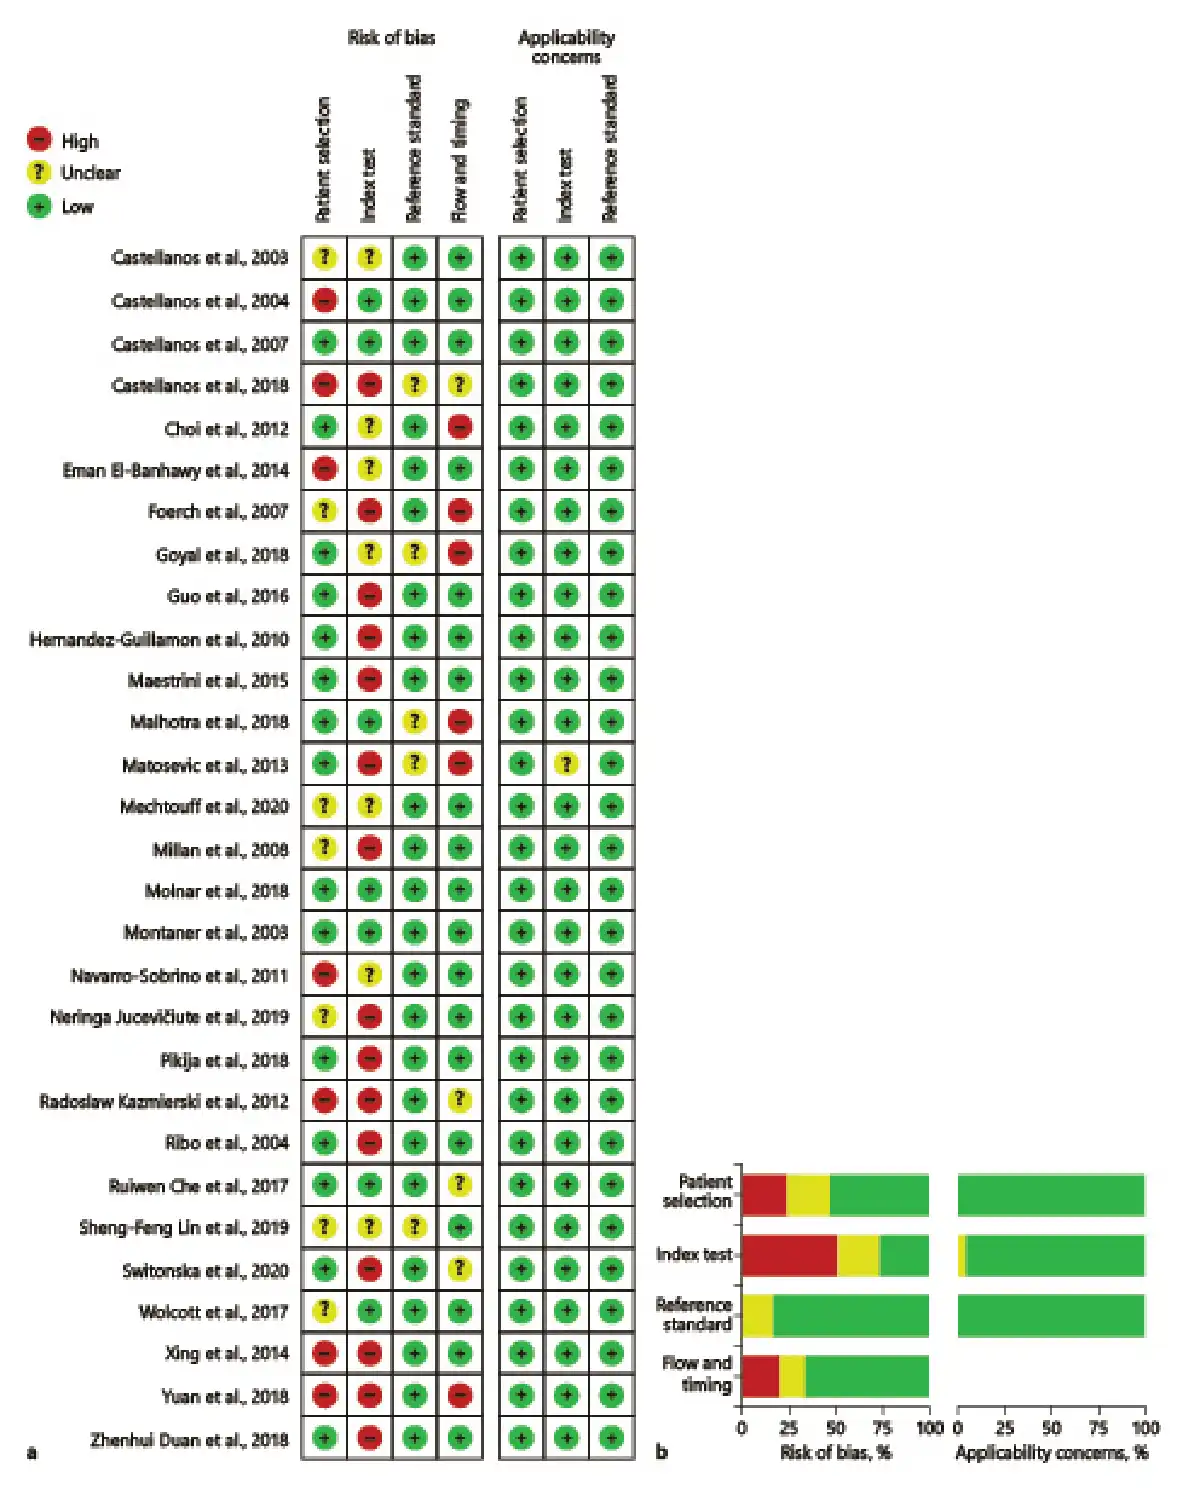
Fig. 2
Summary of the risk of biases using QUADAS-2 tool. a Risk of bias summary presenting the risk of bias items for each included study. b Risk of bias graph for all studies presented as percentages. QUADAS-2, Quality Assessment of Diagnostic Accuracy Score-2.
Biomarkers Included in the Meta-Analysis
Meta-analysis of matrix metalloproteinase-9 (MMP-9), cellular fibronectin (c-Fn), ferritin, S100 calcium-binding protein B (S100B) levels in sHT, and neutrophil-lymphocyte ratio (NLR) in sICH were conducted, respectively. Summary statistics for diagnostic accuracy parameters of included studies are provided in online supplementary Table 1. Forest plots of univariate analysis using DOR are shown in Figure 3. Forest plots for sensitivity and specificity are shown in Figure 4. SROC plot for 5 biomarkers using calculated hierarchical summary receiver operator characteristic parameters is shown in Figure 5
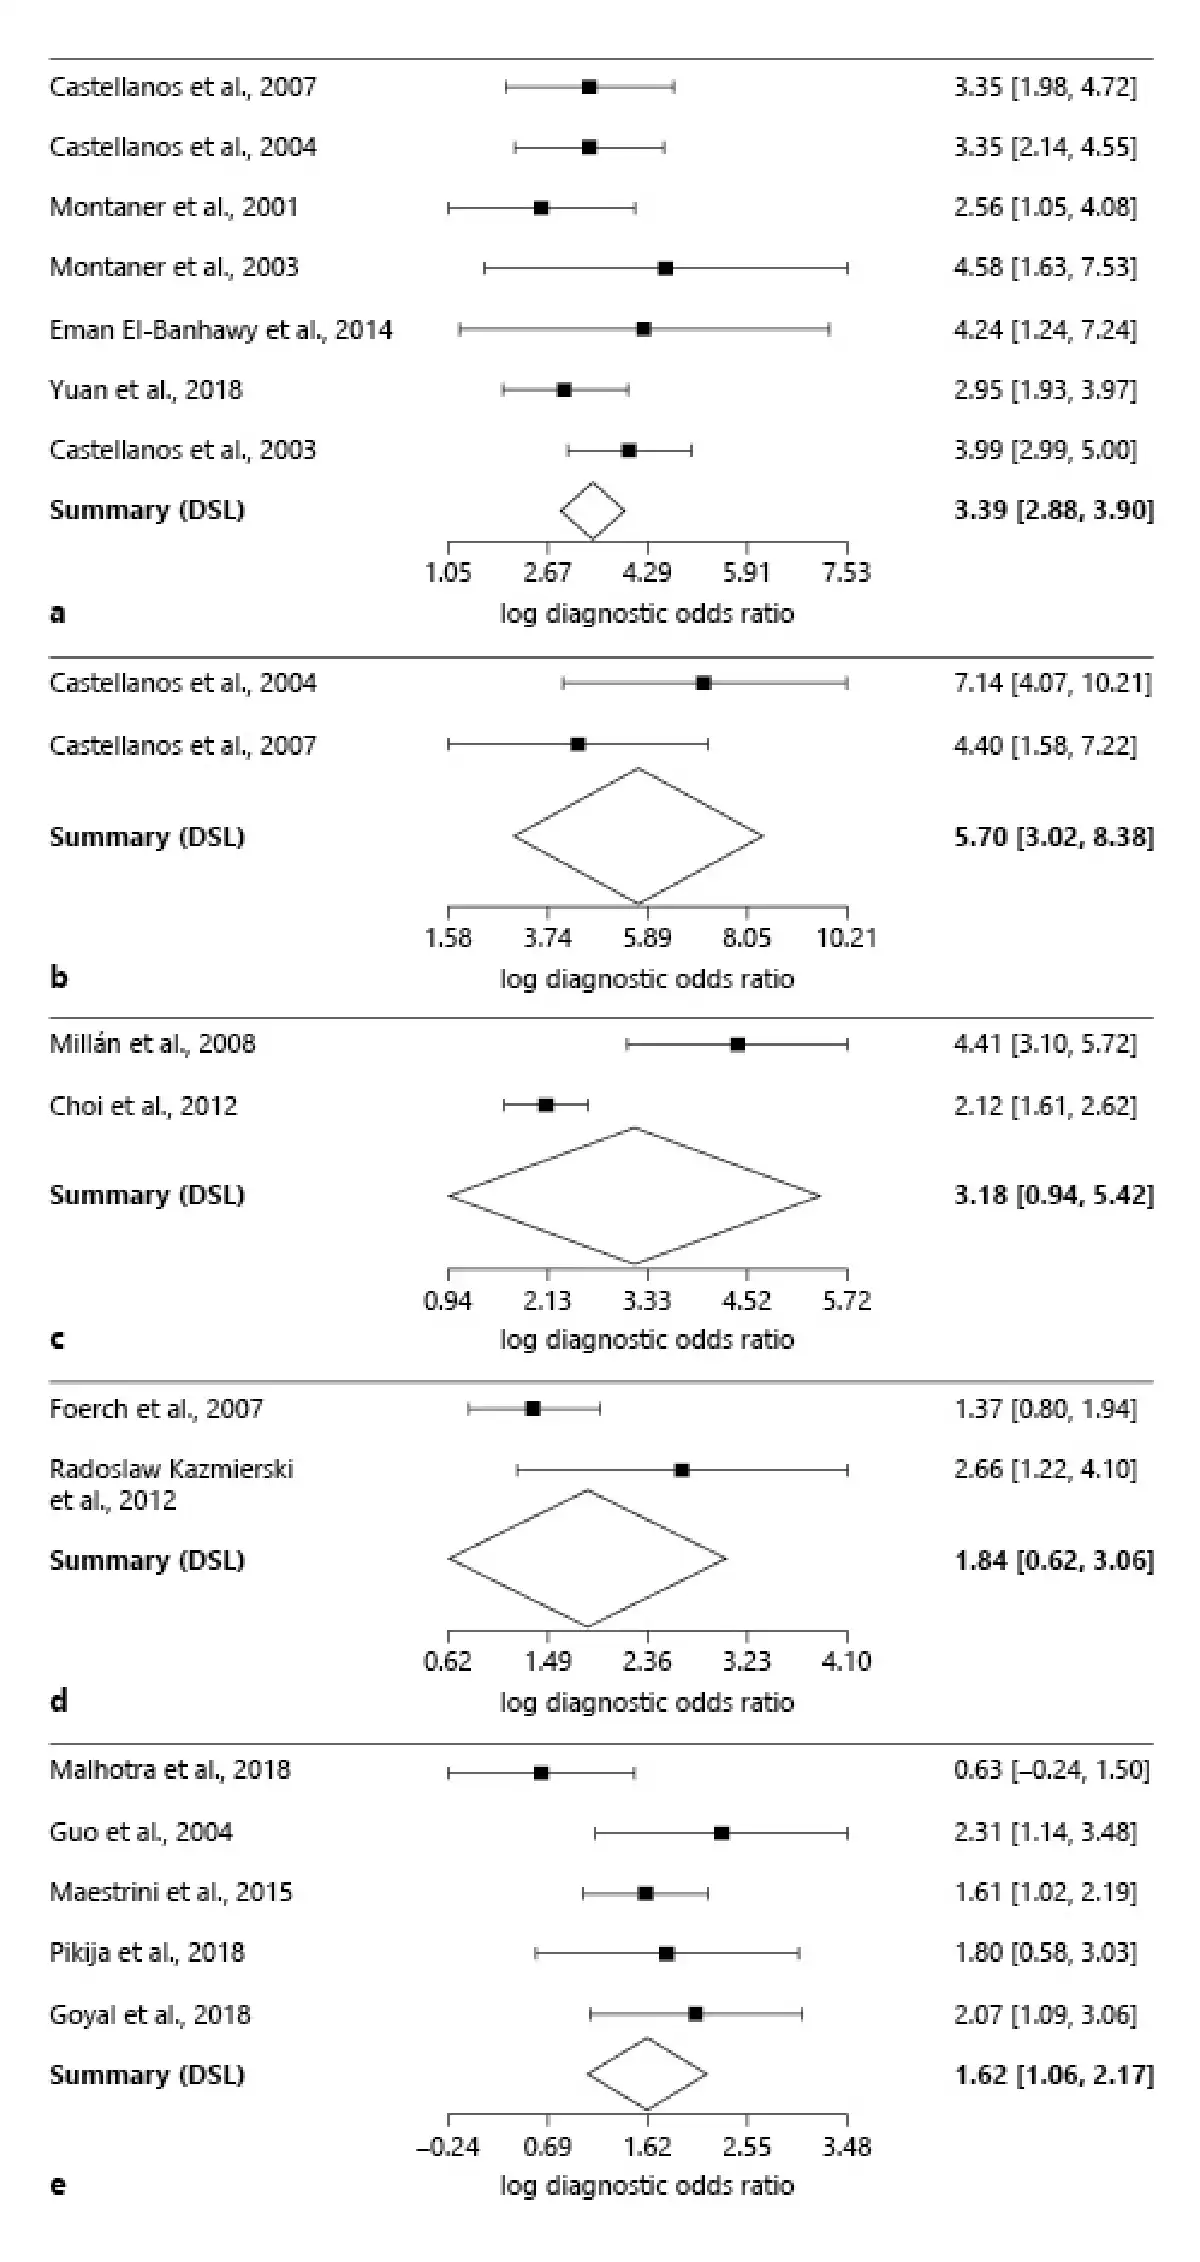
Fig. 3
Forest plots of univariate analysis using DORs of meta-analyzed studies: pooled DOR for MMP-9 (a), c-Fn (b), ferritin (c), S100B (d), and NLR (e). MMP-9, matrix metalloproteinase-9; c-Fn, cellular fibronectin; S100B, S100 calcium-binding protein B; NLR, neutrophil-lymphocyte ratio; DORs, diagnostic odds ratios.
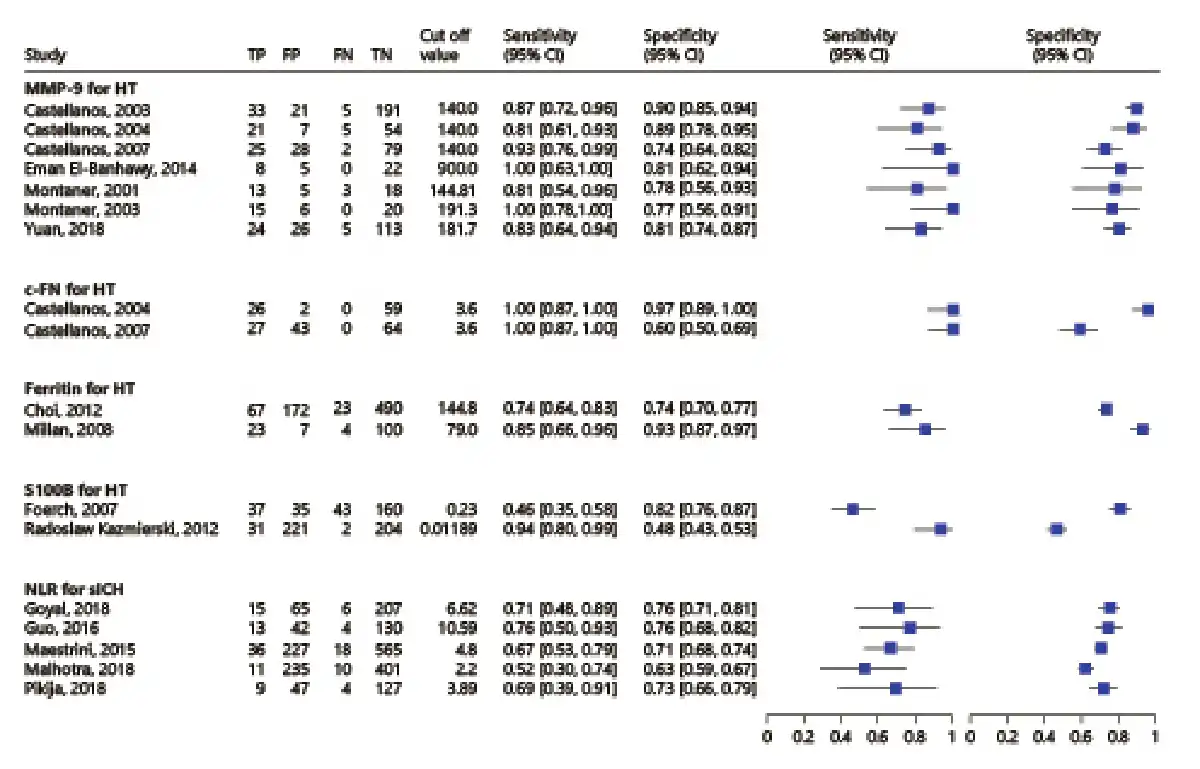
Fig. 4
Forest plots for sensitivities and specificities corresponding to the 5 biomarkers.
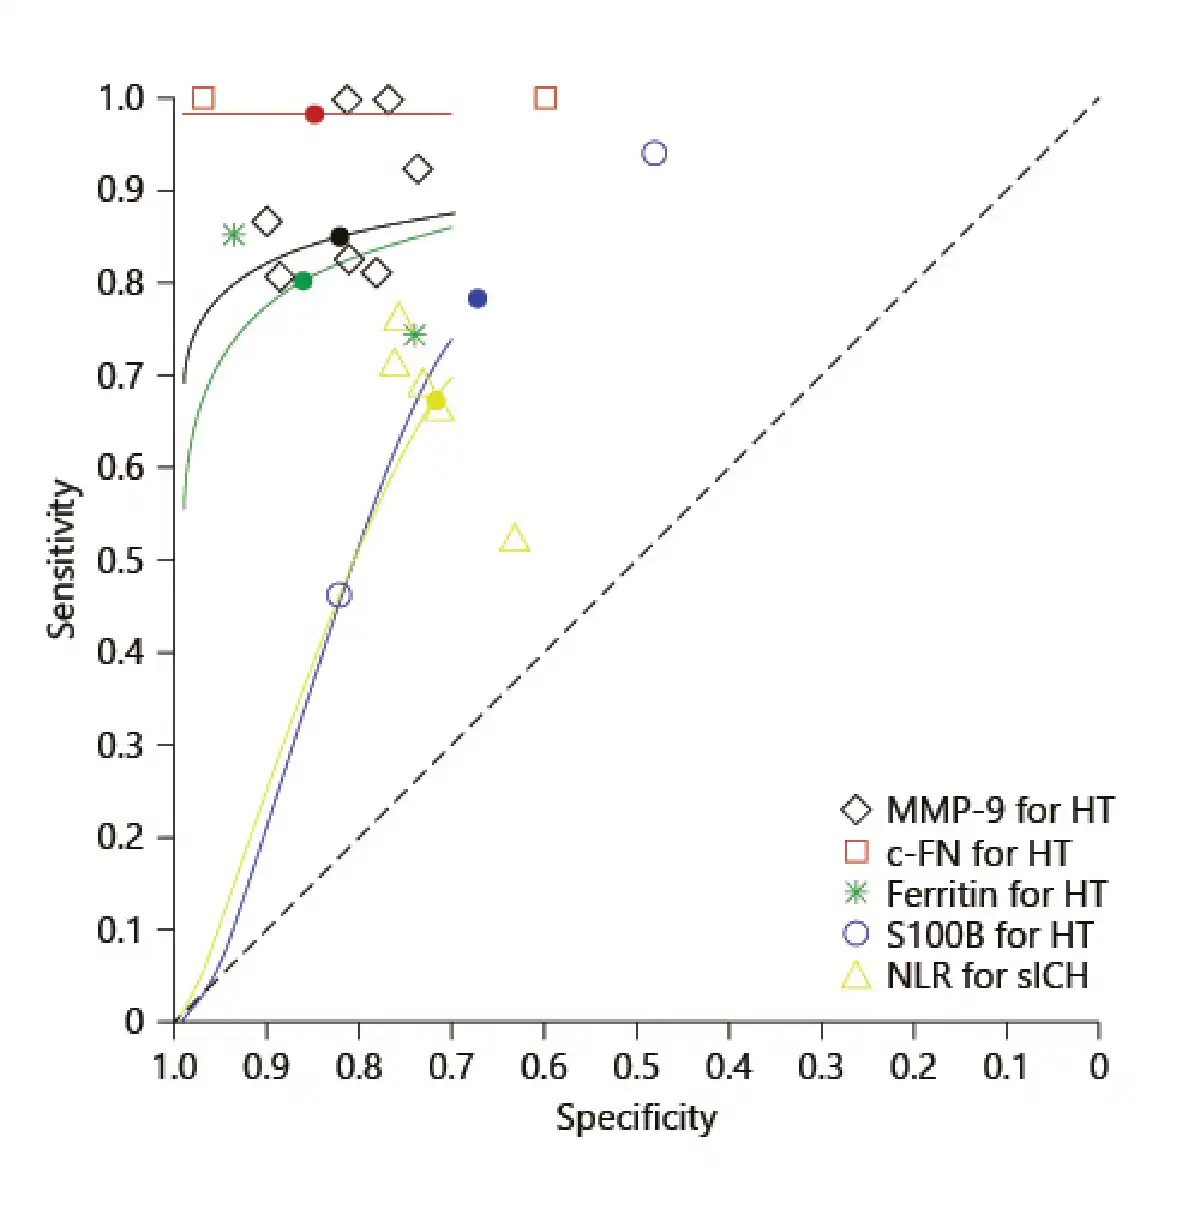
Fig. 5
SROC plot for the meta-analyzed biomarkers using calculated HSROC parameters. MMP-9, matrix metalloproteinase-9: lambda: 3.985; theta: 1.162; beta: 1.205; sigma2alpha: 0.000; sigma2theta: 0.043; c-Fn, cellular fibronectin: lambda: 34.708; theta: 17.156; beta: 4.316; sigma2alpha: 0.000; sigma2theta: 0.048; NLR, neutrophil-lymphocyte ratio: lambda: 1.709; theta: −0.258; beta: −0.367; sigma2alpha: 0.329; sigma2theta: 0.000; ferritin: lambda: 3.326; theta: 0.487; beta: 0.863; sigma2alpha: 2.067; sigma2theta: 0.000; S100B, S100 calcium-binding protein B: lambda: 1.910; theta: −0.004; beta: −0.592; sigma2alpha: 0.000; sigma2theta: 2.281; HSROC, hierarchical summary receiver operator characteristic.
Funnel plots to estimate publication bias is shown in online supplementary Figure 1. The regression test for funnel plot asymmetry found a lack of publication bias with standard error and sample size as predictors (p value of 0.5574 and 0.3119, respectively).
Matrix Metalloproteinase-9
Ten studies comprising 1,494 patients reported high baseline MMP-9 in sHT assessed by commercially available enzyme-linked immunosorbent assay kits. Three studies had serially measured MMP-9 levels at various timepoints [, , ].
Four studies [, , , ] reported a baseline cutoff >140 ng/mL yielding high sensitivity and specificity to predict sHT. Threshold levels >700 ng/mL were reported in 2 studies within 24 h of onset [, ]. Two studies reported no significant difference in the mean MMP-9 levels between nonthrombolysed patients with early HI and early PH [, ]. However, in patients receiving intravenous tissue plasminogen activator, a higher median baseline MMP-9 was observed in patients with PH. Two studies reported pretreatment levels ≥191.3 ng/mL to predict PH [, ]. One study reported MMP-9 to be significantly higher in patients with poor functional outcomes (p = 0.021) as compared to those with a modified Rankin scale <2 at 90 days from onset [].
Seven studies comprising 754 patients were included for the meta-analysis and the funnel plots to estimate publication bias. Elevated levels of MMP-9 were found to have a high accuracy for predicting PH (pooled DOR, 29.571 [95% CI 17.750–49.267]). Bivariate analysis (shown in Fig. 5) showed pooled sensitivity as 0.849 and the pooled false positivity rate to be 0.180.
Cellular Fibronectin
Three studies comprising 355 patients examined the correlation of c-Fn in sHT using commercial enzyme-linked immunosorbent assay [, , ]. All studies assessed c-Fn levels in patients who underwent thrombolysis.
Significant elevation of c-Fn was reported in post-thrombolysis patients with PH in all studies []. A cutoff ≥3.6 μg/mL yielded high sensitivity and NPV which when combined with MMP-9 (≥140 ng/mL), increased specificity and positive predictive value for predicting PH [].
Functional outcome positively correlated with c-Fn in one study (p = 0.010) []. Two studies [, ] with 221 patients were meta-analyzed. Pooled DOR was found to be highest for c-Fn (299.253 [95% CI, 20.508–4,366.709]), pooled sensitivity and the false positivity rate were 0.982 and 0.153, respectively.
Ferritin
Two studies comprising 886 patients evaluated ferritin in sHT using immunoassay techniques [, ]. Choi et al. [] evaluated ferritin levels within 48 h from onset, whereas Millán et al. [] serially measured the marker using 3 timepoints.
Baseline ferritin levels were increased in patients with PH and sHT (cutoff ≥144.8 ng/mL). Ferritin levels were the highest in patients with PH at 24 h from intervention []. Similarly, Choi et al. [] reported thresholds of ≥164.1 ng/mL to predict PH and ≥171.8 ng/mL to predict sHT with good sensitivity and specificity. Baseline ferritin levels were significantly elevated in patients who had poor outcomes (p < 0.001) [].
Both studies were included in the meta-analysis. Pooled DOR was 24.032 (95% CI 2.557–225.871), and pooled sensitivity and the false positivity rate were 0.802 and 0.140, respectively.
S100 Calcium-Binding Protein B
Two studies with 733 patients estimated baseline S100B in sHT using commercial immunoassays [, ]. Median S100B levels were elevated in patients with sHT with a threshold ≥0.23 μg/L predicting parenchymal hemorrhage type-2 []. S100B was significantly elevated in spontaneous HT than in non-HT (0.1002 μg/L vs. 0.01415 μg/L; p = 0.003) []. Meta-analysis revealed pooled DOR of 6.286 (95% CI 1.861–21.230), pooled sensitivity value of 0.782, and the false positivity rate of 0.32.
Neutrophil-Lymphocyte Ratio
Eight studies including 3,040 patients that estimated NLR from the complete blood count. All patients underwent thrombolytic intervention within 6 h from onset. One study [] additionally included 3 timepoints for NLR estimation.
Baseline NLR values were significantly associated with sICH in 4 studies [, , , ] and with sHT in one study [], post-revascularization. Thresholds varied across studies from 2.2, being the lowest cutoff value to 10.59, being the highest. No association was reported between baseline NLR and HT subtypes in 3 studies [, , ]. Guo et al. [] reported no correlation between baseline NLR and sICH; however, the maximum peak was attained at 12–18 h post-revascularization.
Four studies reported baseline NLR to be significantly associated with poor outcomes [, , , ] with a higher mortality rate in patients with baseline NLR ≥7 []. Five studies comprising 2,172 patients were included for the meta-analysis (shown in Fig. 3). Pooled DOR for baseline NLR was 5.036 (95% CI 2.898–8.749) predicting sICH in patients who underwent revascularization (pooled sensitivity – 0.672 and pooled false positivity rate – 0.284).
Biomarkers Not Included in the Meta-Analysis
A forest plot could not be synthesized for biomarkers in fourteen studies due to insufficient data or reporting in a single study. Among single studies, caveolin-1 (99% NPV and 86% sensitivity) [], soluble ST2 (area under the curve = 0.747) [], and a combination of thrombin-activated fibrinolysis inhibitor and plasminogen activator inhibitor-1 (97.6% specificity, 97% NPV) [] were found to be independent predictors of sHT.
Discussion
Our meta-analysis included 5 biomarkers, namely, MMP-9, c-Fn, ferritin, and S100B, associated with sHT and NLR with sICH, respectively. MMP-9, which was commonly investigated and evaluated before thrombolysis, increased within 6–8 h after ischemia and was higher in patients who developed sHT, specifically, the PH subtype [, ]. Our meta-analysis showed that patients with MMP-9 levels ≥140 ng/mL had 29.5 times higher risk of developing sHT after stroke. SROC plot comparing the performance of all 5 biomarkers showed a high pooled sensitivity and a low false positivity rate for MMP-9, consistent with previous findings [, ], signifying MMP-9 with higher discriminating ability for predicting sHT risk. In our analysis, the highest sensitivity was obtained for c-Fn and ferritin. In the studies reviewed, serum levels of both markers correlated with each other as well as with MMP-9 levels at 24 h from onset in sHT patients [, ] However, both c-Fn and ferritin generated wide confidence intervals in our meta-analysis thereby affecting their reliability in sHT prediction.
Our meta-analysis found both S100B and NLR to yield low pooled sensitivities and S100B with the highest false-positive rate. We speculate that the low sensitivity of S100B may be attributed to the heterogeneity in the HT subtypes between the 2 studies.
We also reviewed the correlation of markers with short-term outcome, which is closely linked to HT. Baseline levels of MMP-9, ferritin, and NLR were associated with the poor outcome. We found that NLR weakly correlated with sICH indicating low discriminative ability as compared to other markers. Further evaluation may be required for potential biomarkers, caveolin-1, thrombin-activated fibrinolysis inhibitor, plasminogen activator inhibitor-1, and soluble ST2 reported in single studies.
The strengths of our review were the availability of individual studies with at least 2 well-studied biomarkers such as MMP-9 and NLR. However, some limitations may affect our findings. Heterogeneity in the patient population, timing of blood samples, whether plasma or serum was used, commercial assay kits, and the reporting of HT subtypes may explain the varying thresholds of MMP-9 and NLR across studies. The pooled analysis conducted in the present study was based on random effects model due to the presence of heterogeneity in cutoff values and varied techniques used as shown in Figure 4. Though heterogeneity is a known feature in diagnostic test accuracy studies, large sample studies are recommended to ascertain diagnostic test accuracies of multiple biomarkers. Also, the pooled analysis of c-Fn and ferritin in the present study were limited due to the availability of only 2 studies for each marker among the included studies. Moreover, some studies did not exclude patients with prior infections, anticoagulant, and antithrombotic use which may influence the severity and frequency of HT and its subtypes. Finally, most of the included studies followed a monocentric design which may limit the generalization of our findings.
In conclusion, MMP-9 was found to be a sensitive and specific marker for predicting the risk of sHT with high diagnostic accuracy, particularly for severe forms of HT in AIS patients. Baseline levels of MMP-9, ferritin, and NLR also predicted poor short-term outcome.
Acknowledgements
We would like to thank all authors who helped in providing us with the data required for the analysis and for their valuable suggestions.
Statement of Ethics
An ethics statement is not applicable because this study is based exclusively on the published literature.
Conflict of Interest Statement
The authors have no conflicts of interest to declare.
Funding Sources
No funding was obtained.
Author Contributions
P.N.S., S.K, and B.S. conceived and designed the study; S.K. and J.J.K. performed search of the data; S.K. and G.S. conducted the systematic review and meta-analysis; P.N.S. and S.K drafted and critically revised the manuscript. Final approval of the version to be published was given by C.F., W.T.K., M.M., M.Ś., I.M., R.B., K.M., and L.M.
Data Availability Statement
All data generated or analyzed during this study are included in this article and its online supplementary files. Further enquiries can be directed to the corresponding author.
References
- 1. Yaghi S, Willey JZ, Cucchiara B, Goldstein JN, Gonzales NR, Khatri P, et al. Treatment and outcome of hemorrhagic transformation after intravenous alteplase in acute ischemic atroke: a scientific statement for healthcare professionals from the American Heart Association/American Stroke Association. Stroke. 2017 Dec;48(12):e343–61. http://dx.doi.org/10.1161/STR.0000000000000152.
- 2. Diedler J, Ahmed N, Sykora M, Uyttenboogaart M, Overgaard K, Luijckx GJ, et al. Safety of intravenous thrombolysis for acute ischemic stroke in patients receiving antiplatelet therapy at stroke onset. Stroke. 2010 Feb;41(2):288–94. http://dx.doi.org/10.1161/STROKEAHA.109.559724.
- 3. Khatri P, Wechsler LR, Broderick JP. Intracranial hemorrhage associated with revascularization therapies. Stroke. 2007 Feb;38(2):431–40. http://dx.doi.org/10.1161/01.STR.0000254524.23708.c9.
- 4. de Andrade JBC, Mohr JP, Lima FO, Carvalho JJF, de Farias VAE, Oliveira-Filho J, et al. Predicting hemorrhagic transformation in patients not submitted to reperfusion therapies. J Stroke Cerebrovasc Dis. 2020 Aug;29(8):104940. http://dx.doi.org/10.1016/j.jstrokecerebrovasdis.2020.104940.
- 5. Álvarez-Sabín J, Maisterra O, Santamarina E, Kase CS. Factors influencing haemorrhagic transformation in ischaemic stroke. Lancet Neurol. 2013 Jul;12(7):689–705. http://dx.doi.org/10.1016/S1474-4422(13)70055-3.
- 6. Jensen M, Schlemm E, Cheng B, Lettow I, Quandt F, Boutitie F, et al. Clinical characteristics and outcome of patients with hemorrhagic transformation after intravenous thrombolysis in the WAKE-UP trial. Front Neurol. 2020 Aug 28;11:957. http://dx.doi.org/10.3389/fneur.2020.00957.
- 7. Arba F, Rinaldi C, Caimano D, Vit F, Busto G, Fainardi E. Blood-brain barrier disruption and hemorrhagic transformation in acute ischemic stroke: systematic review and meta-analysis. Front Neurol. 2020 Jan 21;11:594613. http://dx.doi.org/10.3389/fneur.2020.594613.
- 8. Jickling GC, Liu D, Stamova B, Ander BP, Zhan X, Lu A, et al. Hemorrhagic transformation after ischemic stroke in animals and humans. J Cereb Blood Flow Metab. 2014 Feb;34(2):185–99. http://dx.doi.org/10.1038/jcbfm.2013.203.
- 9. Paciaroni M, Agnelli G, Corea F, Ageno W, Alberti A, Lanari A, et al. Early hemorrhagic transformation of brain infarction: rate, predictive factors, and influence on clinical outcome: results of a prospective multicenter study. Stroke. 2008 Aug;39(8):2249–56. http://dx.doi.org/10.1161/STROKEAHA.107.510321.
- 10. Jickling GC, Manolescu BN. Breaking down barriers to identify hemorrhagic transformation in ischemic stroke. Neurology. 2012 Oct 16;79(16):1632–3. http://dx.doi.org/10.1212/WNL.0b013e31826e9b9d.
- 11. Moher D, Liberati A, Tetzlaff J, Altman DGPrisma Group. Preferred reporting items for systematic reviews and meta-analyses: the PRISMA statement. BMJ. 2009 Jul 21;339(7):b2535. http://dx.doi.org/10.1136/bmj.b2535.
- 12. Andrade JBC, Mohr JP, Lima FO, de Carvalho JJF, Barros LCM, Nepomuceno CR, et al. The role of hemorrhagic transformation in acute ischemic stroke upon clinical complications and outcomes. J Stroke Cerebrovasc Dis. 2020 Aug;29(8):104898. http://dx.doi.org/10.1016/j.jstrokecerebrovasdis.2020.104898.
- 13. Berger C, Fiorelli M, Steiner T, Schäbitz WR, Bozzao L, Bluhmki E, et al. Hemorrhagic transformation of ischemic brain tissue: asymptomatic or symptomatic?Stroke. 2001 Jun;32(6):1330–5. http://dx.doi.org/10.1161/01.str.32.6.1330.
- 14. National Institute of Neurological Disorders and Stroke rt-PA Stroke Study Group. Tissue plasminogen activator for acute ischemic stroke. N Engl J Med. 1995 Dec 14;333(24):1581–7. http://dx.doi.org/10.1056/NEJM199512143332401.
- 15. Whiting PF, Weswood ME, Rutjes AW, Reitsma JB, Bossuyt PN, Kleijnen J. Evaluation of QUADAS, a tool for the quality assessment of diagnostic accuracy studies. BMC Med Res Methodol. 2006 Mar 6;6:9. http://dx.doi.org/10.1186/1471-2288-6-9.
- 16. Bristol Medical School: Population Health Sciences University of Bristol [Internet]. Bristol: QUADAS-2. [cited 2020 Jun 7]. https://www.bristol.ac.uk/population-health-sciences/projects/quadas/quadas-2.
- 17. Von Elm E, Altman DG, Egger M, Pocock SJ, Gøtzsche PC, Vandenbroucke JP, et al. The Strengthening the Reporting of Observational Studies in Epidemiology (STROBE) statement: guidelines for reporting observational studies. Int J Surg. 2014 Dec 1;12(12):1495–9. http://dx.doi.org/10.1016/j.ijsu.2014.07.013.
- 18. Adams HP Jr, Bendixen BH, Kappelle LJ, Biller J, Love BB, Gordon DL, et al. Classification of subtype of acute ischemic stroke. Definitions for use in a multicenter clinical trial. TOAST. Trial of Org 10172 in acute stroke treatment. Stroke. 1993 Jan;24(1):35–41. http://dx.doi.org/10.1161/01.str.24.1.35.
- 19. Castellanos M, Leira R, Serena J, Pumar JM, Lizasoain I, Castillo J, et al. Plasma metalloproteinase-9 concentration predicts hemorrhagic transformation in acute ischemic stroke. Stroke. 2003 Jan;34(1):40–6. http://dx.doi.org/10.1161/01.str.0000046764.57344.31.
- 20. Yuan R, Tan S, Wang D, Wu S, Cao X, Zhang S, et al. Predictive value of plasma matrix metalloproteinase-9 concentrations for spontaneous haemorrhagic transformation in patients with acute ischaemic stroke: a cohort study in Chinese patients. J Clin Neurosci. 2018 Dec;58:108–12. http://dx.doi.org/10.1016/j.jocn.2018.09.014.
- 21. Montaner J, Alvarez-Sabín J, Molina CA, Anglés A, Abilleira S, Arenillas J, et al. Matrix metalloproteinase expression is related to hemorrhagic transformation after cardioembolic stroke. Stroke. 2001 Dec 1;32(12):2762–7. http://dx.doi.org/10.1161/hs1201.99512.
- 22. Kazmierski R, Michalak S, Wencel-Warot A, Nowinski WL. Serum tight-junction proteins predict hemorrhagic transformation in ischemic stroke patients. Neurology. 2012 Oct 16;79(16):1677–85. http://dx.doi.org/10.1212/WNL.0b013e31826e9a83.
- 23. Hernandez-Guillamon M, Garcia-Bonilla L, Solé M, Sosti V, Parés M, Campos M, et al. Plasma VAP-1/SSAO activity predicts intracranial hemorrhages and adverse neurological outcome after tissue plasminogen activator treatment in stroke. Stroke. 2010 Jul;41(7):1528–35. http://dx.doi.org/10.1161/STROKEAHA.110.584623.
- 24. Castellanos M, Sobrino T, Millán M, García M, Arenillas J, Nombela F, et al. Serum cellular fibronectin and matrix metalloproteinase-9 as screening biomarkers for the prediction of parenchymal hematoma after thrombolytic therapy in acute ischemic stroke: a multicenter confirmatory study. Stroke. 2007 Jun;38(6):1855–9. http://dx.doi.org/10.1161/STROKEAHA.106.481556.
- 25. Castellanos M, Leira R, Serena J, Blanco M, Pedraza S, Castillo J, et al. Plasma cellular-fibronectin concentration predicts hemorrhagic transformation after thrombolytic therapy in acute ischemic stroke. Stroke. 2004 Jul;35(7):1671–6. http://dx.doi.org/10.1161/01.STR.0000131656.47979.39.
- 26. Choi KH, Park MS, Kim JT, Nam TS, Choi SM, Kim BC, et al. The serum ferritin level is an important predictor of hemorrhagic transformation in acute ischaemic stroke. Eur J Neurol. 2012 Apr;19(4):570–7. http://dx.doi.org/10.1111/j.1468-1331.2011.03564.x.
- 27. Millán M, Sobrino T, Arenillas JF, Rodríguez-Yáñez M, García M, Nombela F, et al. Biological signatures of brain damage associated with high serum ferritin levels in patients with acute ischemic stroke and thrombolytic treatment. Dis Markers. 2008;25(3):181–8. http://dx.doi.org/10.1155/2008/380356.
- 28. Montaner J, Molina CA, Monasterio J, Abilleira S, Arenillas JF, Ribó M, et al. Matrix metalloproteinase-9 pretreatment level predicts intracranial hemorrhagic complications after thrombolysis in human stroke. Circulation. 2003 Feb 4;107(4):598–603. http://dx.doi.org/10.1161/01.cir.0000046451.38849.90.
- 29. Navarro-Sobrino M, Rosell A, Hernández-Guillamon M, Penalba A, Boada C, Domingues-Montanari S, et al. A large screening of angiogenesis biomarkers and their association with neurological outcome after ischemic stroke. Atherosclerosis. 2011 May;216(1):205–11. http://dx.doi.org/10.1016/j.atherosclerosis.2011.01.030.
- 30. Wolcott Z, Batra A, Bevers MB, Sastre C, Khoury J, Sperling M, et al. Soluble ST2 predicts outcome and hemorrhagic transformation after acute stroke. Ann Clin Transl Neurol. 2017 Jul 5;4(8):553–63. http://dx.doi.org/10.1002/acn3.435.
- 31. Ribo M, Montaner J, Molina CA, Arenillas JF, Santamarina E, Quintana M, et al. Admission fibrinolytic profile is associated with symptomatic hemorrhagic transformation in stroke patients treated with tissue plasminogen activator. Stroke. 2004 Sep;35(9):2123–7. http://dx.doi.org/10.1161/01.STR.0000137608.73660.4c.
- 32. Mechtouff L, Bochaton T, Paccalet A, Crola Da Silva C, Buisson M, Amaz C, et al. Matrix metalloproteinase-9 relationship with infarct growth and hemorrhagic transformation in the era of thrombectomy. Front Neurol. 2020 Jun 9;11:473. http://dx.doi.org/10.3389/fneur.2020.00473.
- 33. Duan Z, Wang H, Wang Z, Hao Y, Zi W, Yang D, et alACTUAL Investigators. Neutrophil-lymphocyte ratio predicts functional and safety outcomes after endovascular treatment for acute ischemic stroke. Cerebrovasc Dis. 2018;45(5–6):221–7.
- 34. Pikija S, Sztriha LK, Killer-Oberpfalzer M, Weymayr F, Hecker C, Ramesmayer C, et al. Neutrophil to lymphocyte ratio predicts intracranial hemorrhage after endovascular thrombectomy in acute ischemic stroke. J Neuroinflammation. 2018 Nov 15;15(1):319. http://dx.doi.org/10.1186/s12974-018-1359-2.
- 35. Matosevic B, Knoflach M, Werner P, Pechlaner R, Zangerle A, Ruecker M, et al. Fibrinogen degradation coagulopathy and bleeding complications after stroke thrombolysis. Neurology. 2013 Mar 26;80(13):1216–24. http://dx.doi.org/10.1212/WNL.0b013e3182897015.
- 36. Foerch C, Wunderlich MT, Dvorak F, Humpich M, Kahles T, Goertler M, et al. Elevated serum S100B levels indicate a higher risk of hemorrhagic transformation after thrombolytic therapy in acute stroke. Stroke. 2007 Sep;38(9):2491–5. http://dx.doi.org/10.1161/STROKEAHA.106.480111.
- 37. Che R, Huang X, Zhao W, Jiang F, Wu L, Zhang Z, et al. Low serum albumin level as a predictor of hemorrhage transformation after intravenous thrombolysis in ischemic stroke patients. Sci Rep. 2017 Aug 10;7(1):7776. http://dx.doi.org/10.1038/s41598-017-06802-y.
- 38. Świtońska M, Piekuś-Słomka N, Słomka A, Sokal P, Żekanowska E, Lattanzi S. Neutrophil-to-lymphocyte ratio and symptomatic hemorrhagic transformation in ischemic stroke patients undergoing revascularization. Brain Sci. 2020 Oct 23;10(11):771.
- 39. Lin SF, Chao AC, Hu HH, Lin RT, Chen CH, Chan L, et alTaiwan Thrombolytic Therapy for Acute Ischemic Stroke (TTT-AIS) Study Group. Low cholesterol levels increase symptomatic intracranial hemorrhage rates after intravenous thrombolysis: a multicenter cohort validation study. J Atheroscler Thromb. 2019 Jun 1;26(6):513–27.
- 40. El-Banhawy E, Amer H, Younes K, Nada MA, Helmy H, Hassan MI. Plasma matrix metalloproteinase-9 (MMP-9) and hemorrhagic transformation in acute ischemic stroke. Egypt J Neurol Psychiat Neurosurg. 2014 Apr 1;51:159–66.
- 41. Malhotra K, Goyal N, Chang JJ, Broce M, Pandhi A, Kerro A, et al. Differential leukocyte counts on admission predict outcomes in patients with acute ischaemic stroke treated with intravenous thrombolysis. Eur J Neurol. 2018 Dec;25(12):1417–24. http://dx.doi.org/10.1111/ene.13741.
- 42. Molnar T, Borocz K, Berki T, Szapary L, Szolics A, Janszky J, et al. Subacute elevation of plasma level of caspase-cleaved cytokeratin-18 is associated with hemorrhagic transformation and functional outcome in ischemic stroke. J Stroke Cerebrovasc Dis. 2019 Mar;28(3):719–27. http://dx.doi.org/10.1016/j.jstrokecerebrovasdis.2018.11.015.
- 43. Xing Y, Guo ZN, Yan S, Jin H, Wang S, Yang Y. Increased globulin and its association with hemorrhagic transformation in patients receiving intra-arterial thrombolysis therapy. Neurosci Bull. 2014 Jun;30(3):469–76. http://dx.doi.org/10.1007/s12264-013-1440-x.
- 44. Maestrini I, Strbian D, Gautier S, Haapaniemi E, Moulin S, Sairanen T, et al. Higher neutrophil counts before thrombolysis for cerebral ischemia predict worse outcomes. Neurology. 2015 Oct 20;85(16):1408–16. http://dx.doi.org/10.1212/WNL.0000000000002029.
- 45. Castellanos M, van Eendenburg C, Gubern C, Kádár E, Huguet G, Puig J, et al. Low levels of caveolin-1 predict symptomatic bleeding after thrombolytic therapy in patients with acute ischemic stroke. Stroke. 2018 Jun;49(6):1525–7. http://dx.doi.org/10.1161/STROKEAHA.118.020683.
- 46. Jucevičiūtė N, Mikužis P, Balnytė R. Absolute blood eosinophil count could be a potential biomarker for predicting haemorrhagic transformation after intravenous thrombolysis for acute ischaemic stroke. BMC Neurol. 2019 Jun 13;19(1):127.
- 47. Guo Z, Yu S, Xiao L, Chen X, Ye R, Zheng P, et al. Dynamic change of neutrophil to lymphocyte ratio and hemorrhagic transformation after thrombolysis in stroke. J Neuroinflammation. 2016 Aug 26;13(1):199. http://dx.doi.org/10.1186/s12974-016-0680-x.
- 48. Goyal N, Tsivgoulis G, Chang JJ, Malhotra K, Pandhi A, Ishfaq MF, et al. Admission neutrophil-to-lymphocyte ratio as a prognostic biomarker of outcomes in large vessel occlusion strokes. Stroke. 2018 Aug;49(8):1985–7. http://dx.doi.org/10.1161/STROKEAHA.118.021477.