Plastic pollution has become a major environmental issue in recent decades (; ). Based on a global analysis, 19 to 23 million metric tons (11%) of plastic waste generated globally in 2016 entered aquatic ecosystems, and this amount could reach 53 million metric tons per year by 2030 if the global community does not invest extra efforts in plastic waste reduction (). The threat of plastic pollution to aquatic ecosystems has been aggravated by the COVID-19 pandemic due to the higher demand for single-use plastic items (e.g., plastic cutlery). Given the unexpected increase in global plastic consumption and budget cuts on recycling programs in 2020 (; ; ; ), a higher amount of plastic waste is expected to enter the ocean and further threaten the aquatic ecosystems.
Plastic materials have a slow rate of degradation, making them difficult to break down in the marine environment (). As plastic debris accumulates in the ocean, it causes disastrous impacts on the marine ecosystem (; ; ). Marine mammals can be entangled in plastic debris, limiting their ability to catch food and avoid predators, which leads to their death. Another major negative impact is ingestion of plastic debris, which can cause blockages of the intestinal tract, reduction of food consumption, and failure to reproduce in marine mammals (; ; ). A recent study found that marine zooplankton, near the bottom of marine food webs, are mistakenly ingesting microplastics for food (). Absorbing plastic debris by species at lower levels in the food chain can transfer microplastic to higher levels, which can eventually affect human health ().
Given the deleterious impacts of plastic debris in the marine environment, the current paper aims to reduce overall plastic waste disposed in bins. To approach this issue, several strategies have been developed in the past literature to either reduce initial plastic consumption or recycle plastic waste after initial consumption. A modeling analysis shows that interventions focusing on reducing the demand for plastic products can decrease annual plastic pollution by 59% in 2040 relative to business as usual (). There are at least four common approaches to single-use plastics reduction: educating the public about the adverse impacts of plastic pollution (e.g., ; ), banning the use of specific plastic items (; ), incentivizing recycling with a deposit/refund program (; ), and imposing an economic cost to discourage the use of single-use plastic products (; ). Although these approaches have been applied broadly, implementing a small cost to promote pro-environmental behavior has gained considerable interest in the public sector in the last decade. For example, many municipalities in the world have adopted an economic policy by introducing a small fee (e.g., 10 cents) on plastic bags to reduce their consumption at grocery stores (see, e.g., ; ; ).
A recent development on behavior change is nudging, which involves small changes in the environment to alter human behavior in predictable ways (). Unlike the previous approaches, a nudge does not prohibit the freedom of choice, or significantly change the incentive structure. In the context of plastic waste reduction, a prominent nudge is default, which involves changing the default method of providing plastic straws from self-serve dispensers on the table in restaurants to only providing the straws when customers request them. In a recent study, a change in default decreased the consumption of plastic straws by 40% (). Another nudge is the use of social norms where messages conveying descriptive social norms have effectively and consistently increased pro-environmental behaviors (e.g., ; ).
Given the effectiveness of nudges in promoting pro-environmental behaviors, here we propose a behavioral solution to reduce the disposal of single-use plastic items. Specifically, we propose that visualizing marine consequences of plastic debris can be effective in reducing plastic waste at the time of disposal. Implementing the idea into concrete interventions, we hypothesize that presenting signage with a marine animal trapped in plastic debris near the waste disposal bins can discourage people from disposing of single-use plastic items in the bins. This is motivated by the idea that visual communication that connects the downstream consequences on the environment with prior disposal actions can be a powerful tool in motivating people to reduce their plastic use (). For example, visualizing the potential harm of everyday plastic products at the end of product life (e.g., putting an image of marine mammals suffering from plastic debris on a water bottle) may discourage consumers from purchasing plastic products in the first place. This nudge is novel and distinct from previous approaches because it does not change the incentive structure (i.e., the economic incentives or costs have not changed), or prohibit the disposal action (i.e., people can still freely dispose plastic waste if they want to).
Indeed, past studies have demonstrated that adding images displaying the health impacts of smoking on cigarette packages has significantly reduced cigarette sales and decreased the prevalence of smoking (see, e.g., ; ). Displaying aversive health consequences around unhealthy foods has effectively reduced the intention to choose these foods (see, e.g., ; ), and instead increased the purchase of healthy food (). In addition, graphic warning labels reduced preferences of alcoholic products () and increased intention to consume less of these products (). Furthermore, images showing the adverse impacts of climate change have been extensively used in the media to convey the message of climate change to the public (; ; ). Images of animals suffering are effective in increasing behavioral intentions to protect animal welfare and increasing the amount of donations (). Seeing a victim of plastic waste also increased people’s intention to reduce plastic use and shift their choice to a non-plastic packaging product (). However, in the two recent studies, the images have only influenced people’s intentions to act and there is no evidence of actual behavior change (; ). This calls for the need to investigate the impact of visual images on actual conservation behavior.
Since public conservation campaigns often present visual images of animals suffering from plastic debris, combined with a request that asks people to make a pledge to reduce plastic waste (), the independent effects of visual images and pledge making on plastic waste reduction are currently unknown. That is, it is unclear if plastic waste reduction is driven by the visual images or by the pledge. Past studies have shown that commitment making (i.e., pledge), defined as the commitment of an individual to a certain action, can encourage pro-environmental behavior that ultimately leads to a community-wide behavioral change (; ; ; ). In these studies, when people signed pledges to save energy, water, or to recycle, they were more likely to follow through on their intentions, especially when the pledges were public (; ). The effect of commitment making has been shown to have a significant long-term impact on pro-environmental behavior (). Based on a meta-analysis by , participants who made a commitment significantly increased their pro-environmental actions during the intervention period and post-intervention period, compared to participants who were in the control condition. A recent study has shown that people who made a commitment in addition to receiving normative messaging showed longer-term reductions in water use, compared to people who only received normative messaging or those who did not make the commitment in the first place (). While commitment making can increase pro-environmental behavior, it is currently unknown how the effect of visual images compares to the effect of commitment making on plastic waste reduction. Understanding the independent effects of the two nudges can help guide the design of future conservation campaigns.
Finally, improving the design of signage on recycling bins by simplifying the texts is another nudge that can promote recycling behaviors (). Previous studies have shown that simply posting signage above the recycling bins increased recycling behavior (; ). However, not all signage was effective. A survey conducted on a university campus showed that the majority of the respondents recommended improving the signage with more pictures and less text because many people find the sorting guidelines on the signage confusing (). To simplify signage, an experimental study showed that signage that contained images or icons was more effective than signage with texts in increasing accurate waste disposal behavior (). This calls for a need to replace texts with images or icons on the signage and examine its impact on plastic waste reduction. This simplification is especially important if the existing signage is too small or too crowded to see.
Given the behavioral insights on how visual images, commitment making, and simplification can promote pro-environmental behavior, the current study aimed to examine the impact of visualizing marine consequences of plastic debris on plastic waste reduction. Moreover, the study aimed to compare the impact of visualization to the impact of making a pledge to reduce plastic waste in order to identify which nudge is more effective. Since the existing signage in the target building in current study was small with text, we aimed to improve the existing signage by using images or icons of the items on the signage. In the first experiment, we improved the signage by simplifying the items on the poster in the improved signage condition, visualized marine animals trapped in plastic debris in another poster in the signage + animal condition, and presented a pledge to reduce plastic waste in the signage + pledge condition. This design allowed us to examine the independent effects of visual images and commitment making on plastic waste reduction after improving the signage. The target behavior was to reduce overall single-use plastic items disposed in the bins, not the accuracy of sorting. We measured the disposal of single-use plastic waste by computing the percent of single-use plastic items among all items in the bins. Since our research goal was to reduce overall plastic items, we expected the interventions to decrease the percent of plastic items disposed in all bins. In the second study, we expanded from an experiment to a full-scale implementation by placing the visual images in all conditions in order to examine whether the findings would apply more broadly.
Study 1
To measure the effectiveness of commitment making and visual images on the disposal of single-use plastic items, we conducted an experiment in an office building of a financial accounting company in downtown Vancouver, Canada.
Site
Eight floors in the office building inhabited by the same company were selected for the experiment. Approximately 100 employees worked on each floor. Seven floors had a similar layout, containing mostly offices and a kitchen area with two cans and bottles bins, two recycling bins, two organics bins, and two garbage bins. The other floor contained a larger cafeteria containing the same set of bins except with two more organics bins and two more garbage bins. The eight floors were randomly assigned to four conditions, with two floors per condition (see Section A of Supplemental Material for the suitability of combining floors in each condition and the justification of the cafeteria floor). Since there were four types of bins (cans and bottles, recycling, organics, and garbage), we anticipated that plastic waste would appear in all four types of bins: plastic bottles in the cans and bottles bin, plastic containers and cups in the recycling bin, plastic containers and package with food remains in the organics bin (i.e., incorrect disposal), and plastic bags, containers, and wraps in the garbage bin.
Stimuli
There were four conditions in the experiment: improved signage, signage + animal, signage + pledge, and control (see Figure 1). In the improved signage condition, we designed new posters (8.3″ in width by 11.7″ in height) which were larger than existing signage (3.9″ in width by 2.8″ in height) with simplified images to guide sorting behaviors for each bin type (cans and bottles, recycling, organics, and garbage). In the signage + animal condition, we used the same posters as in the improved signage condition but added an image of a marine animal trapped in plastic debris at the top. In the signage + pledge condition, we used the same posters as in the improved signage condition but added a pledge at the top that encouraged people to sign a pledge to be plastic wise to protect ocean life. We also provided a sign-up sheet next to the posters in this condition. In the control condition, we used the existing signage without further intervention. The posters were placed on the kitchen countertop above the bins, so people could see the poster when they disposed of their waste.
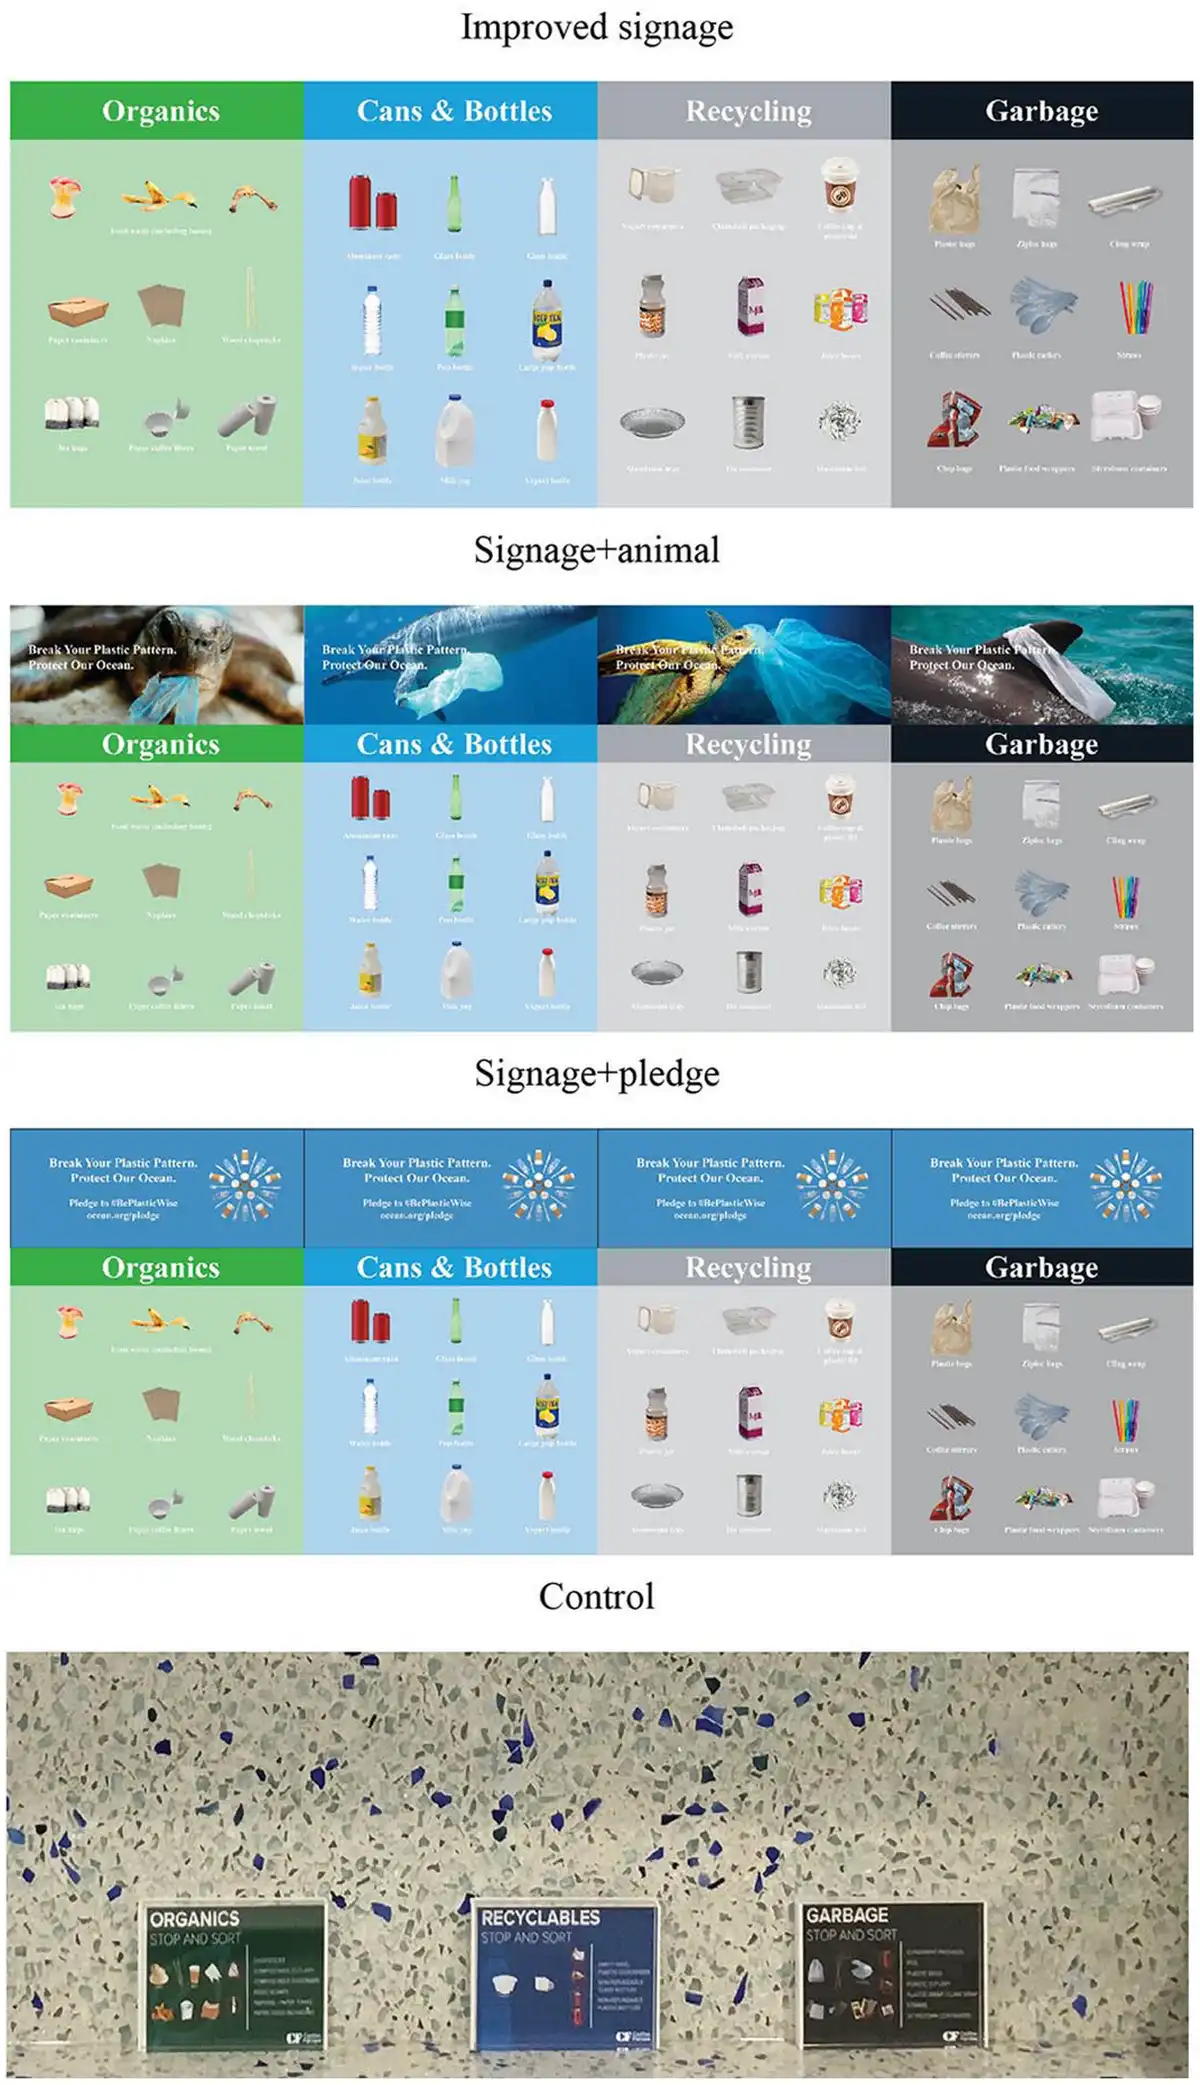
Figure 1
Signage used in the four conditions in Study 1 (improved signage, signage + animal, signage + pledge, and control). Plastic items can go to cans and bottles, recycling, organics, or garbage bins.
Procedure
The experiment ran for a total of 9 weeks from October to December 2018 with the first 3 weeks as the baseline period, during which we measured the bins without any intervention, followed by 4 weeks as the intervention period, during which we posted the signage above the bins in the kitchen area, and the final 2 weeks as the post-intervention period, during which we removed the signage. During each week, two research assistants (RAs) examined the bins on Monday, Wednesday, and Friday from 1 to 3 pm to avoid lunch traffic. Each bin was approximately 15 ″× 5″ × 20″. The RAs counted the number of plastic items and the number of non-plastic items in each bin (see the validation of measurement in Section B of Supplemental Material). The sum of the two was the total number of items in each bin. Plastic items were defined as items that were made of materials from one of the seven plastic categories created by the Resin identification coding system (#1–#7). Since the bins contained different numbers of items, we used the percent of plastic items in each bin, which was calculated as the number of plastic items divided by the total number of items, as the standardized dependent measure, with bins as the unit of analysis.
Results
To measure the effectiveness of visual images, commitment making, and simplification on the disposal of single-use plastic items, we conducted Kruskal-Wallis tests to examine the differences in the percent of plastic items across conditions and periods (see Figure 2a). We used non-parametric tests due to the violation of the normality assumption in our data. We also used pairwise comparisons with corrections for multiple comparisons to further elucidate any significant differences between conditions.
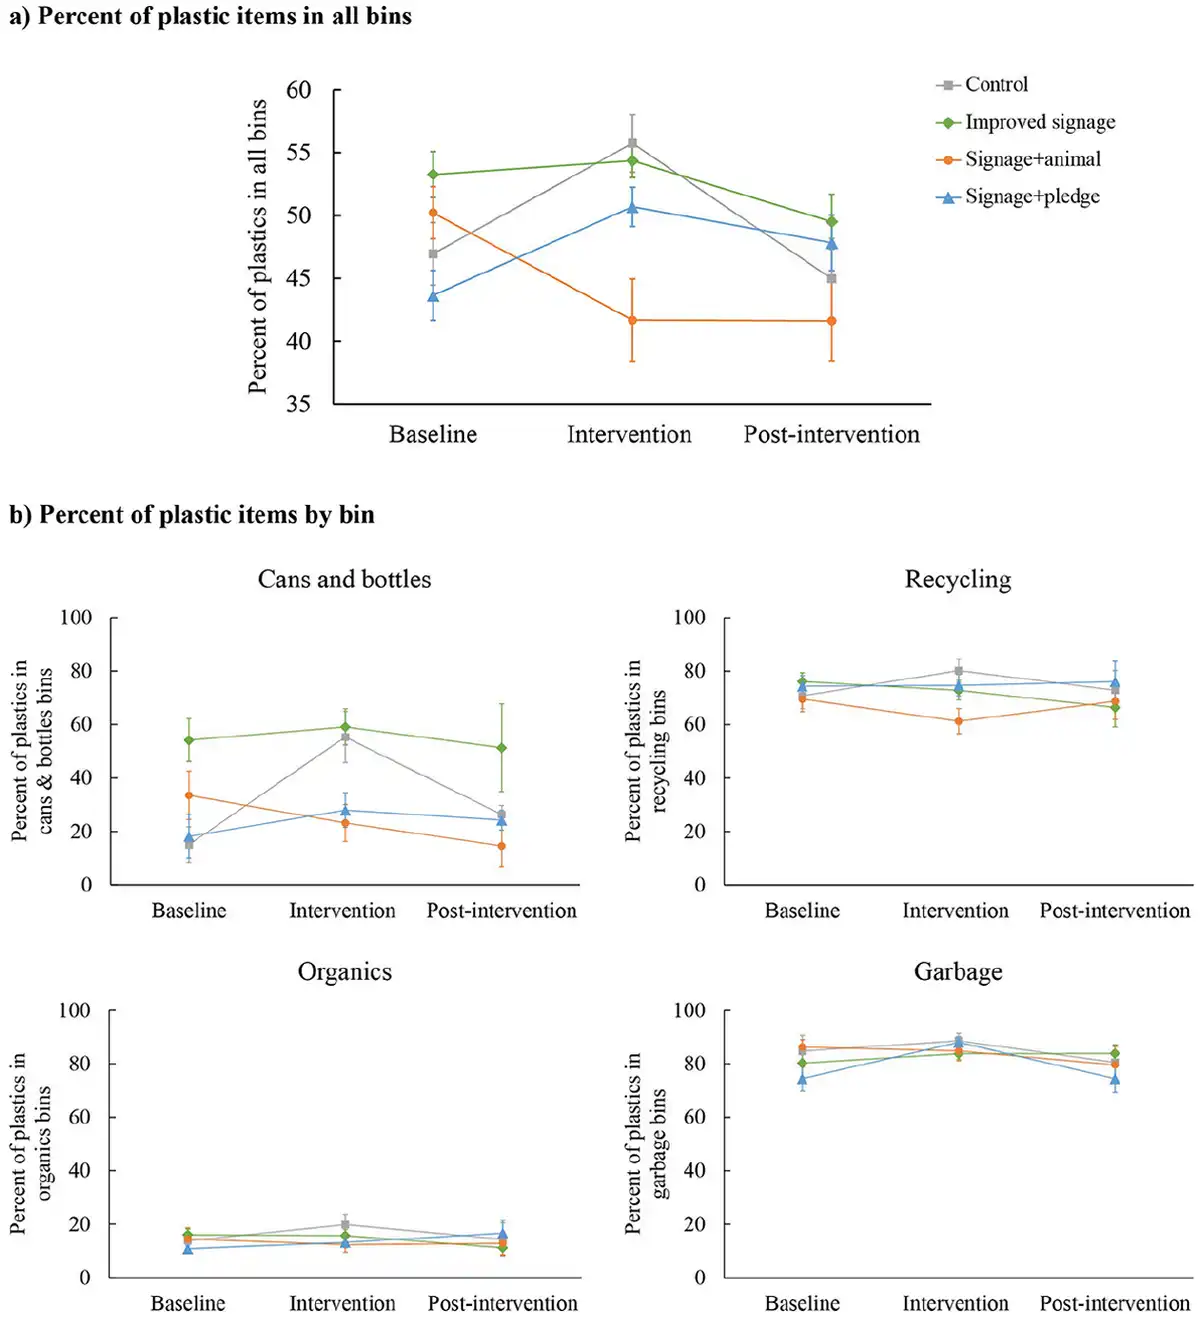
Figure 2
(a) Percent of plastic items in all bins in the four conditions over three periods and (b) percent of plastic items in each bin in the four conditions over three periods (error bars reflect ± 1 SEM).
We first analyzed the percent of plastic items across conditions to examine any differences in the baseline period. The Kruskal-Wallis test showed that there was a statistically significant difference in the percent of plastic items between the different conditions in the baseline period [χ2(3) = 9.78, p = .02, ε2 = .32]. According to the rules suggested by , the effect size (i.e., epsilon squared, ε2) is considered a small, medium, or large effect, when the value is .02, .13, or .26, respectively. The effect size observed here was therefore large. Pairwise comparisons using the Wilcoxon rank-sum tests with Holm-Bonferroni corrections showed that only the improved signage condition had a significantly higher percent of plastic items than the signage + pledge condition in the baseline period (p = .04). No other pairwise comparisons were significant (p’s > .14). This baseline difference between the improved signage condition and the signage + pledge condition reflects a pre-existing difference in the waste produced between the floors, which was outside the control of the researchers. Since each condition only contained two floors, it was difficult to balance the conditions due to the small number of floors even with random assignment. This said, this baseline difference was unlikely to account for the effect observed in the intervention period which will be explained below.
In the intervention period, we found that there was a significant difference in the percent of plastic items between the conditions [χ2(3) = 13.69, p = .003, ε2 = .32, a large effect]. Pairwise comparisons using the Wilcoxon rank-sum tests with Holm-Bonferroni corrections showed that the signage + animal condition had the lowest percent of plastic items, compared to the control condition (p = .01), improved signage condition (p = .03), or signage + pledge condition marginally (p = .06). None of the other comparisons were significant (p’s > .22). The lack of a difference between the signage + pledge condition and the control condition could be due to the fact that only 74 out of 200 employees (37%) on the two floors in the signage + pledge condition signed the pledge.
Another important analysis was to examine whether there was a reduction in the percent of plastic items from baseline to intervention periods in each condition. A Mann-Whitney U test indicated that only the signage + animal condition showed a 17.1% decline from baseline to intervention periods (U = 69, p = .04), whereas the control condition (U = 16, p = .02) and the signage + pledge condition (U = 16, p = .02) showed a significant increase from baseline to intervention periods, and the improved signage condition showed no significant difference (U = 36, p = .54). Since the baseline difference was only between the improved signage condition and the signage + pledge condition, it could not have explained the significant reduction in the percent of plastic items in the signage + animal condition.
After the posters had been removed (post-intervention period), there was no significant difference between the conditions [χ2(3) = 3.71, p = .29, ε2 = .16, a medium effect]. The percent of plastic items remained unchanged in the signage + animal condition (U = 31, p = .88), the improved signage condition (U = 49, p = .12), and the signage + pledge condition (U = 44, p = .30), but not in the control condition (U = 51, p = .03). Thus, the removal of the posters did not seem to change the percent of plastic items compared to the intervention period.
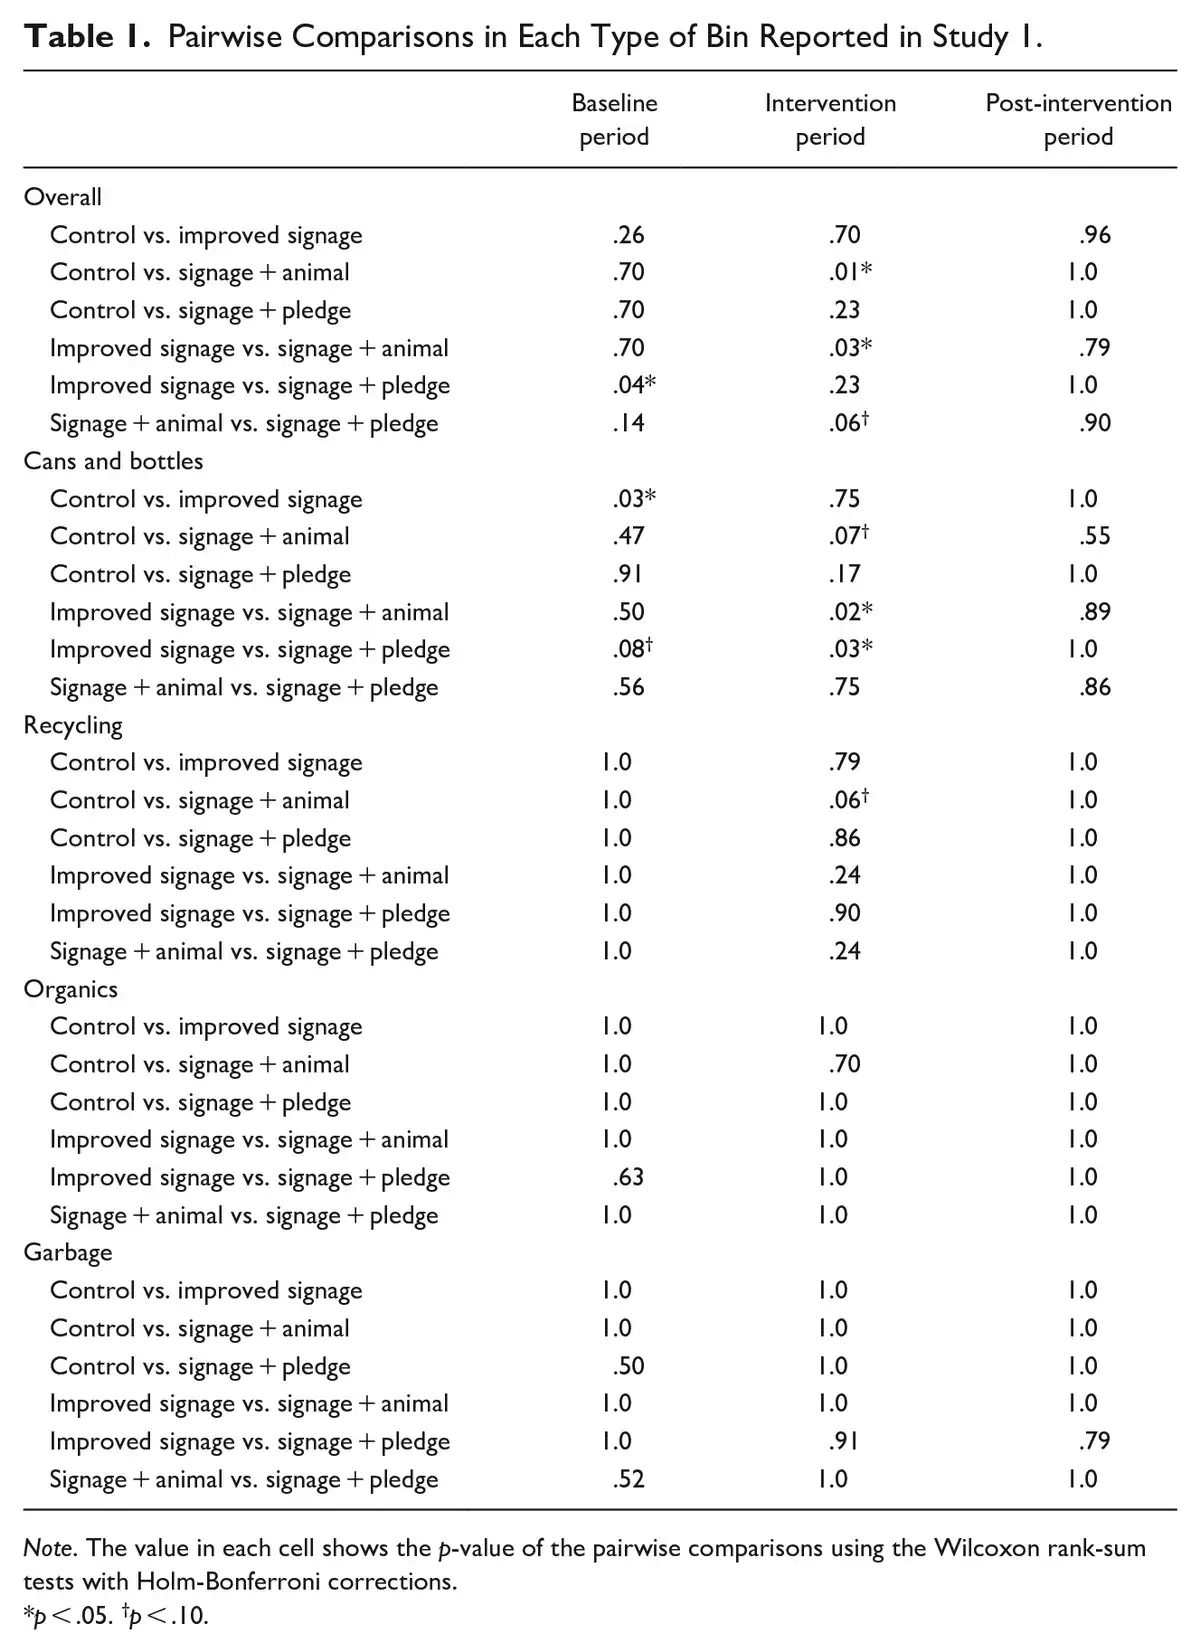
We further analyzed each waste stream separately to examine whether this effect was observed in each type of bin (Figure 2b and also see Table 1 for a summary table of the pairwise comparisons).
For the cans and bottles bin, there was a difference between the conditions in the baseline period [χ2(3) = 10.51, p = .01, ε2 = .34, a large effect], where the improved signage condition was higher in the percent of plastic items than the control condition (p = .03) and was marginally higher than the signage + pledge condition (p = .08). In the intervention period, there was a difference in the percent of plastic items between the conditions [χ2(3) = 13.74, p = .003, ε2 = .32, a large effect], where the signage + animal condition was lower in the percent of plastic items than the improved signage condition (p = .02) and was marginally lower than the control condition (p = .07). In the post-intervention period, there was no difference between the conditions [χ2(3) = 4.31, p = .23, ε2 = .19, a medium effect].
For the recycling bin, there was no difference between the conditions in the baseline period [χ2(3) = 1.39, p = .71, ε2 = .04, a small effect]. In the intervention period, there was a difference in the percent of plastic items between the conditions [χ2(3) = 8.46, p = .04, ε2 = .20, a medium effect], where the signage + animal condition was marginally lower in the percent of plastic items than the control condition (p = .06). In the post-intervention period, there was no difference between the conditions [χ2(3) = 1.62, p = .65, ε2 = .07, a small effect].
For the organics bin, there was no difference in the percent of plastic items between the conditions in the baseline [χ2(3) = 2.53, p = .47, ε2 = .08, a small effect], intervention [χ2(3) = 3.03, p = .39, ε2 = .07, a small effect], and post-intervention periods [χ2(3) = 0.59, p = .90, ε2 = .03, a small effect].
Finally, for the garbage bin, there was no difference in the percent of plastic items between the conditions in the baseline [χ2(3) = 4.05, p = .25, ε2 = .13, a medium effect], intervention [χ2(3) = 2.58, p = .46, ε2 = .06, a small effect], and post-intervention periods [χ2(3) = 1.77, p = .62, ε2 = .08, a small effect]. Although the bin-level analyses were less conclusive, the overall pattern in Figure 2b showed that only the signage + animal condition showed a consistent decline in plastic waste from baseline to intervention periods in all waste streams.
Plastic item composition analysis
We examined the types of plastic items that were found in the bins in each condition across the three periods. The top five plastic items were plastic wrappers (e.g., candy wrappers, tea bag wrappers, or chips bags; 29%), cutlery (26%), lids (e.g., cup lids, container lids, or bottle lids; 12%), plastic containers (11%), and plastic bags (6%). We also found that the composition of the top five plastic items remained stable in each condition across the three periods (see the item composition analysis in Section C of Supplemental Material). This suggests that the reduction in plastic waste occurred in all types of plastic items rather than eliminating one specific type of plastic waste.
Study 2
To expand from an experiment to a full-scale implementation, we placed the poster in the signage + animal condition on every floor in the building 4 months after Study 1 finished, in order to examine whether the results would apply to the entire building. For the two floors in the signage + animal condition in Study 1, the poster on these floors remained unchanged. The important feature in Study 2 was that this study was no longer an experiment, but an observation of the effect of the signage + animal poster implemented in all four conditions (i.e., all eight floors in the building). In other words, all conditions now had the same treatment.
Site
The same eight floors in Study 1 were included in the study. The type and the number of bins remained identical as in Study 1.
Procedure
The measurements in Study 2 ran for 6 weeks from March to mid-April 2019. We shortened the frequency of measurement from three times per week to once per week. Our research assistants measured each bin on each floor every Wednesday from 1 pm to 3 pm. The procedure to conduct the measurements was the same as that in Study 1.
Results
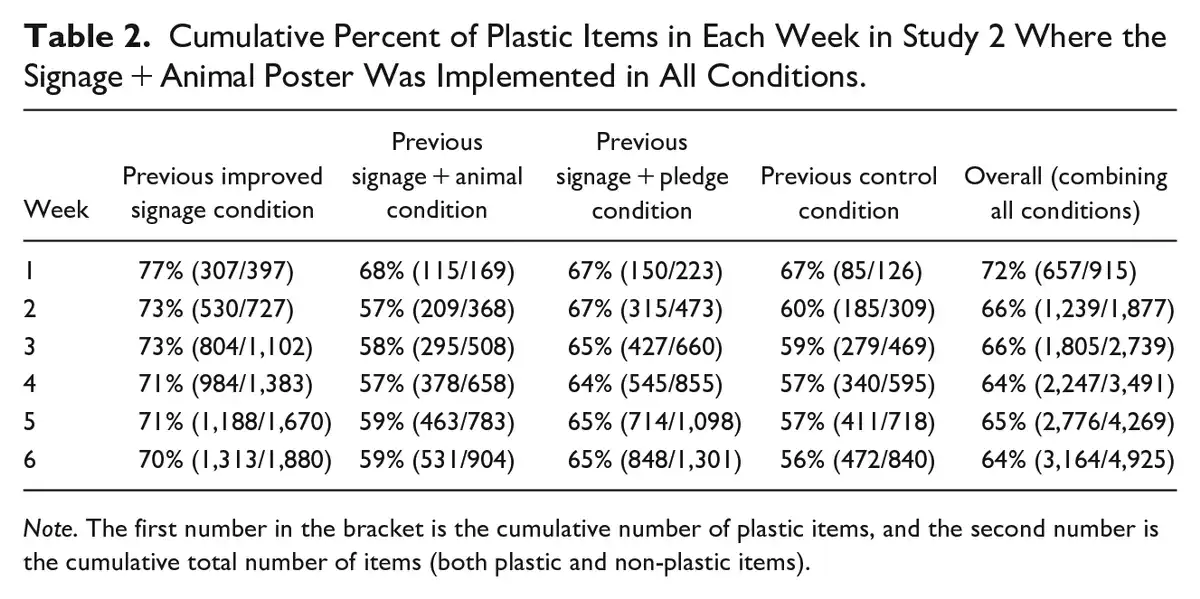
To examine whether the poster in the signage + animal condition reduced the percent of plastic items on all floors, we computed the cumulative percent of plastic items in all bins for the four previous conditions and all conditions combined (i.e., all eight floors combined). The goal of the cumulative analysis was to show whether there was an overall decrease in the percent of plastic items in the bins in week 6 after the implementation of the signage + animal poster across all floors in week 1 (see Figure 3).
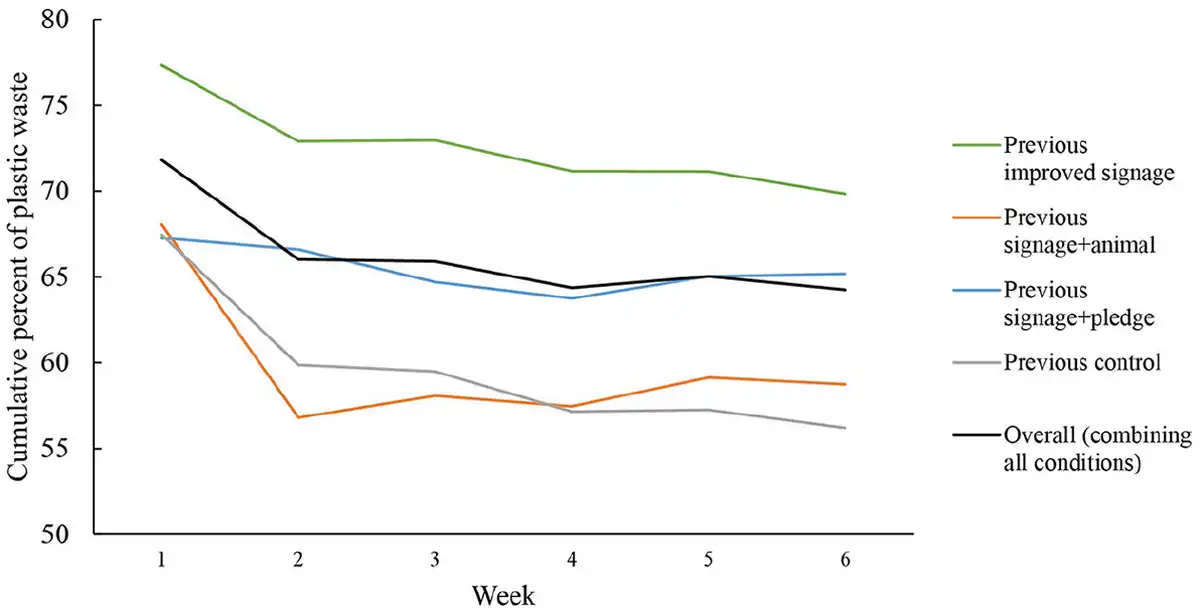
Figure 3
Cumulative percent of plastic items in all bins for the four previous conditions and all conditions combined over 6 weeks in Study 2.
To quantify the change over time, we conducted a chi-square test to examine whether the overall percent of plastic items reduced from week 1 to week 6. We found that the cumulative percent of plastic items was significantly lower in week 6 (64% of plastic items) compared to the percent of plastic items in week 1 (72% of plastic items; χ2 = 19.50, p < .001; see Table 2). This analysis suggests that implementing the poster with a marine animal trapped in plastic debris reduced the overall percent of plastic items on all the floors in the building.
We further analyzed each waste stream separately to examine whether the overall percent of plastic items was reduced from week 1 to week 6 in each type of bin (see Table S2 in Section D of Supplemental Material). We found that the cumulative percent of plastic items was significantly lower in week 6 compared to week 1 in the organics bin (χ2 = 4.89, p = .03) and marginally lower in the recycling bin (χ2 = 2.72, p = .099), but not in the cans and bottles bin (χ2 < .001, p = 1.00) or the garbage bin (χ2 = 0.73, p = .39).
Debriefing
After the completion of the two studies, we conducted an informal debriefing session as part of a lunch and learn event with around 120 employees in the company where the studies took place. During the session, we asked the employees in attendance three specific questions about whether they had seen the posters in the kitchen area on their floor, whether they had seen the pledge or the signup sheet, and whether they had changed their waste disposal behavior if they had seen the posters. To our surprise, only six employees (5%) reported that they had seen the posters, and only two employees (1.67%) reported that they had signed the pledge. None reported that they had changed their waste disposal behavior over the course of the studies.
General Discussion
The current paper examined the impact of visualizing marine consequences from plastic debris on the disposal of single-use plastic items, which was measured as the percent of plastic items in the bins, in an office building. In Study 1, the signage with a marine animal trapped in plastic debris showed the largest reduction in plastic waste (17%), compared to improved recycling signage alone, signage with a pledge to reduce plastic waste, or a control condition.
Since the signage with the marine animal was displayed on the kitchen countertop of the bins, it directly connected waste disposal behavior to the consequence of plastic pollution in the ocean. Perhaps seeing the negative impact on the marine animal served as a motivation to reduce plastic waste (; ; ). One cognitive framework suggests that after internalizing the visual image, people may increase their motivation for long-term goals and this motivation serves as a trigger for actions (). In our study, after seeing the animal image in the kitchen area several times, people may retain a mental image that triggers a reconsideration when they attempt to use a plastic item. The mental image may also boost the motivation to reduce plastic waste over time since the percent of plastic items remained at a similar level from intervention to post-intervention periods in the signage + animal condition.
Moreover, in the signage + animal condition, we presented either a sea turtle or a dolphin trapped in plastic debris in the signage. The efficacy of visualizing a single marine animal trapped in plastic debris could be explained by the identifiable victim effect where people are more willing to act for a specific victim (; ). Future studies are needed to replicate the effect and provide evidence for the specific underlying psychological processes. Further work could also examine how empathy toward different marine species (e.g., a dolphin vs. a shark) can mediate or moderate the reduction in plastic waste. Additionally, this reduction was solely due to the image of the marine animal rather than a combined effect of the text and the image on the signage, because the text “Break Your Plastic Pattern. Protect Our Ocean.” was on the signage in the signage + animal condition, and also on the signage in the signage + pledge condition. Thus, the text could not be the distinguishing factor between the two conditions.
The fact that plastic waste was reduced across all bins suggests that the signage with the animal minimized the plastic items entering the waste streams, rather than diverting plastic items from one bin to another. However, we observed a larger decrease in the percent of plastic items in the cans and bottles bins than the garbage bins which had the largest percent of plastic waste throughout the study. One reason that the percent in the garbage bins did not change could be due to the prevalent disposal of the plastic wrappers of teabags. From the item composition analysis, these plastic wrappers represented 20% to 40% of all waste items. Because the plastic wrappers could not be recycled in Vancouver, they should go to the garbage bins. As a result, the percent of plastic items in the garbage bins remained high throughout the study and any effect from the interventions could be drowned out by the vast amount of plastic wrappers in the garbage bins. To reduce plastic wrappers, we made a recommendation to the company’s sustainability team at the end of the study to use alternative packaging of teabags without plastic wrappers.
A puzzling finding in Study 1 was that the signage + pledge condition did not show a significant reduction in plastic waste. If anything, it showed a numeric (although non-significant) increase from baseline to intervention periods. There are several explanations for this. First, not many people (only 37% of the employees) voluntarily signed the pledge. Second, for those who signed the pledge, they may be prone to the single action bias, where they were willing to take one action and felt that one action is sufficient (). After signing the pledge, they might feel that they had committed sufficiently to protect the ocean from plastic pollution, and therefore they took a less rigorous approach in their follow-up actions to reduce plastic waste. Third, commitment effects tend to be more robust when concerns about others’ reactions have been elicited (). The signage + pledge condition might not have created an environment that activated social norms since we did not actively promote the pledge among the employees, resulting in reduced commitment effects.
Moreover, the improved signage condition did not show a significant reduction in plastic waste. In past studies, similar recycling signage was used to improve the accuracy of recycling behaviors and to reduce overall waste contamination (e.g., ). The lack of an effect in the current study could be driven by the fact that the improved signage did not explicitly request people to reduce plastic waste in particular, since a past model of sign-to-behavior process suggested that greater clarity of purpose is associated with higher perceived effectiveness of the signage for unfamiliar signage ().
It is encouraging to see a potential reduction in plastic waste when we implemented the signage with the animal in the entire building in Study 2. Indeed, following the completion of the studies, the company that resided in the building has phased out plastic cutlery and cups in their offices and is currently implementing the signage + animal poster in their offices in 155 countries, which will likely have a significant reduction in plastic waste worldwide.
During the debriefing session, we found that very few employees reported that they had noticed the posters, that they had signed the pledge, or changed their waste disposal behavior over the course of the studies. It is remarkable that we still observed a significant reduction in plastic waste in the signage + animal condition despite the fact that very few employees reported noticing the poster. This suggests that the visual image of a marine animal trapped in plastic debris may not require conscious awareness to elicit behavior change, which is consistent with past literature showing the lack of relationship between awareness of messaging and pro-environmental behavior change (). The low number of employees who were aware of the posters could be driven by several factors, such as a decay in long-term memory in the multiple months between the intervention period and the debriefing session. This decay could contribute to forgetting having ever seen the posters, or forgetting the change in behaviors during the studies. Another factor could be inattention to the posters or the pledge. A previous study found that longer exposure to an environmental message was associated with higher knowledge of the recommended practices and increased memory retention of the message (). Since the pledge poster was only up for 4 weeks, it may not be sufficiently long for people to notice, which could explain why only a small proportion of the employees signed the pledge.
One limitation in Study 1 is that the number of social events, employees, and visitors on each floor were not recorded at each visit. A social event that occurred on a given floor could increase the percent of plastic items, for example, the number of water bottles could surge after a social gathering. This might explain the increase in the percent of plastic items from baseline to intervention period in the signage + pledge condition and the control condition. Since our study lasted 3 months, the change in the number of employees and visitors, such as clients or maintenance workers, on a given floor could also influence the percent of plastic items on that floor. For example, more employees could consume more tea, leading to more tea bag wrappers being thrown away. We could not control these factors in our study. Future studies should track the number of social events and the number of employees in each condition as covariates to more cleanly examine the impact of the interventions. Another limitation is that employees on a given floor could move to another floor, and therefore seeing the poster in a different condition. However, this contamination between conditions should be minimal because for most floors in the building (except the lobby and the cafeteria), the employees would need access permissions to move to floors that are not their office space.
In conclusion, the current study demonstrated that signage with a marine animal trapped in plastic debris was more effective in reducing plastic waste than commitment making or improving information about the appropriate disposal behavior alone. Importantly, the study was conducted as a field experiment in a high-rise office building and showed a significant impact on plastic waste reduction. The findings provide a behavioral insight into the effectiveness of visualizing marine consequences of plastic pollution in reducing plastic waste.
We thank Clarence Han, Misha Afzaal, Nil Polat, and Yinuo Lu for helping with data collection.
Declaration of Conflicting Interests The author(s) declared no potential conflicts of interest with respect to the research, authorship, and/or publication of this article.
Funding The author(s) disclosed receipt of the following financial support for the research, authorship, and/or publication of this article: This work was supported by the Canada Research Chairs program (to JZ), the Leaders Opportunity Fund from the Canadian Foundation for Innovation (F14-05370 to JZ), and Mitacs Accelerate Grant (IT11777 to YL).
Supplemental Material Supplemental material for this article is available online.
Yu Luo
https://orcid.org/0000-0001-6450-9410
Jeremy Douglas
https://orcid.org/0000-0001-8867-4330
Jiaying Zhao
https://orcid.org/0000-0003-0902-4343
References
- Adyel T. M. (2020). Accumulation of plastic waste during COVID-19. Science, 369(6509), 1314–1315. https://doi.org/10.1126/science.abd9925
- Al-Hamdani M., Smith S. (2015). Alcohol warning label perceptions: Emerging evidence for alcohol policy. Canadian Journal of Public Health, 106(6), e395–e400. https://doi.org/10.17269/CJPH.106.5116
- Alpizar F., Carlsson F., Lanza G., Carney B., Daniels R. C., Jaime M., Ho T., Nie Z., Salazar C., Tibesigwa B., Wahdera S. (2020). A framework for selecting and designing policies to reduce marine plastic pollution in developing countries. Environmental Science & Policy, 109, 25–35. https://doi.org/10.1016/j.envsci.2020.04.007
- Andrady A. L. (2011). Microplastics in the marine environment. Marine Pollution Bulletin, 62(8), 1596–1605. https://doi.org/10.1016/j.marpolbul.2011.05.030
- Austin J., Hatfield D. B., Grindle A. C., Bailey J. S. (1993). Increasing recycling in office environments: The effects of specific, informative cues. Journal of Applied Behavior Analysis, 26(2), 247–253. https://doi.org/10.1901/jaba.1993.26-247
- Barnes D. K., Galgani F., Thompson R. C., Barlaz M. (2009). Accumulation and fragmentation of plastic debris in global environments. Philosophical Transactions of the Royal Society B: Biological Sciences, 364(1526), 1985–1998. http://doi.org/10.1098/rstb.2008.0205
- Bollard T., Maubach N., Walker N., Mhurchu C. N. (2016). Effects of plain packaging, warning labels, and taxes on young people’s predicted sugar-sweetened beverage preferences: An experimental study. International Journal of Behavioral Nutrition and Physical Activity, 13(1), 95. https://doi.org/10.1186/s12966-016-0421-7
- Bonfrer A., Chintagunta P. K., Roberts J. H., Corkindale D. (2019). Assessing the sales impact of plain packaging regulation for cigarettes: Evidence from Australia. Marketing Science, 39(1), 1–284. https://doi.org/10.1287/mksc.2019.1164
- Boomsma C., Pahl S., Andrade J. (2016). Imagining change: An integrative approach toward explaining the motivational role of mental imagery in pro-environmental behavior. Frontiers in Psychology, 7, 1780. https://doi.org/10.3389/fpsyg.2016.01780
- Borrelle S. B., Ringma J., Law K. L., Monnahan C. C., Lebreton L., McGivern A., Murphy E., Jambeck J., Leonard G. H., Hilleary M. A., Eriksen M., Possingham H. P., De Frond H., Gerber L. R., Polidoro B., Tahir A., Bernard M., Mallos N., Barnes M., Rochman C. M. (2020). Predicted growth in plastic waste exceeds efforts to mitigate plastic pollution. Science, 369(6510), 1515–1518. https://doi.org/10.1126/science.aba3656
- Chow C., So W. W., Cheung T., Yeung S. D. (2017) Plastic waste problem and education for plastic waste management. In Kong S. -C., Wong T. L., Yang M., Chow C. F., Tse K. H. (Eds.), Emerging practices in scholarship of learning and teaching in a digital era (pp. 125–140). Springer. https://doi.org/10.1007/978-981-10-3344-5_8
- Cialdini R. B. (2001). Influence: Science and practice. Allyn & Bacon.
- Cohen J. (1992). A power primer. Psychological Bulletin, 112(1), 155. https://doi.org/10.1037//0033-2909.112.1.155
- Cole D. N., Hammond T. P., McCool S. F. (1997). Information quantity and communication effectiveness: Low-impact messages on wilderness trailside bulletin boards. Leisure Sciences, 19(1), 59–72. https://doi.org/10.1080/01490409709512239
- Czajkowski M., Zagórska K., Hanley N. (2019). Social norm nudging and preferences for household recycling. Resource and Energy Economics, 58, 101110. https://doi.org/10.1016/j.reseneeco.2019.07.004
- Derraik J. G. (2002). The pollution of the marine environment by plastic debris: A review. Marine Pollution Bulletin, 44(9), 842–852. https://doi.org/10.1016/S0025-326X(02)00220-5
- Desforges J. P. W., Galbraith M., Ross P. S. (2015). Ingestion of microplastics by zooplankton in the Northeast Pacific Ocean. Archives of Environmental Contamination and Toxicology, 69(3), 320–330. https://doi.org/10.1007/s00244-015-0172-5
- Donnelly G. E., Zatz L. Y., Svirsky D., John L. K. (2018). The effect of graphic warnings on sugary-drink purchasing. Psychological Science, 29(8), 1321–1333. https://doi.org/10.1177/0956797618766361
- Duer P. J. (2020, ). The plastic pandemic is only getting worse during COVID-19. World Economic Forum. Retrieved September 18, 2020, from https://www.weforum.org/agenda/2020/07/plastic-waste-management-covid19-ppe/
- Environment and Climate Change Canada. (2020, ). Canada one-step closer to zero plastic waste by 2030. https://www.canada.ca/en/environment-climate-change/news/2020/10/canada-one-step-closer-to-zero-plastic-waste-by-2030.html
- European Commission. (2019, ). Single-use plastics. https://ec.europa.eu/environment/topics/plastics/single-use-plastics_en
- Farrow K., Grolleau G., Ibanez L. (2017). Social norms and pro-environmental behavior: A review of the evidence. Ecological Economics, 140, 1–13. https://doi.org/10.1016/j.ecolecon.2017.04.017
- Ford D. (2020, ). COVID-19 has worsened the ocean plastic pollution problem. Scientific American. https://www.scientificamerican.com/article/covid-19-has-worsened-the-ocean-plastic-pollution-problem/
- Gall S. C., Thompson R. C. (2015). The impact of debris on marine life. Marine Pollution Bulletin, 92(1–2), 170–179. https://doi.org/10.1016/j.marpolbul.2014.12.041
- Hart P. S., Feldman L. (2016). The impact of climate change–related imagery and text on public opinion and behavior change. Science Communication, 38(4), 415–441. https://doi.org/10.1177/1075547016655357
- Hartley B. L., Pahl S., Holland M., Alampei I., Veiga J. M., Thompson R. C. (2018). Turning the tide on trash: Empowering European educators and school students to tackle marine litter. Marine Policy, 96, 227–234. https://doi.org/10.1016/j.marpol.2018.02.002
- Hollands G. J., Prestwich A., Marteau T. M. (2011). Using aversive images to enhance healthy food choices and implicit attitudes: An experimental test of evaluative conditioning. Health Psychology, 30(2), 195. https://doi.org/10.1037/a0022261
- Homonoff T., Kao L. S., Palmer D., Seybolt C. (2018, ). Skipping the bag: Assessing the impact of Chicago’s tax on disposable bag. Ideas42. http://www.ideas42.org/wp-content/uploads/2018/09/Bag_Tax_Paper_final.pdf
- Jaeger C. M., Schultz P. W. (2017). Coupling social norms and commitments: Testing the underdetected nature of social influence. Journal of Environmental Psychology, 51, 199–208. https://doi.org/10.1016/j.jenvp.2017.03.015
- Jenni K., Loewenstein G. (1997). Explaining the identifiable victim effect. Journal of Risk and Uncertainty, 14(3), 235–257. https://doi.org/10.1023/A:1007740225484
- Kelly T. C., Mason I. G., Leiss M. W., Ganesh S. (2006). University community responses to on-campus resource recycling. Resources, Conservation and Recycling, 47(1), 42–55. https://doi.org/10.1016/j.resconrec.2005.10.002
- Kiesler C. A. (1971). The psychology of commitment: Experiments linking behavior to belief. Academic Press.
- Konyn C. (2020, ). Another side effect of COVID-19: The surge in plastic pollution: Earth.Org. Retrieved September 18, 2020, from https://earth.org/covid-19-surge-in-plastic-pollution/
- Lau W. W., Shiran Y., Bailey R. M., Cook E., Stuchtey M. R., Koskella J., Velis C. A., Godfrey L., Boucher J., Murphy M. B., Thompson R. C., Jankowska E., Castillo Castillo A., Pilditch T. D., Dixon B., Koerselman L., Kosior E., Favoino E., Gutberlet J., . . . Palardy J. E. (2020). Evaluating scenarios toward zero plastic pollution. Science, 369(6510), 1455–1461. https://doi.org/10.1126/science.aba9475
- Law K. L., Morét-Ferguson S., Maximenko N. A., Proskurowski G., Peacock E. E., Hafner J., Reddy C. M. (2010). Plastic accumulation in the North Atlantic subtropical gyre. Science, 329(5996), 1185–1188. https://doi.org/10.1126/science.1192321
- Li W. C., Tse H. F., Fok L. (2016). Plastic waste in the marine environment: A review of sources, occurrence and effects. Science of the Total Environment, 566, 333–349. https://doi.org/10.1016/j.scitotenv.2016.05.084
- Lokhorst A. M., Werner C., Staats H., van Dijk E., Gale J. L. (2013). Commitment and behavior change: A meta-analysis and critical review of commitment-making strategies in environmental research. Environment and Behavior, 45(1), 3–34. https://doi.org/10.1177/0013916511411477
- McKenzie-Mohr D. (2011). Fostering sustainable behavior: An introduction to community-based social marketing (3rd ed.). New Society Publishers.
- Meis J., Kashima Y. (2017). Signage as a tool for behavioral change: Direct and indirect routes to understanding the meaning of a sign. PLoS One, 12(8), e0182975. https://doi.org/10.1371/journal.pone.0182975
- Miller N. D., Meindl J. N., Caradine M. (2016). The effects of bin proximity and visual prompts on recycling in a university building. Behavior and Social Issues, 25(1), 4–10. https://doi.org/10.5210/bsi.v25i0.6141
- Nicholson-Cole S. A. (2005). Representing climate change futures: A critique on the use of images for visual communication. Computers, Environment and Urban Systems, 29(3), 255–273. https://doi.org/10.1016/j.compenvurbsys.2004.05.002
- Nielsen T. D., Holmberg K., Stripple J. (2019). Need a bag? A review of public policies on plastic carrier bags–Where, how and to what effect? Waste Management, 87, 428–440. https://doi.org/10.1016/j.wasman.2019.02.025
- Nolan J. M., Schultz P. W., Cialdini R. B., Goldstein N. J., Griskevicius V. (2008). Normative social influence is underdetected. Personality and Social Psychology Bulletin, 34(7), 913–923. https://doi.org/10.1177/0146167208316691
- Ocean Wise. (2018, ). Plastic wise campaign. Retrieved April 6, 2020, from https://ocean.org/plastic-wise
- Pahl S., Wyles K. J., Thompson R. C. (2017). Channeling passion for the ocean towards plastic pollution. Nature Human Behaviour, 1(10), 697. https://doi.org/10.1038/s41562-017-0204-4
- Pallak M. S., Cummings W. (1976). Commitment and voluntary energy conservation. Personality and Social Psychology Bulletin, 2(1), 27–30. https://doi.org/10.1177/014616727600200105
- Rivers N., Shenstone-Harris S., Young N. (2017). Using nudges to reduce waste? The case of Toronto’s plastic bag levy. Journal of Environmental Management, 188, 153–162. https://doi.org/10.1016/j.jenvman.2016.12.009
- Septianto F., Lee M. S. (2020). Emotional responses to plastic waste: Matching image and message framing in encouraging consumers to reduce plastic consumption. Australasian Marketing Journal, 28(1), 18–29. https://doi.org/10.1016/j.ausmj.2019.09.002
- Small D. A., Loewenstein G., Slovic P. (2007). Sympathy and callousness: The impact of deliberative thought on donations to identifiable and statistical victims. Organizational Behavior and Human Decision Processes, 102(2), 143–153. https://doi.org/10.1016/j.obhdp.2006.01.005
- Smith N. W., Joffe H. (2009). Climate change in the British press: The role of the visual. Journal of Risk Research, 12(5), 647–663. https://doi.org/10.1080/13669870802586512
- Stead M., Moodie C., Angus K., Bauld L., McNeill A., Thomas J., Hastings G., Hinds K., O’Mara-Eves A., Kwan I., Purves R. I., Bryce S. L. (2013). Is consumer response to plain/standardised tobacco packaging consistent with framework convention on tobacco control guidelines? A systematic review of quantitative studies. PLoS One, 8(10), e75919. https://doi.org/10.1371/journal.pone.0075919
- Sussman R., Gifford R., Abrahamse W. (2016, ). Social mobilization: How to encourage action on climate change. Pacific Institute for Climate Solutions. https://pics.uvic.ca/sites/default/files/uploads/publications/FINAL%20Social%20mobilization-Sussman%20Gifford.pdf
- Sutherland W. J., Bardsley S., Bennun L., Clout M., Côté I. M., Depledge M. H., Dicks L. V., Dobson A. P., Fellman L., Fleishman E., Gibbons D. W., Impey A. J., Lawton J. H., Lickorish F., Lindenmayer D. B., Lovejoy T. E., Nally R. M., Madgwick J., Peck L. S., . . . Watkinson A. R. (2011). Horizon scan of global conservation issues for 2011. Trends in Ecology & Evolution, 26(1), 10–16. https://doi.org/10.1016/j.tree.2010.11.002
- Thaler R. H., Sunstein C. R. (2008). Nudge: Improving decisions about health, wealth, and happiness. Penguin Books.
- Thomas-Walters L., McNulty C., Veríssimo D. (2020). A scoping review into the impact of animal imagery on pro-environmental outcomes. Ambio, 49(6), 1135–1145. https://doi.org/10.1007/s13280-019-01271-1
- UNEP. (2018, ). Single-use plastics: A roadmap for sustainability. https://www.unenvironment.org/resources/report/single-use-plastics-roadmap-sustainability
- Vine E., Jones C. (2015, ). A review of energy reduction competitions: What have we learned? California Institute for Energy and Environment. https://escholarship.org/uc/item/30x859hv
- Viscusi W. K., Huber J., Bell J. (2012). Alternative policies to increase recycling of plastic water bottles in the United States. Review of Environmental Economics and Policy, 6(2), 190–211. https://doi.org/10.1093/reep/res006
- Wagner T. P. (2017). Reducing single-use plastic shopping bags in the USA. Waste Management, 70, 3–12. https://doi.org/10.1016/j.wasman.2017.09.003
- Wagner T. P., Toews P. (2018). Assessing the use of default choice modification to reduce consumption of plastic straws. Detritus, 4, 113–121. https://doi.org/10.31025/2611-4135/2018.13734
- Weber E. U. (1997). Perception and expectation of climate change: Precondition for economic and technological adaptation. In Bazerman M. H., Messick D. M., Tenbrunsel A. E., Wade-Benzoni K. A. (Eds.), The New Lexington Press management series and the New Lexington Press social and behavioral science series. Environment, ethics, and behavior: The psychology of environmental valuation and degradation (pp. 314–341). The New Lexington Press/Jossey-Bass Publishers.
- Wigg S., Stafford L. D. (2016). Health warnings on alcoholic beverages: Perceptions of the health risks and intentions towards alcohol consumption. PLoS One, 11(4), e0153027. https://doi.org/10.1371/journal.pone.0153027
- Wright S. L., Thompson R. C., Galloway T. S. (2013). The physical impacts of microplastics on marine organisms: A review. Environmental Pollution, 178, 483–492. https://doi.org/10.1016/j.envpol.2013.02.031
- Wu D. W., Lenkic P. J., DiGiacomo A., Cech P., Zhao J., Kingstone A. (2018). How does the design of waste disposal signage influence waste disposal behavior? Journal of Environmental Psychology, 58, 77–85. https://doi.org/10.1016/j.jenvp.2018.07.009
- Xanthos D., Walker T. R. (2017). International policies to reduce plastic marine pollution from single-use plastics (plastic bags and microbeads): A review. Marine Pollution Bulletin, 118(1–2), 17–26. https://doi.org/10.1016/j.marpolbul.2017.02.048