Introduction
How brain size variation contributes to animal adaptation is a long-standing topic of interest for evolutionary biologists and neuroscientists. A large brain may increase cognitive performance in social and ecological domains, which likely provides fitness benefits for animals living in challenging or novel environments (). However, the brain is one of the most energetically expensive organs that requires a constant energy supply to support functions (; ). Consequently, investment in a large brain is frequently assumed to increase metabolic costs for individuals, which can lead to reduced investment in other tissues and bodily functions (e.g., maintenance, reproductive output; ; ). To understand brain size evolution, both the benefits and the costs of a large brain need to be examined, and how animals offset the high energetic costs of a large brain (“the economics of brain size evolution”; ) is of particular interest. Over the past three decades, numerous studies have begun to address these issues, and multiple hypotheses have been proposed (see review by ).
The expensive brain hypothesis (EBH) states that the costs of a relatively large brain should be compensated for by an increased net energy intake and/or reduced energy allocation to other expensive tissues and functions (; ). It is one of the few hypotheses that focus on the costs of the brain. first proposed a trade-off relationship between the brain size and the size of expensive guts in primates (“the expensive tissue hypothesis”). later expanded the hypothesis to a broader framework, which considered total energy intake and also expanded the expensive metabolic costs to tissues beyond guts and functions such as growth and reproduction (e.g., life history traits). The framework makes several predictions, including a positive correlation between brain size and basal metabolic rate (BMR; a proxy for total energy intake), a negative correlation between brain size and the sizes of other expensive tissues, and a negative correlation between brain size and life history traits that represent investments in growth and reproduction (; ). The framework is developed mostly in a mammalian context and is based on the fundamental premise that resources are limited and the energetic cost of the brain is disproportionally large, which is particularly acute in homeothermic mammals and birds. This framework is likely applicable to most vertebrates. For example, the central nervous system alone contributes to 2%–8% of basal metabolism in most vertebrate species (). The energetic constraints in poikilothermic vertebrates are expected to be strong because of their overall low and highly variable metabolic rates, and their brains also require constant energy supply (; ; ). In fact, empirical studies have already demonstrated some trade-offs between brain size and other expensive functions in various fishes, amphibians, and reptiles (; ; ; , ).
The predictions of the EBH have been widely tested in various vertebrate groups, particularly the negative correlation between brain size and other expensive tissues and functions, and results are mixed. For example, few studies detected a negative correlation between brain and gut size among mammals and birds, but some found trade-offs between brain size and life history traits in these taxa (e.g., ; ; see review by ). Among poikilothermic vertebrates, a negative correlation between the sizes of the brain and alimentary tract was detected across amphibian species and in Lake Tanganyika cichlids (; ). Additionally, a negative association between brain size and visceral fat storage was detected in the Pacific seaweed pipefish () and among anuran amphibians (). An experimental study using the guppy (Poecilia reticulata) also provided strong evidence for a trade-off between brain size and gut size (), but trade-offs between brain size and the sizes of other expensive organs were not detected in several other fishes and amphibians (e.g., ; ; ; ). Trade-offs with other expensive functions have also been examined for various vertebrate groups, including migratory behavior in birds and bats (; ), hibernation in anurans and mammals (; ), reproductive capacity in bats (), litter size in marsupial mammals (), and circadian rhythms in reptiles and amphibians ().
Several issues may have caused inconsistent results regarding trade-offs between the brain and other expensive tissues and functions. One is the energetic constraint assumption. Animals may compensate for the costs of a large brain by reducing energy allocation to other tissues when the total energy available is limited. However, the ability to explore and acquire limited resources is highly variable among animals, which implies that energetic constraints may not always exist or exist but are not strong enough to produce detectable trade-offs (; ). Few studies have examined variations of total energy intake and its correlation with brain size (e.g., ). Additionally, which expensive tissue the brain may trade off with depends on the fitness consequences of size variation of the tissue (), which in turn depends on the environments in which animals live. Such ecological context for the assumed trade-offs is often lacking. Therefore, a priori consideration of ecological context and associated processes and an evaluation of assumed energetic constraints are essential for testing EBH trade-offs.
Asiatic toads (Bufo gargarizans) living along altitudinal gradients constitute an excellent system to test the EBH. The toads are widely distributed in East Asia, with an altitudinal range of zero to over 4,000 m above sea level (). The altitudinal gradients provide an ecological context, which helps to understand the associated evolutionary processes and fitness consequences of organ size variation (; ). Also, high-altitude environments are stressful, with hypoxia, low temperature, short annual active time, and high daily and seasonal climatic variability, which impose strong, energetic constraints on animals at high altitudes (; ). Previous studies of the Asiatic toad have demonstrated variations (or lack of) along altitudinal gradients for a number of expensive tissues and functions. For example, relative total brain volume is negatively correlated with altitude, while the relative volume of the telencephalon is positively correlated with altitude (), and toads from higher altitudes exhibit larger postmetamorphic body sizes, slower growth rates, and older average ages than those from low altitudes (). On the other hand, toads from different altitudes show no significant difference in standard metabolic rate (SMR) () and no difference in internal organ sizes () or total mass of limb muscles (). Egg size and clutch size are also not correlated with altitude (but correlated with length of growth season; ).
In this study, we examined the whole brain size and sizes of four energetically expensive visceral organs (heart, liver, alimentary tract, kidney) of Asiatic toads from 15 sites along three altitudinal gradient transects. We also examined energy storage variation along the gradients and tested for potential trade-offs between brain size and other expensive organs. Specifically, we address three questions: (1) How do the sizes of the brain and the four visceral organs vary along altitudinal gradients? (2) Does brain size display trade-off relationships with the visceral organs? (3) Does energy storage variation along altitudinal gradients influence any trade-offs? Nutrient metabolism and cardiac function have been identified as the two most important adaptive mechanisms for these toads in high altitudes (; ). Based on these observations, we predict that (1) the sizes of the heart, liver, and alimentary track will increase with altitude. We also predict, based on the EBH, that (2) brain size will trade-off with sizes of the visceral organs, and (3) the trade-off will be stronger in high-altitude populations than in low-altitude populations because of the scarcity and high variability of food resources at high altitudes.
Materials and methods
Study sites and sampling
A total of 434 individuals (233 males and 201 females) from 15 sites along three altitudinal transects were sampled from west of the Sichuan Basin in 2018 and 2019 (Supplementary Table S1; Supplementary Figure S1). All toads were breeding adults sampled during the breeding season near breeding ponds. Each transect followed one river valley from a low-altitude site to a high-altitude site. We selected river valleys with large altitudinal differences and steep ascendance. Four to six sites were sampled in each transect, and these sites were typically 300 m to 500 m apart by altitude. All sites from a transect were within a straight-line distance of 85 km to reduce confounding ecological background variables (). The lowest altitude site was at an altitude of 785 m above sea level (site 1.1), while the highest altitude site was at an altitude of 3,239 m (site 2.6).
Toads were captured by hand and euthanized near the collecting site immediately after capture. For euthanasia, toads were submerged in a 0.25% MS-222 solution for 10–25 min (). Death was confirmed when toads had their eyes closed and stopped moving. All animal processing procedures followed approved animal utilization protocols (Chengdu Institute of Biology, number 20171205).
Body size and body condition measurements
Snout-vent length (SVL) was used to represent body size and was measured from photos taken from a dorsal view using a ruler as a reference. We measured SVL three times using ImageJ version 1.53g () and used the average value. Body mass was measured by an electronic balance to the nearest 0.1 g after euthanasia. The scaled mass index (SMI) was used to assess body condition (). SMI is a condition index based on body mass and morphometric measurements (e.g., body length); studies have demonstrated that it is comparable among different populations or species (; ) and represents overall energy storage well in anuran amphibians ().
SMI was calculated as
where Mi and Li were body mass and SVL of individuals, respectively, while L0 was an arbitrary value of L (e.g., here, the mean value within each population); bSMA was the estimated slope of the standardized major axis (SMA) regression of ln-transformed values of body mass on body length (SVL) using lmodel2 package ().
Brain and visceral organ size measurements
Whole brain volume was used to represent brain size. We dissected the brains out and removed the cranial nerves, pineal organ, meninx, and pituitary glands (the pituitary infundibulum was preserved). Photographs of brains were taken from dorsal and lateral views while keeping the coronal plane and sagittal plane parallel to the camera sensor. Length (L), width (W), and height (H) of the brains were measured to the nearest 0.001 mm from the photographs using ImageJ. Each brain was measured three times by the same investigator (ZY), and the average value was used. The volume of the brain was calculated using an established ellipsoid model as V = (L × H × W) π/(6 × 1.43) (; ). The parameters of this formula were empirically calibrated based on the application of the Cavalieri method to the brains of amphibians (). Brain size data from transects one and two were previously published (), and data from transect three were acquired in this study.
In order to ensure comparability with previous studies investigating similar species (; ), dry mass was used to represent the size of visceral organs, including the heart, liver, alimentary tract, and kidney. All toad specimens were stored in neural buffered formalin (10%) over 6 months. Organs were first dissected out: the liver excluded the gall bladder; the alimentary tract included stomach, small and large intestine, and the contents in the tract were carefully removed; kidneys included the pair, and the heart included the overall heart (including conus arteriosus and sinus venosus). These organs were then washed with tap water overnight and dried in a baking oven (55 °C) until their weights stabilized. All dried organs were weighted to the nearest 0.0001 g by an electronic balance (STP2004). Organs that were damaged during the dissection process were excluded. In total, we obtained data for 367 brains, 298 hearts, 336 livers, 306 alimentary tracts, and 338 pairs of kidneys.
Data analysis
We first examined the relationships between SVL, SMI, and altitude to evaluate the assumed energetic constraint and its variation along the altitudinal gradients using general linear models (GLMs). In all models, SMI and SVL were the dependent variables, while sex and altitude were the independent variables. Sex was treated as a categorical variable, while altitude was considered as a continuous variable. We included sex in the model because this species has documented sexual size dimorphism (). Both SVL and SMI were log-transformed to meet the assumption of normal distribution. All GLM analyses were conducted using R package stats.
We then examined relationships between the relative size of organs and altitude to test for potential impacts of altitude on organ size using GLMs. Log-transformed organ sizes, including brain volume and dry mass of heart, liver, alimentary tract, and kidneys, were dependent variables, while sex and altitude were independent variables, and log-transformed SVL was covariable. Model assumptions, including normality of residuals and homoscedasticity, were checked, and there was no significant violation of these assumptions.
Finally, we employed structural equation modeling (SEM) to test relationships between brain size and the sizes of visceral organs along altitudinal gradients. SEM allows us to summarize all four visceral organs into one unmeasured variable (latent variable) and test multiple causal relationships simultaneously. To prepare the data for model fitting, we conducted allometric correction for sizes of brain and visceral organs based on populations (= sampling sites) using R package GroupStruct version 0.1.0 (). All relative sizes, SVL, and SMI were further standardized to a mean of zero and a variance of one. Since the allometric correction process and the maximum likelihood method for SEM model evaluation did not accept missing data (; ), we removed individuals with missing data after confirming that the missing data were randomly distributed (p > 0.05, missing completely at random test with R package naniar; ).
For SEM construction, we first defined a latent variable (“budget”), which represents the energy allocation budget to the four visceral organs, and constructed a measurement model for variable “budget” (Figure 1A). The sizes of the four visceral organs were indicator variables, and the variable “budget” was set as the predictor of these indicators. All connections in the model were linear regressions. We employed a confirmatory factor analysis (CFA) to validate the model. Multiple model fit indices, factor loadings, average variance extracted, composite reliability, and modification indices were estimated (; ; ). All indices suggested that the measurement model was a good fit and robust (Figure 1A; Supplementary Table S2; Supplementary Table S3). Secondly, a basic SEM model (SEM1) with brain size being the predictor variable and the latent variable “budget” being the effect was constructed based on the EBH hypothesis (Figure 1B). Three alternative models, in which SVL (SEM2), SMI (SEM3), and sex (SEM4) were covariables, respectively, were also proposed (Figure 1C–E). The categorical variable sex was transformed with dummy coding. All connections in these models were linear regressions. Lastly, to detect differences of relationships between brain size and the latent variable “budget” at different altitudes, we fitted data to a multiple-group SEM. All observations were assembled into three altitudinal groups: a high-altitude group (2,452–3,239 m), a middle-altitude group (1,223–2,136 m), and a low-altitude group (785–935 m). A principal component analysis of bioclimatic data of all sampling sites clustered all sites into three groups (data and analysis not shown), and the three-group design also provided reasonable sample sizes for each group. We applied a measurement invariance test to a multigroup CFA model for the latent variable “budget” (Figure 1A), and confirmed that the model coefficients were comparable among groups (“metric invariance”; ). We also used a chi-square difference test to assess difference between a free model, in which all path coefficients were allowed to vary across altitudinal groups, and a constrained model, in which the path coefficients were fixed to be equal ().
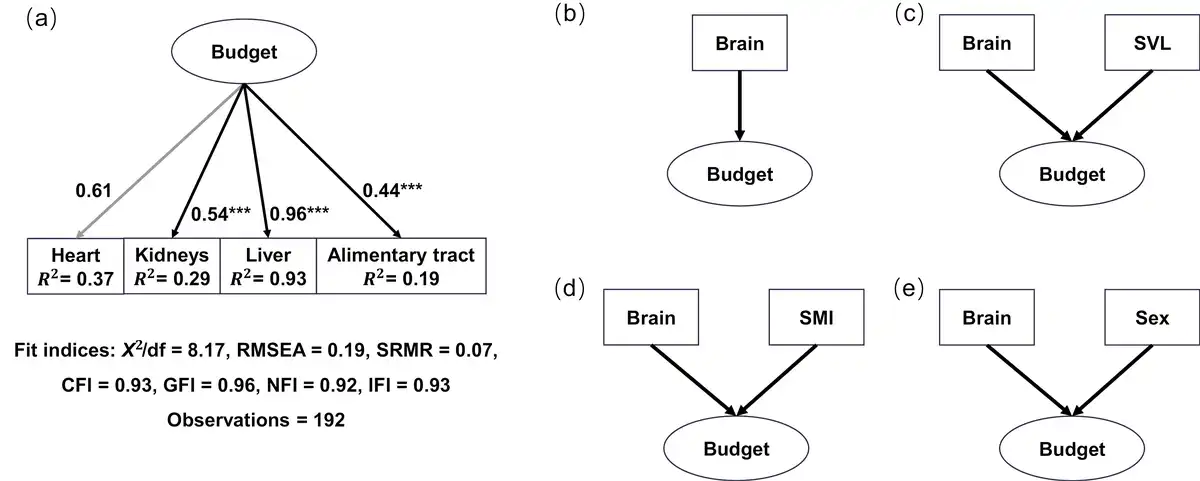
Figure 1
Connections of structural equation models. (A) Estimated causal connection between the latent variable (“budget”) and four observed variables from a CFA. Numbers beside the lines are standardized factor loading values. Heart (gray line) is used to scale the model, and no p-value is estimated. Significance level: *p < 0.05, **p < 0.01, ***p < 0.001. (B)–(E) Postulated alternative causal connection between brain size and the latent variable (“budget”) with potential impacts from SVL, SMI, and sex.
We employed Akaike information criterion (AIC), Bayesian information criterion (BIC), and a series of commonly used indices to test model fit and compare alternative models, including ratio of /df, comparative fit index, goodness of fit index, normed fit index, incremental fit index, root mean square error of approximation, and standardized root mean square residual (SRMR) (; ; ; ). Finally, model coefficients were estimated from the best-fit model. All model evaluations and estimates were conducted using R package Lavaan version 0.6-17 ).
All data processing and analyses were conducted in R version 4.1.2 (). We completed GLMs plotting using R package ggplot2 (, p. 2) and R package ggeffects (). SEM path diagrams were constructed using R package semPlot version 1.1.6 () and semptools version 0.2.10.1 ; ).
Results
SVL, SMI, and organs size change along altitudinal gradients
Both SVL and SMI significantly decreased with altitude (Figure 2A and B; Supplementary Table S4). GLMs indicated significant negative correlations between SVL and altitude (estimate ± SE = − 0.036 ± 0.008, p < 0.001) and between SMI and altitude (estimate ± SE = − 0.089 ± 0.021, p < 0.001). Toads from high-altitude sites had smaller SVL and SMI than those from low-altitude sites. For example, the mean SMI at the lowest (site 1.1) and highest (site 2.6) sites were 66.150 ± 1.112 (mean ± SE) and 47.391 ± 0.889, while the mean values of SVL were 88.755 ± 2.346 mm and 81.754 ± 1.945 mm, respectively. There was also significant sexual dimorphism in both SVL and SMI; males had smaller SVL and SMI than females (Supplementary Table S4).
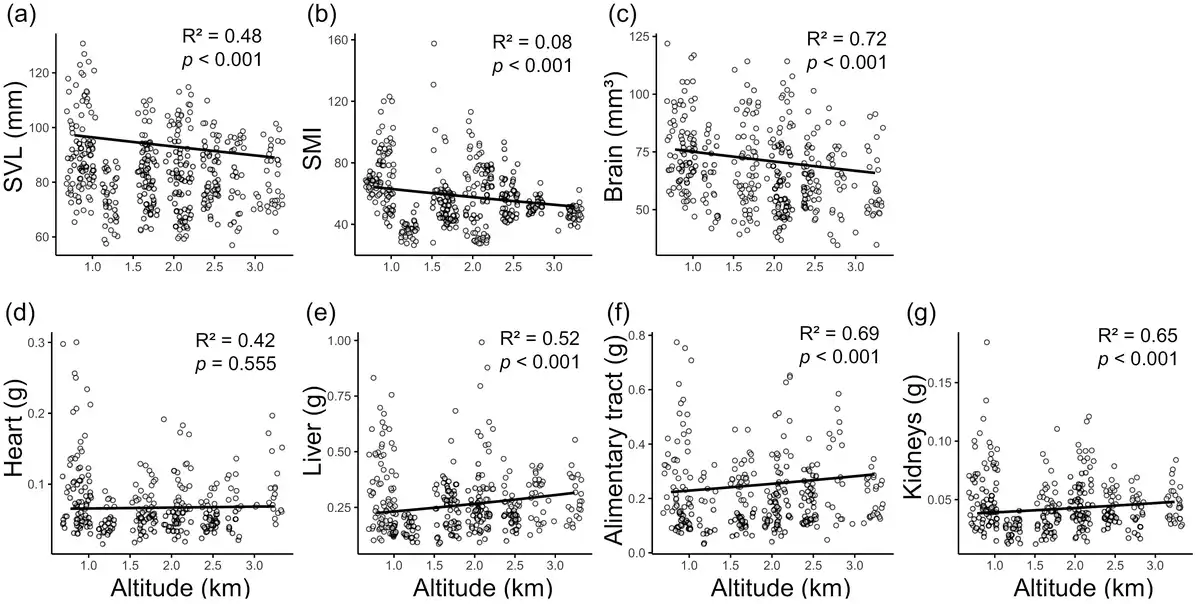
Figure 2
Correlations between SVL (A), SMI (B), brain size (C), and four visceral organ sizes (D)–(G) and altitude. Organ sizes are allometric-adjusted with SVL as covariable. The lines represent GLM predictions.
Brain volume also significantly decreased with altitude (Figure 2C; Supplementary Table S4). GLMs indicated a significant negative correlation between brain volume and altitude while controlling SVL (estimate ± SE = − 0.058 ± 0.010, p < 0.001). Toads from high-altitude sites had smaller relative whole brain volumes than those from low-altitude sites. For example, the mean brain volume at the lowest (site 1.1) and highest (site 2.6) altitudes were 77.239 ± 3.012 and 60.429 ± 2.741 mm3, respectively. Sexual dimorphism in brain size was also noticed; males had significantly smaller brains than females (Supplementary Table S4).
Sizes of the liver, alimentary tract, and kidneys revealed significant positive correlations with altitude while controlling SVL (p < 0.001; Figure 2E–G; Supplementary Table S4). The size of the heart also had a positive relationship with altitude, but the correlation was nonsignificant (p = 0.555; Figure 2D; Supplementary Table S4). Male toads often had smaller relative organ sizes than females, although the difference was significant only in the alimentary tract (p < 0.001; Supplementary Table S4).
Co-variation between brain size and visceral organs
Both AIC and BIC indicated that the basic SEM model (SEM1; Figure 1B) was the best-fit model, in which brain size had a causal connection to the latent variable “budget” without impacts from SVL, SMI, or sex. The model also had an acceptable fit measured by most indices (Supplementary Table S2). Based on this model, data were fitted to the multiple-group SEM, and model coefficients were extracted. In the high-altitude group, brain size had a negative path coefficient on the latent variable “budget” and was a significant predictor of the latter (prestandardized value, estimate ± SE = −0.40 ± 0.18, z = −2.22, p < 0.05; Supplementary Table S5), although it explained only a small proportion of variance in “budget” (R2 = 0.11; Supplementary Table S5). This suggested a trade-off relationship between brain size and energy allocation to the visceral organs in high-altitudinal toads. On the other hand, path coefficients from the brain to the latent variable “budget” were positive but nonsignificant in both the middle-altitude group (prestandardized value, estimate ± SE = 0.06 ± 0.07, z = 0.81, p = 0.415; Supplementary Table S5) and the low-altitude group (prestandardized value, estimate ± SE = 0.17 ± 0.11, z = 1.60, p = 0.109; Supplementary Table S5). Furthermore, the chi-square difference test resulted in a significant difference between the free model and constrained model (p < 0.05), indicating a significant difference in the relationship between the brain and “budget” at different altitudes. Figure 3 presents standardized factor loading and path coefficient values of the model for better comparison.
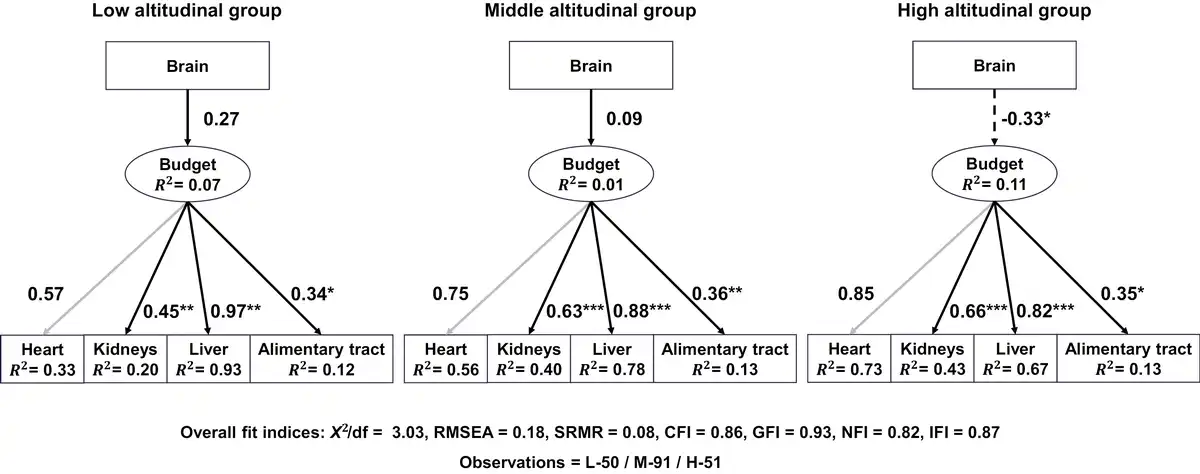
Figure 3
Estimated causal connection between brain size and the latent variable (“budget”) for three altitudinal groups. Solid lines indicate positive correlations, while dashed lines represent negative correlations. Numbers beside these lines are standardized factor loading and path coefficient values. Heart (gray lines) is used to scale the model, and no p-values are estimated. Significance level: *p < 0.05, **p < 0.01, ***p < 0.001.
Factor loadings for all organs were statistically significant (p < 0.01; heart as the scaling parameter did not receive a p-value), and three organs, heart, liver, and kidney, consistently demonstrated high factor loadings, particularly in the middle- and high-altitudinal groups (Figure 3; Supplementary Table S5). In the high-altitude group, the heart had the highest standardized factor loading (0.85), suggesting a strong correlation between heart size and the latent variable “budget.” Any variation in the latent variable “budget” would like produce the largest relative size change in the heart, compared to other organs. In contrast, it was the liver that had the highest standardized factor loading in the low-altitude group, suggesting the liver had the strongest correlation with the latent variable “budget.” Additionally, the heart, liver, and kidney had high R² values (0.20–0.93; Figure 3), suggesting that the model explained substantial variance in these three organs but little in the alimentary tract (Figure 3; Supplementary Table S5). Together, these results suggested that brain size was a significant predictor of the latent variable “budget” in high-altitude toads, and the latent variable “budget” was a significant predictor of the sizes of heart, liver, kidney, and alimentary tract.
Discussion
Both SVL and SMI decline with the increase in altitude. The brain also consistently decreases in relative size with an increase in altitude, but the visceral organs (heart, liver, alimentary tract, and kidney) mostly increase in relative size with altitude. Furthermore, brain size demonstrated a trade-off relationship with energy allocation to the visceral organs among high-altitude toads. These results are largely consistent with predictions of the expansive brain hypothesis (EBH).
Trends of organ size change along altitudinal gradients
The brain of Asiatic toads displays a clear trend of decrease in relative size along altitudinal gradients (Figure 2C) and is consistent with the EBH. The brain is a metabolically expensive organ that uses disproportionally large amounts of energy. At high altitudes, resources are particularly limited, and their availability is highly variable; therefore, a small brain volume is likely adaptive under such energy limitations. We do not have direct evidence of the fitness consequence of brain size variation along altitudinal gradients in these toads. However, despite a decrease in whole brain size, Asiatic toads from high altitudes have relatively large telencephalons, which suggests a balance between the maintenance of cognitive functions and decreased energy expenditure achieved by reducing overall brain size (). Their high-altitude habitats are generally homogeneous, barren, with few breeding ponds (our field observation). A large telencephalon, which is associated with spatial memory and behavioral flexibility in amphibians (), likely allows the toads to quickly locate breeding sites while a small total volume reduces energy expenditure. On the other hand, a large brain with an overall better cognitive ability is likely advantageous at low altitudes, where habitats are complex and resources are abundant. Previous works on brain size showed a similar altitudinal trend in rodents ().
Several visceral organs (i.e., liver, alimentary tract, kidneys) show a clear trend of increase in relative size in our study (Figure 2E–G); however, several recent works on B. gargarizans revealed different patterns. For example, detected a negative correlation between visceral organ size and altitude; found no significant correlation between altitude and the size of the heart, lungs, liver, or kidneys of B. andrewsi (often considered a synonymy of B. gargarizans; ). Studies of other amphibians also revealed an inconsistent pattern. detected a positive correlation between heart size and altitude in the spot-legged treefrog (Polypedates megacephalus). However, in the plateau frog (Nanorana parkeri), heart size was smaller in high-altitudinal populations than those of low-altitudinal conspecifics (). These inconsistent patterns suggest that the sizes of these organs are likely outcomes of interrelated and complex energetic trade-offs (more discussion below) as well as environment-dependent fitness consequences. For example, recent genetic data suggested that the heart likely plays a key role in high-elevation adaptation in Asiatic toads (; ). suggested that large hearts likely have fitness benefits at high altitudes for amphibians, and reached the same conclusion for mammals. A closer look at our data suggests that the heart size of Asiatic toads may have a “U”-shaped relationship with altitude (Supplementary Figure S2; Supplementary Table S6). At high altitudes, the fitness benefits of a large heart may outweigh the energetic costs, and at low altitudes, abundant resources may simply allow a large heart even with minimum fitness benefits. Furthermore, the inconsistent patterns may be the consequence of phenotypic plasticity. These organ sizes are highly plastic and are influenced by available resources during development and at the time of examination.
Energetic constraints and trade-offs between the brain and other expensive organs
Energetic constraint is a fundamental assumption of the EBH (). The impacts of the constraints on trade-offs, however, depend on total energy acquisition and energy allocation; variation in either may change the trade-offs or render the constraints powerless to produce the expected trade-offs. Even though resources may be limited, organism’s acquisition strategy and ability are highly variable ().
It is clear that Asiatic toads at high altitudes have low total energy acquisition and experience strong energetic constraints. Both SVL and SMI, two indicators of body growth and energy acquisition, consistently decrease with altitude (Figure 2A and B). In particular, SMI represents the overall energy storage well in anuran amphibians (), and low SMI likely represents a decreased energy availability. Furthermore, a recent physiological examination of Asiatic toads from different altitudes detected no significant difference in their SMR (similar to BMR) when acclimated to the same temperature (i.e., no counter-gradient variation; ). Therefore, populations from high altitudes with low environmental temperatures likely have low body temperatures, low metabolic rates, and a short active season. All of these can result in low energy acquisition (e.g., low SMI). As a consequences of stronger energetic constraints imposed by low energy acquisition at high altitudes, the high-altitude toads evolve a trade-off between energy allocation to the brain and to other energetically expensive visceral organs (Figure 3). These patterns are consistent with the predictions of EBH. Furthermore, these visceral organs respond to energetic trade-offs differently, likely depending on their fitness consequence. At high altitudes, the heart appears to have the largest and most consistent response to variation of energy allocation to the visceral organs (standardized factor loading = 0.85, R2 = 0.73; Figure 3). Any reduction in energy allocation to the brain can predict an increased energy allocation to the visceral organs, which in turn can consistently predict a large increase in heart size. The heart is known to play a crucial role in high-altitude adaptation in toads as well as other vertebrates (; ; ), and any size changes likely have significant fitness consequences.
No trade-offs between brain size and energy allocation to the visceral organs are detected in the middle- and low-altitude groups, which is most likely a consequence of high total energy acquisition at these locations. Particularly in the low-altitude group, a positive relationship is observed, although statistically nonsignificant (p = 0.109; Supplementary Table S5). This is the classic car-house trade-off paradox (; ). When variation in resource acquisition is greater than variation in resource allocation, a positive correlation often occurs between traits that compete for the resource. A similar lack of trade-off relationship was also observed in several other vertebrates (; ). Although EBH considers variation in total energy intake and predicts a positive correlation between brain size and energy acquisition (e.g., BMR), few have tested the prediction so far (e.g., ). Clearly, additional research is needed in this area.
Implications for the EBH and future research
EBH is evidently applicable to poikilotherms, which represent the majority of animal diversity despite being developed in a mammalian context. Nevertheless, fundamental physiological differences of poikilotherms demand a refocus for testing the EBH in these animals. First, poikilotherms have high within-species variability of total energy acquisition, which is likely much higher than that of homeotherms (; ). As evidenced by Asiatic toads, such variability has significant impacts on trade-off relationships. Therefore, to test the EBH in poikilotherms, their total energy intake should be emphasized as much as energy allocation. Second, poikilotherms have different energy allocation models than homeotherms, and energy demand and consumption of different expensive organs can vary drastically (; ). Some poikilotherms are also known to have regional heterothermy (e.g., ). All these could lead to energy allocation change without organ size change. Third, environmental temperature likely plays a major role in determining brain size, not only through energy metabolism but also through development and function (fitness). For example, temperature is known to have a positive effect on neuronal development and activity (), and lizards and fishes with lower developmental temperature show relatively poor cognitive performance (; ). Recently, detected a positive relationship between brain size and body temperature across amphibians and reptiles that are active during daytime.
We strongly encourage more intra-specific comparisons evaluating the EBH. Most current supporting evidence for the EBH, i.e., trade-offs between brain and expensive functions, is from inter-specific comparisons (). Our study is one of the few intra-specific studies supporting the EBH. Paradoxically, among species, trade-offs are more likely consequences of niche specialization and community interaction rather than limited resources (; ). Additionally, intra-specific comparison excludes confounding evolutionary history and allows us to focus on variables of interest (). Furthermore, to move from correlation to causal relationships, a controlled experiment will be necessary (e.g., ), which can be conducted only at the intra-specific level. It is also important to recognize that trait associations at different biological scales often involve different evolutionary processes ().
A holistic look at the fitness consequences of size variation of the brain is essential to better understand brain size evolution. Recent research on the costs of a large brain has been very focused on energy constraints and resulting trade-offs (reviewed by ). This is sensible for encephalized species because energy constraints may play an over-sized role in determining the fitness consequence in these species. For the majority of animals with relatively small brains, however, the influences on fitness go beyond energy. This includes the examination of function-oriented brain region sizes (e.g., telencephalon in Asiatic toads) further than energy expenditure-oriented total brain volume. Similarly, the fitness consequences of size variation of other energetically expensive organs (e.g., heart in high-altitude toads) likely limit the degree of trade-offs that the brain may have. This has rarely been evaluated, and it requires an ecological context, such as an altitude gradient, in this study. Lastly, it should be recognized that community ecology, as opposed to energetic constraints, can also produce trade-offs (). An ecological context is essential to understand the fitness consequences of those trade-offs.
Conclusion
Brain size of Asiatic toads does trade-off with other energetically expensive organs, but only in high-altitudinal populations, where total energy acquisition is low. The EBH is evidently capable of explaining some brain size variation within poikilotherms; however, with their potential large variability of energy acquisition, careful consideration of the energetic constraint assumption is necessary to make plausible predictions. Brain size evolution is complex, and energetic constraint and its resulting trade-offs with other expensive tissues are only part of the answer. A holistic look at the fitness benefits and costs of a large brain, as well as the fitness consequences of all other expensive tissues with which the brain has trade-off relationships, will be essential to a better understanding of brain size evolution.
Acknowledgments
We would like to thank L. Shu, Dr. Z. Liao, and Professor J. Huang for consultation with statistical analysis. We also thank B. Sun, Dr. Y. Cao, Dr. S. Tan, Y. Lin, Q. Yang, Y. Zhang, Y. Chen, and X. Zhu for field assistance. Drs. J. Cui and W. Yang kindly helped us with the project design. Drs. F. Laberge, O. Todorov, and two anonymous reviewers provided many valuable suggestions.
References
- Agrawal A. A. (2007). Macroevolution of plant defense strategies. Trends in Ecology and Evolution, 22(2), 103–109. https://doi.org/
- Agrawal A. A. (2020). A scale-dependent framework for trade-offs, syndromes, and specialization in organismal biology. Ecology, 101(2), e02924. https://doi.org/
- Aiello L. C., Wheeler P. (1995). The expensive-tissue hypothesis: The brain and the digestive system in human and primate evolution. Current Anthropology, 36(2), 199–221. https://doi.org/
- Amiel J. J., Shine R. (2012). Hotter nests produce smarter young lizards. Biology Letters, 8(3), 372–374. https://doi.org/
- Axelrod C. J., Laberge F., Robinson B. W. (2018). Intraspecific brain size variation between coexisting sunfish ecotypes. Proceedings of the Royal Society of London. Series B, 28, 20181971. https://doi.org/
- Barrickman N. L., Lin M. J. (2010). Encephalization, expensive tissues, and energetics: An examination of the relative costs of brain size in strepsirrhines. American Journal of Physical Anthropology, 143(4), 579–590. https://doi.org/
- Beltrán I., Herculano-Houzel S., Sinervo B., Whiting M. J. (2021). Are ectotherm brains vulnerable to global warming? Trends in Ecology and Evolution, 36(8), 691–699. https://doi.org/
- Brezden B. L., Fenwick J. C., Moon T. W. (1975). The effects of acclimation temperature and conditioning temperature on the learning rate of the goldfish Carassius auratus. Comparative Biochemistry and Physiology A Comparative Physiology, 50(2), 373–377. https://doi.org/
- Broeke J., Mateos Pérez J. M., Pascau J. (2015). Image processing with ImageJ (2nd ed.). PACKT Publishing Open Source.
- Careau V., Killen S. S., Metcalfe N. B. (2014). Adding fuel to the “fire of life”: Energy budgets across levels of variation in ectotherms and endotherms. In: L. B. Martin, C. K. Ghalambor, A. Woods, Integrative Org Biology (pp. 219–233). Wiley-Blackwell. https://doi.org/
- Chan K. O., Grismer L. L. (2022). GroupStruct: An r package for allometric size correction. Zootaxa, 5124, 471–482. https://doi.org/
- Chen D. G., Yung Y. F. (2023). Structural equation modeling using R/SAS: A step-by-step approach with real data analysis (1st ed.). Chapman and Hall/CRC.
- Chen Y., Tan S., Fu J. (2022). Modified metabolism and response to UV radiation: Gene expression variations along an elevational gradient in the Asiatic toad (Bufo gargarizans). Journal of Molecular Evolution, 90, 389–399. https://doi.org/
- Cox C. L., Chung A. K., Davoll M. E., DeHart S. A., Gerardi S. T., Ly T. K., Logan M. L. (2023). A diminutive snake species can maintain regional heterothermy in both homogeneous and heterogeneous thermal environments. Journal of Experimental Biology, 226(11), jeb245380. https://doi.org/
- Dornburg A., Warren D. L., Zapfe K. L., Morris R., Iglesias T. L., Lamb A., Wong R. (2018). Testing ontogenetic patterns of sexual size dimorphism against expectations of the expensive tissue hypothesis, an intraspecific example using oyster toadfish (Opsanus tau). Ecology and Evolution, 8, 3609–3616. https://doi.org/
- Drakulić S., Feldhaar H., Lisičić D., Mioč M., Cizelj I., Seiler M., Rödel M. O. (2016). Population-specific effects of developmental temperature on body condition and jumping performance of a widespread European frog. Ecology and Evolution, 6, 3115–3128. https://doi.org/
- Epskamp S. (2015). semPlot: Unified visualizations of structural equation models. Structural Equation Modeling: A Multidisciplinary Journal, 22(3), 474–483. https://doi.org/10.1080/10705511.2014.937847
- Fei L., Ye C., Jiang J. (2012). Colored atlas of Chinese amphibians and their distributions. Publishing House of Science and Technology.
- Fristoe T. S., Iwaniuk A. N., Botero C. A. (2017). Big brains stabilize populations and facilitate colonization of variable habitats in birds. Nature Ecology and Evolution, 1(11), 1706–1715. https://doi.org/
- Fu J. (2023). Bufo gargarizans: What’s in a name? Asian Herpetological Research, 14(3), 246–255. https://doi.org/
- Gana K., Broc G. (2019). Structural equation modeling with lavaan. John Wiley & Sons.
- Garland T. (2014). Trade-offs. Current Biology, 24(2), R60–R61. https://doi.org/
- Genoud M., Isler K., Martin R. D. (2018). Comparative analyses of basal rate of metabolism in mammals: Data selection does matter. Biological Reviews of the Cambridge Philosophical Society, 93(1), 404–438. https://doi.org/
- Grabowski M., Kopperud B. T., Tsuboi M., Hansen T. F. (2023). Both diet and sociality affect primate brain-size evolution. Systematic Biology, 72(2), 404–418. https://doi.org/
- Heldstab S. A., Isler K., Graber S. M., Schuppli C., van Schaik C. P. (2022). The economics of brain size evolution in vertebrates. Current Biology, 32(12), R697–R708. https://doi.org/
- Heldstab S. A., Isler K., van Schaik C. P. (2018). Hibernation constrains brain size evolution in mammals. Journal of Evolutionary Biology, 10, 1582–1588. https://doi.org/
- Hou D., Jia T., Ren Y., Zhu W., Liu P. (2023). Phenotypic trait variations in the frog Nanorana parkeri: Differing adaptive strategies to altitude between sexes. Invertebrate Biology, 72(23008), 1–11. https://doi.org/
- Houle D. (1991). Genetic covariance of fitness correlates: What genetic correlations are made of and why it matters. Evolution, 45(3), 630–648. https://doi.org/
- Huang Y., Mai C. L., Liao W. B., Kotrschal A. (2020). Body mass variation is negatively associated with brain size: Evidence for the fat-brain trade-off in anurans. Evolution, 74(7), 1551–1557. https://doi.org/
- Isler K., van Schaik C. P. (2009). The expensive brain: A framework for explaining evolutionary changes in brain size. Journal of Human Evolution, 57(4), 392–400. https://doi.org/
- Jiang A., Zhong M. J., Xie M., Lou S. L., Jin L., Robert J., Liao W. B. (2015). Seasonality and age is positively related to brain size in Andrew’s Toad (Bufo andrewsi). Evolutionary Biology, 42, 339–348. https://doi.org/
- Jones K. E., MacLarnon A. M. (2004). Affording larger brains: Testing hypotheses of mammalian brain evolution on bats. American Naturalist, 164(1), E20–E31. https://doi.org/
- Kaas J. H. (2016). Evolution of nervous systems (2nd ed.). Academic Press.
- Kang H., Ahn J. W. (2021). Model setting and interpretation of results in research using structural equation modeling: A checklist with guiding questions for reporting. Asian Nursing Research, 15(3), 157–162. https://doi.org/
- Kotrschal A., Rogell B., Bundsen A., Svensson B., Zajitschek S., Brännström I., Kolm N. (2013). Artificial selection on relative brain size in the guppy reveals costs and benefits of evolving a larger brain. Current Biology, 23, 168–171. https://doi.org/
- Legendre P. (2018). Imodel2: Model II regression. Version 1.7-3. https://cran.r-project.org/web/packages/lmodel2/index.html
- Li P., Tan S., Yao Z., Fu J., Chen J. (2020). Comparisons of heart size of Bufo gargarizans from different altitudinal gradients in a common garden environment: Is Hesse's rule applicable to ectotherms? Sichuan Journal of Zoology, 39(4), 394–400.
- Liao W. B., Jiang Y., Jin L., Lüpold S. (2023). How hibernation in frogs drives brain and reproductive evolution in opposite directions. eLife, 12, RP88236. https://doi.org/
- Liao W. B., Jiang Y., Li D. Y., Jin L., Zhong M. J., Qi Y., Kotrschal A. (2022). Cognition contra camouflage: How the brain mediates predator-driven crypsis evolution. Science Advances, 8, eabq1878. https://doi.org/
- Liao W. B., Lou S. L., Zeng Y., Kotrschal A. (2016a). Large brains, small guts: The expensive tissue hypothesis supported within anurans. American Naturalist, 188(6), 693–700. https://doi.org/
- Liao W. B., Lu X. (2012). Adult body size = f (initial size + growth rate × age): Explaining the proximate cause of Bergman’s cline in a toad along altitudinal gradients. Evolutionary Ecology, 26, 579–590. https://doi.org/
- Liao W. B., Luo Y., Lou S. L., Lu D., Jehle R. (2016b). Geographic variation in life-history traits: Growth season affects age structure, egg size and clutch size in Andrew’s toad (Bufo andrewsi). Frontiers in Zoology, 13, 6. https://doi.org/
- Lüdecke D. (2018). ggeffects: Tidy data frames of marginal effects from regression models. Journal of Open Source Software, 3(26), 772. https://doi.org/
- Luquet E., Léna J. P., Miaud C., Plénet S. (2015). Phenotypic divergence of the common toad (Bufo bufo) along an altitudinal gradient: Evidence for local adaptation. Heredity, 114(1), 69–79. https://doi.org/
- MacCracken J. G., Stebbings J. L. (2012). Test of a body condition index with Amphibians. Journal of Herpetology, 46, 346–350. https://doi.org/
- Mai C. L., Liao J., Zhao L., Liu S. M., Liao W. B. (2017). Brain size evolution in the frog Fejervarya limnocharis supports neither the cognitive buffer nor the expensive brain hypothesis. Journal of Zoology, 302, 63–72. https://doi.org/
- McGuire L. P., Ratcliffe J. M. (2010). Light enough to travel: Migratory bats have smaller brains, but not larger hippocampi, than sedentary species. Biology Letters, 7(2), 233–236. https://doi.org/
- Mink J. W., Blumenschine R. J., Adams D. B. (1981). Ratio of central nervous system to body metabolism in vertebrates: Its constancy and functional basis. The American Journal of Physiology, 241(3), R203–R212. https://doi.org/
- Mitchell D. J., Vega-Trejo R., Kotrschal A. (2020). Experimental translocations to low predation lead to non-parallel increases in relative brain size. Biology Letters, 16, 20190654. https://doi.org/
- Muir A. P., Biek R., Thomas R., Mable B. K. (2014). Local adaptation with high gene flow: Temperature parameters drive adaptation to altitude in the common frog (Rana temporaria). Molecular Ecology, 23(3), 561–574. https://doi.org/
- Nengovhela A., Ivy C. M., Scott G. R., Denys C., Taylor P. J. (2023). Counter-gradient variation and the expensive tissue hypothesis explain parallel brain size reductions at high elevation in cricetid and murid rodents. Scientific Reports, 13, 5617 https://doi.org/
- Olesen S. P. (1986). Rapid increase in blood-brain barrier permeability during severe hypoxia and metabolic inhibition. Brain Research, 368(1), 24–29. https://doi.org/
- Peig J., Green A. J. (2009). New perspectives for estimating body condition from mass/length data: The scaled mass index as an alternative method. Oikos, 118(12), 1883–1891. https://doi.org/
- Pitnick S., Jones K. E., Wilkinson G. S. (2005). Mating system and brain size in bats. The Royal Society's Proceedings of the Royal Society B: Biological Sciences, 273, 719–724. https://doi.org/
- R Core Team (2021). R: A language and environment for statistical computing. R Foundation for Statistical Computing, Vienna, Austria. https://www.R-project.org/
- Rosseel Y. (2012). lavaan: An R package for structural equation modeling. Journal of Statistical Software, 48(2), 1–36. https://doi.org/
- Schumacker E., Lomax G. (2016). A beginner’s guide to structural equation modelling. (4th ed.) Routledge.
- Singer M. A. (2007). Comparative physiology, natural animal models and clinical medicine: Insights into clinical medicine from animal adaptations. Imperial College Press. https://doi.org/
- Song Z. T., Griesser M., Schuppli C., van Schaik C. P. (2023). Does the expensive brain hypothesis apply to amphibians and reptiles? BMC Ecology and Evolution,23(1), 23. https://doi.org/
- Tan S., Li P., Yao Z. Y., Liu G. H., Yue B. S., Fu J., Chen J. F. (2021). Metabolic cold adaptation in the Asiatic toad: Intraspecific comparison along an altitudinal gradient. Journal of Comparative Physiology B, Biochemical, Systemic, and Environmental Physiology, 191(4), 765–776. https://doi.org/
- Thakkar J. J. (2020). Structural equation modelling: Application for research and practice (with AMOS and R). Springer Singapore.
- Tierney N., Cook D., McBain M., Fay C., O’Hara-Wild M., Hester J., Smith L., Heiss A. (2024). Naniar: Data structures, summaries, and visualisations for missing data. https://cran.r-project.org/web/packages/naniar/index.html
- Todorov O. S., Blomberg S. P., Goswami A., Sears K., Drhlík P., Peters J., Weisbecker V. (2021). Testing hypotheses of marsupial brain size variation using phylogenetic multiple imputations and a Bayesian comparative framework. The Royal Society's Proceedings of the Royal Society B: Biological Sciences, 288, 0394. https://doi.org/
- Tsuboi M., Husby A., Kotrschal A., Hayward A., Buechel S. D., Zidar J., Kolm N. (2015). Comparative support for the expensive tissue hypothesis: Big brains are correlated with smaller gut and greater parental investment in Lake Tanganyika cichlids. Evolution, 69, 190–200. https://doi.org/
- Tsuboi M., Shoji J., Sogabe A., Ahnesjö I., Kolm N. (2016). Within species support for the expensive tissue hypothesis: A negative association between brain size and visceral fat storage in females of the Pacific seaweed pipefish. Ecology and Evolution, 6(3), 647–655. https://doi.org/
- Velotta J. P., Ivy C. M., Wolf C. J., Scott G. R., Cheviron Z. A. (2018). Maladaptive phenotypic plasticity in cardiac muscle growth is suppressed in high-altitude deer mice. Evolution, 72(12), 2712–2727. https://doi.org/
- Vincze O. (2016). Light enough to travel or wise enough to stay? Brain size evolution and migratory behavior in birds. Evolution, 70(9), 2123–2133. https://doi.org/
- Warren D. L., Iglesias T. L. (2012). No evidence for the “expensive-tissue hypothesis” from an intraspecific study in a highly variable species. Journal of Evolutionary Biology, 25(6), 1226–1231. https://doi.org/
- Wickham H. (2016). ggplot2: Elegant graphics for data analysis (2nd ed.). Springer-Verlag.
- Yang S. N., Feng H., Jin L., Zhou Z. M., Liao W. B. (2018). No evidence for the expensive-tissue hypothesis in Fejervarya limnocharis. Animal Biology, 68, 265–276. https://doi.org/
- Yang S. N., Huang X., Zhong M., Liao W. B. (2017). Geographical variation in limb muscle mass of the Andrew’s toad (Bufo andrewsi). Animal Biology, 67, 17–28. https://doi.org/
- Yang W., Qi Y., Lu B., Qiao L., Wu Y., Fu J. (2017). Gene expression variations in high-altitude adaptation: A case study of the Asiatic toad (Bufo gargarizans). BMC Genetics, 18(1), 1–8. https://doi.org/
- Yao Z., Qi Y., Yue B., Fu J. (2021). Brain size variation along altitudinal gradients in the Asiatic Toad (Bufo gargarizans). Ecology and Evolution, 11(7), 3015–3027. https://doi.org/
- Zhao L., Mai C. L., Liu G. H., Liao W. B. (2019). Altitudinal implications in organ size in the Andrew’s toad (Bufo andrewsi). Animal Biology, 69, 365–376. https://doi.org/
- Zhong M. J., Wang X. Y., Huang Y. Y., Liao W. B. (2017). Altitudinal variation in organ size in Polypedates megacephalus. The Herpetological Journal, 27, 235–238.