Introduction
Populations that have been isolated by either natural or anthropogenic processes often become smaller, less genetically diverse, and less fit over time (). If left unchecked, small populations in isolation enter a negative feedback loop that could ultimately lead to extirpation or even extinction (; ). The deteriorating genetic health of small, inbred populations (“genetic erosion”; ) is due to the combined negative effects of genetic drift and inefficient natural selection, and inbreeding (). Regardless of whether alleles are deleterious, neutral, or advantageous, drift in small populations can increase the random loss of rare alleles and/or the fixation of common alleles, thereby reducing overall genetic variation. This loss of genetic variation reduces the potential of a population to adapt to future environmental change (; ). Similarly, small effective population size (Ne) reduces the efficacy of natural selection on genetic variation as showed that selection is a potent evolutionary force only when Ne(s) > 1, where s is the selection coefficient. Most mutations that arise in a population are harmful to its fitness (; ) and purifying selection tends to remove (or purge) these deleterious mutations (). However, inefficient selection in small populations leads to an accumulation of deleterious mutations over time as measured by the total number of deleterious loci, the allelic diversity at each of these loci, and the frequency of the deleterious alleles at a locus (). Thus, the accumulation of deleterious mutations increases the overall genetic load of small and isolated population (; ). Small, isolated populations are thus doubly impacted by both the loss of adaptive potential and the accumulation of genetic load that together contribute to higher extinction probability (; ; ; ).
Beneficial (or “adaptive”) mutations under positive selection are difficult to identify from population genomic data (; ; ) and their positive functional impact on fitness is unknown for most wild species (; ; but also see ). Putatively deleterious mutations within protein coding regions (i.e., exons) are more apparent for many reasons, including phylogenetic constraints, premature stop codons, substitutions of hydrophilic for hydrophobic residues, and so on (; ). Thus, the negative effects of genetic load are often used as a primary indicator of genetic health () because the positive effects of beneficial mutations (which we call “genetic thrust”) are harder to infer. Genetic thrust is the idea that increases in individual or population fitness can, in principle, be due to the accumulation of advantageous or beneficial mutations via positive directional selection. Recent empirical genomic studies have quantified the number of deleterious mutations in various gene pools and revealed that small and genetically less diverse populations carry fewer strongly deleterious mutations (i.e., with putatively high negative impact on fitness) than their larger and genetically more diverse counterparts (; ; ; ; ; ). These observations suggest that purifying selection can be very strong in wild populations with low Ne (; ). However, population genomic studies have also identified higher genetic load in inbred individuals of many endangered species like Iberian lynx (), Grauer’s gorillas (), and Brown Eared Pheasants () or even extinct species like Woolly mammoths (). Collectively, these results indicate that genetic load may be context-dependent (e.g., depend on life history traits, demographic responses to past environmental changes, local adaptation, interpopulation dynamics, etc.). If so, a better understanding of how evolutionary and demographic processes drive the empirical distribution of deleterious mutations in natural gene pools is required.
The total number of deleterious loci, the allelic diversity across these loci, and the frequency of deleterious mutations segregating within a population all contribute to the genetic load of the given population (see ; ). At the individual level, genetic load is defined by the number of deleterious loci present across the individual genome and the genotype combinations at each of these locus (). Because virtually all species have had dynamic demographies (; ), deleterious mutations must have experienced varying effects of selection and drift as Ne fluctuates throughout the evolutionary history of the species (). Indeed, simulation studies show that the effects of demographic perturbations, such as bottlenecks and expansions, often yield opposing patterns of genetic variation depending on whether the focus is on populations or individuals (). For example, bottlenecked human populations tend to carry a greater number of deleterious loci than populations of constant size; however, human genomes from bottlenecked populations had a greater number of deleterious alleles present across their genomes as compared to human genomes from a population of constant size (; ). That is, bottlenecks can decrease the number of loci with deleterious alleles in a population, but can increase the number of deleterious alleles present within individual genomes. In principle, genetic load of a population is dynamically shaped by selection and drift as a function of demographic history, and knowledge of the evolutionary history of a species is a necessary backdrop for proper interpretations of the genetic load at both population and individual level and its relevance to future population persistence.
In this study, our goal was to describe how the genetic load in contemporary populations has been shaped by the evolutionary and demographic history of the focal species. We analyzed 66 individual whole genomes from multiple populations of Montezuma Quail (Cyrtonyx montezumae; Figure 1A), a small ground-dwelling galliform bird in the New World Family Odontophoridae. Montezuma Quail are diet and habitat specialists () with small home ranges (). Like many montane species, Montezuma Quail populations are declining range-wide () as their habitat has dramatically reduced in the last century due in large part to land use practices such as domestic livestock grazing (; ; ). In Arizona, Montezuma Quail are abundant and sustainably harvested on public land () whereas in Texas, populations are small, isolated (Figure 1A) (), exist largely on private lands, and have been listed as “Vulnerable” on the “Species of Greatest Conservation Need” list by the Texas Parks and Wildlife Department (https://tpwd.texas.gov/huntwild/wild/wildlife_diversity/nongame/tcap/sgcn.phtml; last accessed: November 8, 2022) with no legal hunting season within the state for decades (). Montezuma Quail populations are less diverse (e.g., lower genome-wide heterozygosity) than many other avian species and extant populations in Arizona and Texas are genetically distinct from one another (). Here, we examined the evolutionary history of Montezuma Quail populations over the last ~100 kya using contemporary genome sequences, and then used individual-based forward-time simulations to project impacts on genetic load, adaptive potential, and overall fitness. Our study contextualizes population genomic diversity in wild populations and has relevance to conservation strategies (e.g., supplementations or translocations).
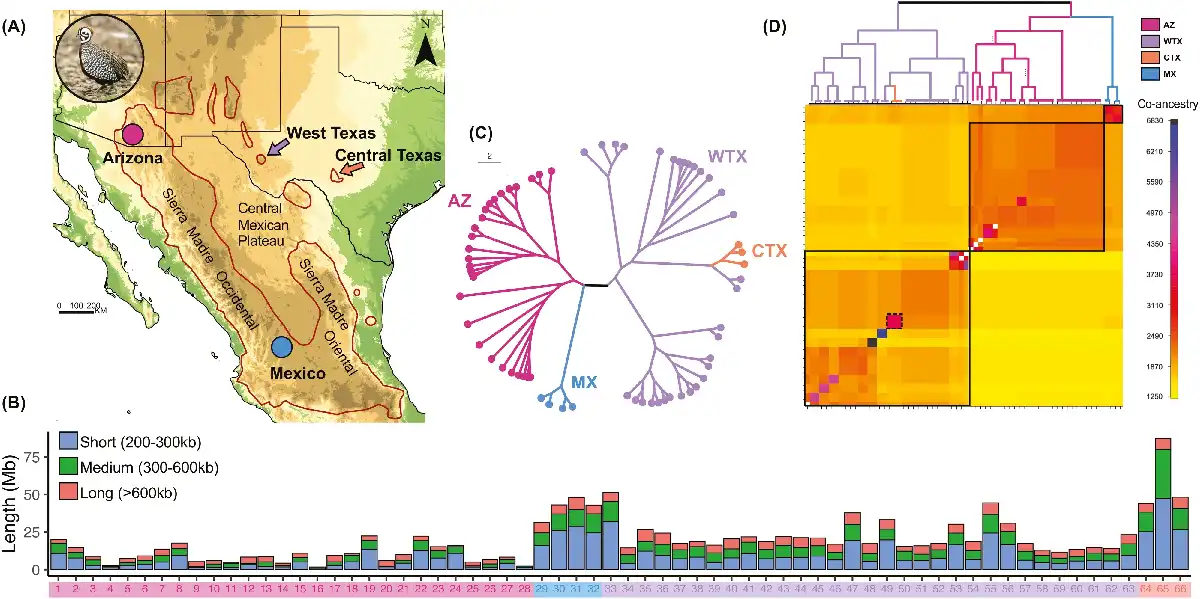
Figure 1
Genome-wide inbreeding and shared ancestry patterns in Montezuma Quail populations. (A) The Montezuma Quail (inset) is a small galliform bird predominantly distributed in Mexico with peripheral populations in the United States We analyzed 66 whole genomes from Arizona (AZ = 28, pink circle), West Texas (WTX = 31, purple arrow), Central Texas (CTX = 3, orange arrow), and Mexico (MX = 4, blue circle). (B) Barplots showing the length of genome covered by runs of homozygosity (ROH) of different length classes (short, 200–300 kb; medium, 300–600 kb; and long, >600 kb). AZ samples (#1–28) had the lowest proportion of their genome covered by ROHs, whereas MX (#29–32) and WTX samples (#33–63) had significantly more of their genome in ROHs and CTX individuals (#64–66) had the most ROHs. All Montezuma quail samples carried signature of recent inbreeding as evidenced by long ROHs. (C) Genealogical tree and (D) co-ancestry heatmap of all Montezuma Quail samples constructed from pairwise haplotype sharing. Darker colors indicate higher co-ancestry between a pair of individuals. The three major clades in the genealogical tree (above) are shown within black boxes and the Central Texas samples are shown in the dotted box. Both Arizona and Mexico samples shared higher within population co-ancestry; Texas quail were more heterogeneous. Lack of co-ancestry between Texas and Arizona populations (bottom right diagonal) indicates long-term isolation. Montezuma Quail image courtesy: Bob Gress, BirdsInFocus.
Materials and methods
Samples, sequencing, sequence processing, and genotype calling
Arizona samples were taken from donated hunter-harvested wings (). Lysed blood tissues were collected from West Texas in 2018–2020 and from Central Texas in 2020 under a Texas Parks and Wildlife Department Scientific Permit SPR-0410-139 for research. Lysed blood from Mexico samples was collected under scientific collection permit number SGPA/ DGVS/ 06160/19 and were imported to the United States under USDA APHIS permit 140134 issued on December 08, 2019. Note that many of the details associated with our methods are in the extensive supplement and here we only provide a brief overview of our approach.
Genomic DNA was extracted from 98 Montezuma Quail samples from Arizona (AZ; N = 60), West Texas (WTX; N = 31), Central Texas (CTX; N = 3), and Mexico (MX; N = 4) using a modified potassium acetate protocol (). Paired end libraries (2 × 150 bp) were created using a hyper Library construction kit from Kapa biosystems (Roche) and sequenced on S4 lanes using Illumina NovaSeq 6000. Raw sequences were trimmed to remove adapter sequences and low-quality bases, then mapped to the chromosome-level chicken genome (Gallus gallus assembly GRCg6a, genome size = 1.065 Gb). We used GATK v4.1.6 () to discover Single Nucleotide Polymorphisms (SNPs) and call genotypes. After quality filtering, we analyzed genotypes at 9,324,827 SNPs in 66 individuals (AZ = 28, WTX = 31, CTX = 3, MX = 4) that were mapped on chicken autosomes 1–33 with 11.2× ± 2.0× (mean ± SD) depth of coverage (Data S1). Variant statistics, nucleotide diversity (π), pairwise relatedness, and heterozygosity (measured as the proportion of heterozygous nucleotides per individual genome) were calculated using VCFtools ().
Identification of runs of homozygosity
We used PLINK v.1.9 () to identify runs of homozygosities (ROHs) using multiple sets of parameter values (“Supplementary Methods” section). To identify the best set of parameters for our dataset, we performed a sensitivity analysis using package sensitivity () in R ((R Core ); see “Supplementary Methods” section). We chose the final parameters that minimized the individual variation in FROH estimates between runs (Supplementary Methods). For the final ROH identification, we used the parameters --homozyg-window-het 2, --homozyg-snp 50, --homozyg-kb 100, --homozyg-window-snp 20 --homozyg-het 2 --homozyg-density 50 --homozyg-gap 1000 --homozyg-window-missing 2 --homozyg-window-threshold 0.05. We used detectRUNS package () in R to visualize PLINK output files and identify ROHs within each individual. We categorized ROHs into different classes based on length: short ROHs (200–300 kb), medium ROHs (300–600 kb), and long ROHs (>600 kb) to delineate short-term and long-term demographic effects (). In general, long ROHs represent recent inbreeding whereas shorter ROHs are indicative of ancient inbreeding that has been broken down by generations of mutation and recombination.
Functional variant annotation, fitness effect classification, and genetic load estimation
We used Ensembl variant effect predictor (VEP) v101.0 () to identify synonymous and non-synonymous (missense + nonsense) mutations within the exome. We considered only non-synonymous SNPs as potentially functional because they are easily identifiable using bioinformatic approaches and tractable to characterize across the annotated genome. We acknowledge that coding sequences represents only <2% of the whole genome and our approach ignores the putative functional effects of regulatory or non-coding intergenic regions. However, unlike synonymous and non-coding substitutions, non-synonymous mutations change the associated amino acid sequences (and thus their associated physical properties, which influence protein structure and function) whose long-term functional impact could be quantified via evolutionary constraint across the phylogeny. We predicted deleteriousness of potentially functional mutations using SIFT (Sorting Intolerant from Tolerant) scores (). SIFT scores were generated for all possible amino acid changes relative to the chicken reference genome (assembly GRCg6a) and then categorized based on their deleteriousness (i.e., “deleterious” or “tolerated”). Clearly, SIFT scores do not directly estimate the fitness effects across many thousands of mutations but they do provide a quantitative proxy for the genotype-fitness relationship. Deleterious mutations were non-synonymous mutations with SIFT score < 0.05, whereas tolerated mutations were non-synonymous mutations with SIFT score ∈ [0.05, 0.1]. Tolerated mutations are expected to impart nearly neutral effects relative to deleterious mutations and thus subject to more relaxed purifying selection. These thresholds are conservative estimates and prescribed as best-practices by the tool developers (); furthermore, these same demarcations have been used in similar studies in other species (; ) and thus allow comparisons among studies.
Populations or genomes with more deleterious alleles across loci have a higher genetic load than populations or genomes with fewer deleterious loci. One major issue with comparing genetic load based on the number of deleterious mutations is that it is biased against larger populations with more diverse genomes (). Individuals from more diverse populations are expected to carry not only a greater number of neutral mutations but also a greater number of deleterious mutations across their genomes (). To estimate individual genetic load, we not only compared the number of homozygous and heterozygous deleterious SNPs within individual genomes from both populations but also compared individual potential load (LoadP) and realized load (LoadR). These two metrics measure the proportion of deleterious sites present among all non-synonymous SNPs within an individual genome (LoadP) and the proportion of deleterious alleles that are in homozygous state within individual genomes (LoadR), respectively (see Supplementary Note 1; ).
Besides the number of deleterious mutations, populations with higher frequency of deleterious alleles would have higher load and lower fitness than populations with the same deleterious mutations but at lower allele frequencies (). RXY is a population-specific statistical estimate of genetic load that measures the relative frequency of a mutation between a pair of populations (). We estimated RXY from allele frequency data of deleterious and tolerated functional SNPs using custom scripts (see “Data Accessibility” section).
Haplotype phasing, shared ancestry, and genealogical history of Montezuma Quail populations
Avian species lack PRDM9-directed recombination (; ) and thus avian genomes are relatively stable over evolutionary time (). Fixed recombination hotspots and the conservation of synteny between quail and chicken () allowed us to use the chicken recombination map (). We also assumed that sex-linked regions are syntenic between chicken and Montezuma quail genomes. We phased Montezuma Quail genotypes into haplotypes and imputed missing genotypes using recombination maps for chicken autosomes 1–28 (except for chromosome 16 due to lack of polymorphic markers; ; ) using Beagle v.5.1 (). We ran Beagle for each chromosome separately with burnin = 200, iterations = 500, phase-states = 200, and ancestral Ne = 100,000 as our best demographic model indicated that Montezuma Quail had a large ancestral population (see “Results” section). To assess the accuracy of phasing, we estimated switch error rate (i.e., the fraction of genotypes with switched haplotypes at a SNP for each individual between a pair of runs) from 10 independent runs of the phasing algorithm using VCFtools. The mean switch error was estimated to be 7.4% (SD = 1.5%). We used fineSTRUCTURE v4.1.1 () to estimate the co-ancestry among individuals using phased haplotypes (N = 132 haplotypes; “Supplementary Methods” section).
Reconstructing recent demographic history
We used Genetic Algorithm for Demographic Model Analysis (GADMA) () to find the best demographic model for two populations: Arizona and Texas (“Supplementary Methods” section). To infer a demographic model that best fits the joint distributions of the observed site frequency spectra (SFS), we simulated SFS under multiple possible demographic models to identify one that could best explain the observed SFS. We only considered synonymous mutations (N = 210,505) for calculating observed SFS as they are expected to segregate purely due to demographic changes and not due to selective changes. Here, we combined CTX and WTX samples into a single population (TX) due to high shared co-ancestry between the two populations (see “Results” section). We used AZ (N = 28) and TX (N = 34) samples and projected the observed SFS in [25 × 25] grid size. To calculate confidence intervals (CI) for estimated parameters, we bootstrapped our SFS 100 times by random sampling of 25 individuals from each population. For each model, we started with a series of simple initial structure that includes the number of time intervals that occur before and after each single splitting event and ran forward-time simulations using moments within GADMA (“Supplementary Methods” section). We used a generation time of one year as Montezuma Quail are effectively an annual species and a point mutation rate of µ = 3.14 × 10⁻⁹ bp–1 year–1 as previously estimated for Montezuma Quail ().
Estimating genealogical age of deleterious mutations
We leveraged the phased data from 132 haplotypes to estimate the age of deleterious alleles by inferring the time to the most recent common ancestor (TMRCA) of deleterious mutation. We used Genealogical Estimation of Variant Age (GEVA) () to reconstruct genealogical trees of variable sites along each chromosome and estimate the age of deleterious mutations. GEVA estimates age of a mutation by identifying identical by descent genomic regions that are shared between a pair of haplotypes. The allele is assumed to be derived from a mutation event in the genome of the common ancestor and shared by all descendent haplotypes. A probabilistic estimate of the time of origin of a mutation is obtained by combining the cumulative distributions for pairs of haplotypes that share the mutation (“concordant pairs”) and the pairs that do not (“discordant pairs”) (). We used recombination rate estimates from the chicken () and an estimated point mutation rate of 3.14 × 10⁻⁹ (). We used the effective population sizes inferred from EM optimization by ChromoPainter as a scaling parameter and joint molecular clock to estimate the age of deleterious mutations in different Montezuma Quail populations (“Supplementary Methods” section). We ran GEVA analysis 10 independent times to estimate the mean age and 95% CI.
Simulating temporal dynamics of non-neutral mutations
To better understand how drift and selection shape the distribution of non-neutral mutations during recent changes in demographic history, we performed forward-time simulations using SLiM v.3.6 (). We used SLiM to model the distribution of functional mutations that arise (via mutation) and segregate conditioned on Montezuma Quail demographic model of the AZ and TX populations (see “Supplementary Methods and Results” section). The genetic and demographic parameters of the evolutionary genomics model simulated here are illustrated in Figure S1. We simulated the exome of a Galliform-like bird that carries a total of 2,256 genes of equal length (1,500 bp) distributed proportionally to the number of genes found in each chicken chromosome. Recombination between genes occurred at a uniform rate of r = 1 × 10⁻³ crossovers per bp per generation (). Mutations arose in our simulation at a rate of µ = 3.14 × 10⁻⁸ corresponding to Montezuma Quail estimates (); both r and µ were scaled up by a factor of 10 to account for the 1/10th population size of the simulated model (see below). We simulated neutral (s = 0), deleterious (s < 0), and beneficial mutations (s > 0) with the ratio of neutral:deleterious:beneficial mutations fixed at 1000:2310:2.31 (Figure S1A; ). The associated selection coefficients for the deleterious mutations were drawn from a gamma distribution with mean = –0.03 and shape parameter (α) = 0.186 as estimated for humans (). For beneficial mutations, we kept the same distribution and α parameter but changed the mean to +0.03. We did not remove beneficial or deleterious mutations once fixed in the population as they still contribute to individual fitness (i.e., fixed non-neutral mutations can still increase/decrease individual fitness as homozygotes). We modeled a complex but biologically relevant dominance scheme that determines the dominance coefficient (h) based on the selection coefficients (s). The most deleterious mutations (s <= –0.05) were considered completely recessive (h = 0) whereas the most beneficial mutations (s >= 0.05) were considered completely dominant (h = 1). Dominance coefficients for the remaining mutations (–0.05 < s < 0.05) was determined as a step function between h = 0 and h = 1 with h increasing by 0.1 for every 0.01 increase in s; truly neutral mutations were completely additive (h = 0.5; Figure S1B).
Since SLiM explicitly models each individual within the population, it is memory intensive and thus, we rescaled population sizes to improve simulation performance (). We rescaled our effective populations size (Ne) to 1/10th of that inferred from GADMA, and increased population genetic estimates of mutation rate (µ), recombination rate (r), and selection coefficient (s) 10× so that the products Neµ, Ner, and Nes remain unchanged (Figure S1C). Rescaling genetic parameters allowed us to simulate a feasible miniaturized demographic model, but of course this skews absolute values (e.g., artificially reducing the time required to fix beneficial alleles) as compared to true population sizes (see SLiM documentation for details; https://github.com/MesserLab/SLiM/releases/download/v4.0.1/SLiM_Manual.pdf). However, since rescaling should affect both populations equally, our relative comparisons of genetic metrics between the two populations should still be meaningful. At generation 1, a single ancestral population (p0) was created with size = 1,1750 that ran for 1,17,500 generations at a constant population size to reach equilibrium (“burn-in”). At the end of the 117,500th generation, p0 expanded instantaneously to 1,20,000 individuals and evolves at constant size for another 7,500 generations. At the end of 1,25,000th generation, p0 splits in an 80:20 ratio to create two new populations p1 and p2. In our scenario, p1 represents the larger AZ population (“AZ-like”) and p2 represents the smaller TX population (“TX-like”). Immediately after the split, TX-like population size changes to = 2,750 and remains constant until the last 200 years when it begins to exponential decline (λdecay = 1.10 × 10⁻³) until present day ( = 2211). The AZ-like population starts at = 96,000 post-split and exponentially declines till present day to = 3,600 (λdecay = 2.19 × 10⁻³). The migration rates were set to m12 = 4 × 10⁻³ and m21 = 4 × 10⁻⁴ where m12 represents migration from p1 to p2 and vice-versa. To simulate recent complete lack of gene flow between the two populations, we set both migration rates to 0 in the last 200 years (Figure S1C). During the simulations, after the founding split, we kept track of genetic diversity indices (heterozygosity, FROH), relative fitness, and average number of different impact type mutations from random sampling of 100 individuals from each population (p1, p2) every 50 generations following . Relative fitness is measured as , i.e., mean absolute fitness of 100 sampled individuals within a population ( ) at a given time (T = t) as compared to mean absolute fitness immediately before the split (T = t0). Thus, relative fitness > 0 represents that individuals in the population are relatively more fit than they were at the time of the founding bottleneck. The entire simulation post-split was run 100 times to capture the variation between individual runs.
Statistical analysis
All pairwise comparisons of means were performed using Wilcoxon rank sum test using false discovery rate method of p-value correction in R unless mentioned otherwise. Statistical details are provided in the Supplementary Tables.
Results
We generated whole genome sequences from Montezuma Quail populations across the species’ range that varies with respect to contemporary sizes and habitat contiguity (Figure 1A). We studied individual genomes (N = 66) from four distinct geographic regions: Arizona (AZ; N = 28), West Texas (WTX; N = 31), Central Texas (CTX; N = 3), and Mexico (MX; N = 4; Figure 1A). We began by estimating genome-wide genetic diversity, inbreeding, and genetic load at both the population and individual level to compare patterns of diversity and to provide context regarding the Montezuma Quail gene pools. We then constructed models of demographic history of the two populations (Arizona and Texas) where we had the largest sample sizes to estimate the dynamics of population size, migration rate, and divergence time of the two populations. Next, we estimated the age of deleterious mutations (i.e., coalescent times) that are currently segregating in both populations and assessed how the frequency of deleterious mutations varied over time. Finally, we ran individual-based forward-time simulations of an evolutionary genomic model to illustrate how different processes such as drift, selection, and population size shape genetic diversity, fitness, differentiation, and load in isolated and diverging populations.
Contemporary genomic variation in Montezuma Quail populations
Individuals from the larger AZ population had significantly higher genome-wide estimates of heterozygosity and lower inbreeding as compared to quail from the smaller and more isolated WTX population (Tables S1–S3 and Figure S2). As expected, samples from the smallest and most isolated Montezuma Quail population in Central Texas (CTX) were the least diverse and most inbred samples among all Montezuma Quail populations (Figure S2). Heterozygosity in the MX samples was intermediate between AZ and WTX, and genome-wide inbreeding was intermediate between CTX and WTX (Tables S1–S3 and Figure S2). We found a significant pattern of reduced genome-wide heterozygosity in all TX samples (Figure S3) which is also indicated by more of the TX quail genome covered by short ROHs (200–300 kb) relative to AZ quail genomes (Figure 1B). All Montezuma Quail individuals carry long ROHs (>600 kb) but medium ROHs (300–600 kb) are more abundant in Texas quail (Figure 1B).
Shared ancestry and demographic history of Montezuma Quail populations
Genealogical trees based on shared ancestry indicate that AZ and TX populations are each monophyletic clades and that the MX population is a sister clade to the AZ population (Figure 1C). The CTX population has an ancestry tied closely to that of a single WTX clade. All individuals within a population share more ancestry than among populations, meaning there is a lack of contemporary gene flow among populations (Figure 1D). We also identified a few familial groups that shared highest co-ancestry within WTX samples, but excluding those samples had no effect on our diversity estimates (see “Supplementary Methods” section).
We inferred the demographic trajectory of the two divergent Montezuma Quail lineages by simulating the site frequency spectrum (SFS) of a 2-population demographic model with migration and dynamic population sizes. The most probable demographic model over the last ~100,000 years (Figure 2A and Figure S4) indicates that the ancestral Montezuma Quail population expanded ~90.5 kya (95% CI = 81,835–1,03,372) and was relatively large and stable for ~75,000 years until it split around 16.6 kya (14,515–28,951; Figure 2A and Table S4), ultimately producing the modern AZ and TX populations. The model estimates that Arizona and Texas populations split in a ~80:20 ratio, meaning that modern Texas populations were formed from fewer founders than the Arizona population (i.e., Texas birds went through a stronger bottleneck, ~4-fold more intense than Arizona; Figure 2A and Table S4). Since the split, Texas populations have consistently maintained smaller sizes (NTX = 27,711 [24,391–33,532]), whereas the modern Arizona population has resulted from an exponentially decline to present size (NAZ = 35,656 [33,510–44,141]). These results show the different population dynamics of AZ and TX populations where Texas populations have remained small for ~16,000 years after a strong initial bottleneck, whereas the modern AZ population (which is currently much larger than TX) has been progressively declining in size over the same timeframe (possibly via successive founder events associated with range expansion). Our model also recovered an unequal rate of historic gene flow between the two populations, indicating a ~10× higher historical migration rate from AZ to TX relative to gene flow from TX to AZ (Figure 2A and Table S4).
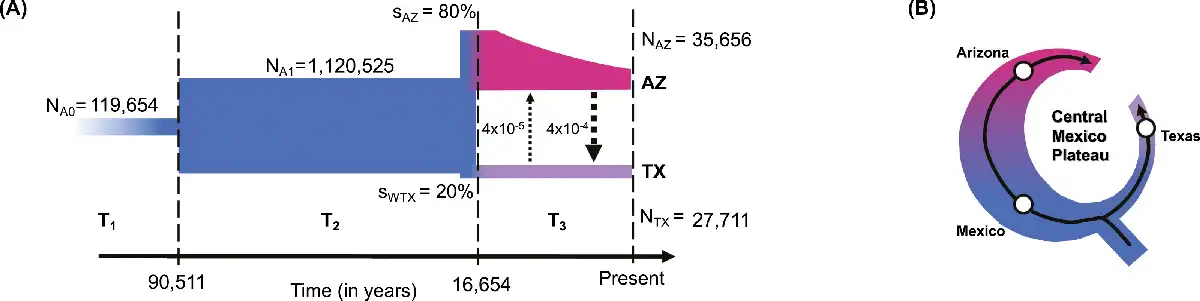
Figure 2
Demographic history of Montezuma Quail. (A) Demographic model of Arizona and Texas populations indicates the ancestral population (NA0) underwent demographic expansion (NA1) ~ 90 kya followed by an unequal split (sAZ:sWTX = 80:20) around 17 kya. Texas populations were formed by stronger bottlenecks and had maintained small sizes (NTX) since their split whereas contemporary Arizona populations (NAZ) were formed after a series of bottlenecks from larger ancestral population. We assumed a generation time of 1 year for Montezuma quail; arrow size is proportional to migration rate between AZ and TX. (B) The phylogeography (see Figure 1) and demographic history of Montezuma quail resembles that of a ring species, with an ancestral population expanded along the Sierra Madre Occidental in the west to form the contemporary Arizona population and a smaller eastern expansion along the Sierra Madre Oriental forming the modern Texas populations. The Central Mexican Plateau apparently acted as the major landscape barrier between the two lineages.
Contemporary genetic load in Montezuma Quail populations
Genetic load of a population is largely dependent on the number of deleterious mutations across the genome and the frequencies of deleterious alleles at each locus within the population (). The contemporary AZ population not only contains more functional non-synonymous SNPs (deleterious, neutral, and putatively beneficial mutations) across loci but also more deleterious mutations across loci than in the smaller contemporary WTX population (Figure 3A and Table S5). This is largely consistent with recent evidence that larger populations not only have higher genetic diversity but also have more loci harboring deleterious alleles than smaller populations. However, the relative frequency of deleterious mutations (RXY) is higher in the smaller WTX population than larger AZ population (RXY = 1.10 ± 0.002; Figure 3B) which means deleterious mutations are comparatively rarer in the larger AZ population. However, all functional mutations mostly exist at similar frequencies in both populations (RXY-Tolerated = 1.08 ± 0.002; RXY-Nonsynonymous = 1.02 ± 0.001). Deleterious mutations become common in small populations as weak purifying selection plus pronounced drift increase their frequencies over time, compared to larger populations with more efficient selection and less drift where deleterious mutations are maintained at lower frequencies. Thus, even though the smaller WTX population has fewer deleterious loci than larger AZ population, alleles at those loci are segregating at higher frequencies in the smaller WTX population.
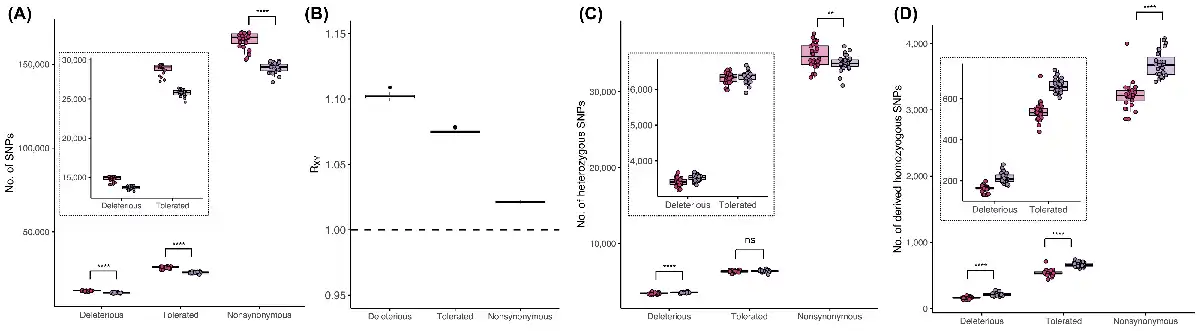
Figure 3
Genetic load in Montezuma Quail populations. (A) Number of deleterious (SIFT < 0.05), tolerated (SIFT ∈ [0.05,0.1]), and all non-synonymous SNPs present within individual genomes of AZ (pink) and WTX (purple) samples. AZ individuals carried significantly more SNPs of each category. Insets in each panel are zoomed figures showing boxplots of just the deleterious and tolerated mutations (B) Relative frequency (RXY) of different types of SNPs in WTX relative to AZ population. RXY > 1 represent that all category of functional mutations exists at higher frequency in WTX population, but the frequency of deleterious mutations was the highest among all type of functional mutations. Dotted line show RXY = 1. (C) No. of heterozygous SNPs and (D) number of derived homozygous SNPs of each functional category in both populations. WTX samples carried significantly more deleterious mutations in heterozygous state than AZ, but genetically more diverse AZ samples had more overall non-synonymous diversity. More inbred WTX samples had more deleterious, tolerated, and overall functional SNPs in homozygous state. (ns: p ≥ 0.5, *p < 0.05, **p < 0.01, ***p < 0.001, ****p < 0.0001).
From an individual perspective, WTX quail carry significantly more deleterious alleles masked in heterozygotes than do AZ quail, but there is no difference between tolerated alleles in heterozygote (Figure 3C). Since AZ individuals are more genetically diverse, they have significantly more overall functional heterozygosity. WTX individuals have more deleterious and tolerated alleles in homozygous states than do more outbred AZ individuals (Figure 3D). To compare if individuals in the larger AZ population carry a disproportionally higher number of functional mutations that are deleterious, we compared their individual potential load (LoadP). We found that individuals in both AZ and WTX populations have comparable LoadP but individuals in the larger AZ population carry a higher proportion of tolerated functional SNPs than individuals from the smaller WTX population (Figure S5 and Tables S6 and S7). Since WTX individuals are more inbred, homozygosity is higher and this is reflected in LoadR for both deleterious and tolerated SNPs (Figure S5). When we compared individual LoadR of homozygous deleterious mutations present in ROHs, we found that long ROHs carry significantly more deleterious mutations than tolerated mutations (Figure S6). Moreover, medium and short ROHs are more abundant in tolerated mutations than deleterious mutations (Figure S6). These results indicate that recent inbreeding is more likely to increase the genetic load of deleterious mutations as they accumulate disproportionately in longer ROHs. Details about genetic load in CTX and MX samples are provided in Figure S5 and Table S6.
Demographic impact on distribution of deleterious mutations in Montezuma Quail populations
We estimated the age of deleterious mutations that are currently present in AZ and WTX populations to understand how drift and selection shaped the number of deleterious alleles and their frequencies considering demographic histories of different populations. Our results indicate that almost all the deleterious mutations in Montezuma Quail populations originated within the past 150 kya (Figure S7). Within the last 100 kya, more deleterious mutations arose in AZ (N = 9400 ± 35) than in the WTX population (N = 8590 ± 23; Figure 4A). In both populations, more than half of the deleterious mutations currently segregating are ancestral; meaning they arose ~25 kya well before the population split. When categorizing into age bins, we found that both populations carry fewer deleterious mutations that arose around the time of bottleneck (15–25 kya) than at other time epochs, and the smaller WTX population has fewer mutations that arose post-bottleneck than the larger AZ population (Figure 4A). Next, we looked at how many of the deleterious mutations within each population are shared with the other population versus the number of private mutations exclusively within each population. Most of the deleterious mutations that are currently segregating in each population are young and private in origin, whereas most of the deleterious mutations that are shared between the two populations arose in the ancestral population (Figure S7). Most of the deleterious SNPs are shared but AZ has ~25% more private SNPs than WTX (Figure 4B). However, with more inbreeding in Texas quail (Figure 1B), WTX individuals have significantly more shared and private deleterious alleles as homozygotes (Figure 4C). The distribution of allele frequencies is similar in both populations with respect to deleterious alleles that arose in the ancestral population and are shared between the two populations (Figure 4D and Figure S8). However, younger private mutations are more abundant in the smaller WTX population (Figure S8) and private deleterious mutations reached higher frequency in the smaller WTX population over time (Figure 4E).
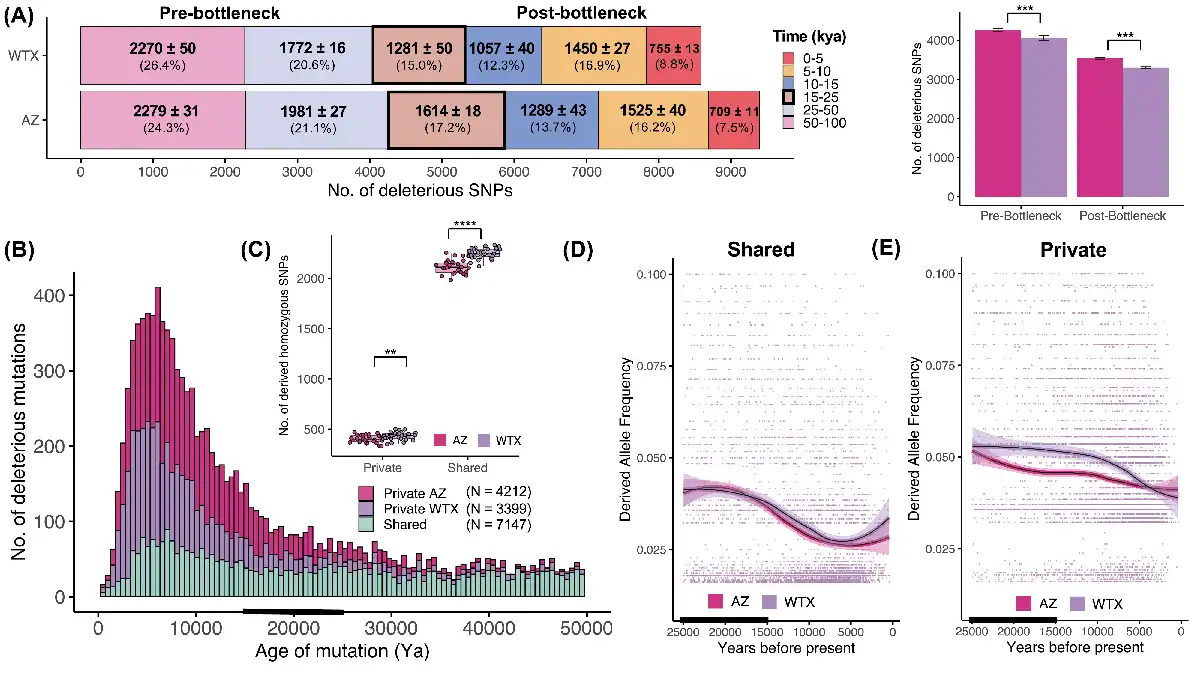
Figure 4
Temporal dynamics of deleterious mutations. (A) The age distribution of deleterious mutations that arose in the last 100 kya and are currently segregating in AZ and WTX. Numbers in bold represent the number of SNPs identified within each age bin from 10 independent runs (mean ± SD) and the mean percentage of the total SNPs. Most of the deleterious mutations originated >25 kya in the pre-bottleneck ancestral population (45%–47%), whereas ~37%–38% of all deleterious alleles arose in the last 15 kya post-bottleneck. The box with thick border indicates the bottleneck time-period when populations diverged (15–25kya). (B) Histograms showing the mean number of deleterious mutations that arose in the last 50 kya (see Figure S12 for variation across runs) which were either shared between AZ and WTX (green) or were privately segregating in AZ (pink) or WTX (purple) populations. Deleterious mutations that arose before the bottleneck (15–25 kya, black bar) were mostly shared between the two populations, but most of the young deleterious mutations that arose post-bottleneck were privately segregating within each population. AZ had a greater number of young and private deleterious mutations than WTX population. (C) WTX samples had a greater number of private and shared deleterious mutations that exist as homozygotes within individual genomes as compared to AZ samples. Derived allele frequency (DAF) trajectory of (D) shared and (E) privately segregating deleterious mutations in both populations over time. Individual mutations are shown as datapoints and thick lines and polygons represent moving average DAF and standard error in mean, respectively in both populations estimated from local polynomial regression. Shared deleterious mutations had similar trajectory in both populations where mutations became more abundant at similar rate over time whereas, in the case of privately segregating mutations, deleterious alleles reached higher frequency more rapidly in WTX population and remained at higher frequency over time. These results demonstrate that weaker selection in small populations leads to higher frequency of de novo deleterious mutations.
Forward-time, evolutionary genomic simulations of populations with different demographies
We simulated the evolution of the exome of a Galliformes-like species with neutral, deleterious, and beneficial mutations that evolved under a demographic model inferred from real Montezuma Quail populations (Figure S1). After initial expansion, the ancestral population split into two unequal-sized populations: the smaller population (“TX-like”) remained small and stable over evolutionary time, whereas the larger population (“AZ-like”) went through a slow exponential decline in population sizes. Both populations had very low and unequal rates of gene flow. Within the last 200 years, the TX-like population again started to slowly decline, and the two populations became completely isolated.
Our simulations show that in the first 500 generations after the founding bottleneck, the small TX-like population that underwent the stronger bottleneck lost genetic diversity more rapidly with a concurrent increase in inbreeding than the AZ-like population (Figure 5A and B). Genetic diversity in the larger AZ-like population responded much more slowly immediately post-bottleneck. However, despite a stronger bottleneck, the TX-like population still maintained relative fitness (i.e., fitness of a population at a given time relative to fitness at the time of bottleneck) in the first 500 years (Figure 5C). Our simulations indicate that inbreeding effectively exposed deleterious mutations in homozygotes and, consequently, that purifying selection purged deleterious mutations more rapidly from the TX-like population (Figure 5D and E) while simultaneously maintaining strongly beneficial mutations (Figure 5F). Thus, our simulations suggest that small populations that survive severe bottlenecks may prevent immediate loss of fitness by purging deleterious alleles present in the ancestral population without necessarily losing ancestral adaptive alleles.
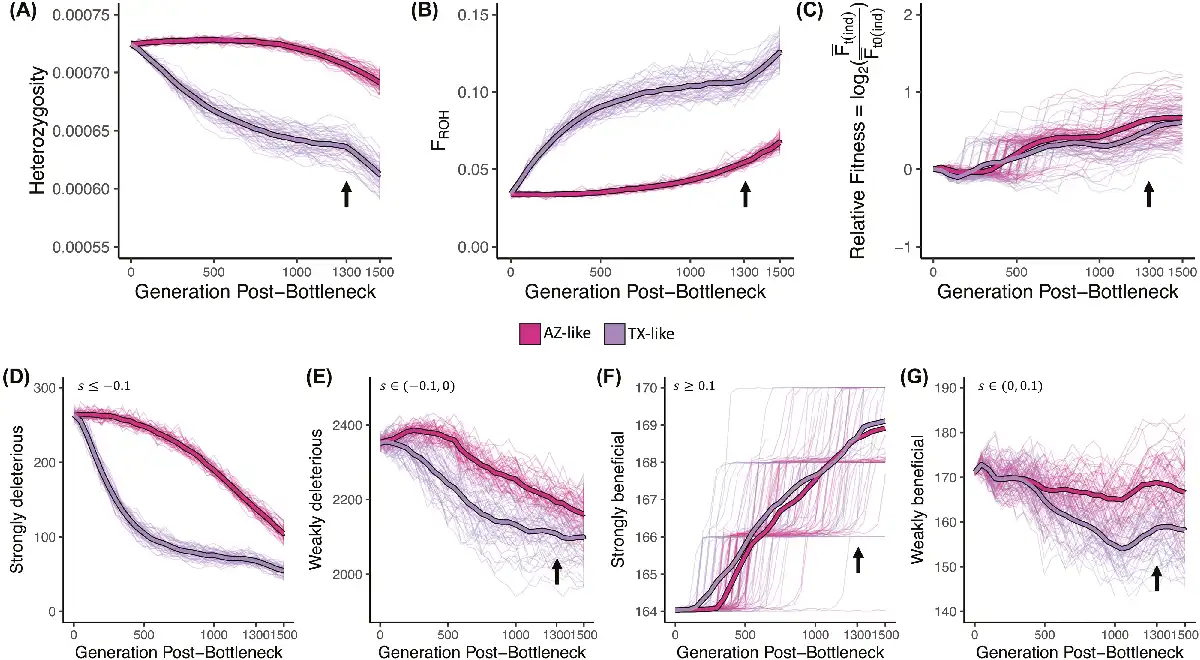
Evolutionary genomic simulations of a Galliformes-like exome under Montezuma Quail demography. Neutral and non-neutral (deleterious and beneficial) mutations within the exome were simulated under a scaled demographic model (see Figure S1 for details); population genetic metrics were estimated after the founding bottleneck (generation = 0). TX-like population underwent strong bottleneck at T = 0 and maintained population sizes until the last 200 years (T = 1,300 years post-split; black arrow) when they started to exponentially decline under complete isolation (i.e., migration rates = 0). AZ-like population underwent slow exponential decline at a constant rate until present day (T = 1,500). Thick lines represent mean estimate and light-colored lines represent results from 100 independent simulations. (A) Heterozygosity was measured as proportion of the exome that was heterozygous. (B) Inbreeding was measured as the proportion of exome in ROHs (FROH). (C) Relative fitness was measured as the change in mean absolute individual fitness ( ) at a given time t with respect to the mean absolute individual fitness at the time of the split ( ). Mean number of (D) strongly deleterious ( ), (E) weakly deleterious ( ), (F) strongly beneficial (s ≥ 0.1), and (G) weakly beneficial ( ) mutations segregating in the two populations over time. Strong and sudden bottlenecks led to lower diversity and higher inbreeding that led to more rapid genetic purging of deleterious mutations with a concomitant increase in relative fitness. Both demographic trajectories had minimal effect on the number of strongly beneficial mutations, but weakly beneficial mutations were more prone to drift.
Over the next 800 years (i.e., from T = 500 –1,300 years post-bottleneck), as the small TX-like population remained small, genetic drift was the dominant evolutionary force acting on the TX-like population that led to a slow loss of genetic diversity and increased inbreeding, which stabilized over time (Figure 5A and B). After the initial purging of strongly deleterious mutations, genetic drift continued to stochastically reduce both the number of weakly deleterious (Figure 5E) and weakly beneficial mutations over time in the small TX-like population (Figure 5G). Relative fitness of both populations also fluctuated more stochastically in this time (Figure 5C). For the larger but slowly shrinking AZ-like populations, diversity declines as inbreeding gradually increases and deleterious alleles are purged (Figure 5D and E), which leads to increases in relative fitness (Figure 5C). The AZ-like populations were less likely to lose weakly beneficial mutations (Figure 5G) because of the increased efficiency of selection when population sizes are larger. This means that as populations continue their independent demographic trajectory (with limited gene flow), larger populations are less impacted by drift and more impacted by selection. In the last 200 years (i.e., T = 1,300–1,500 years post-bottleneck), the TX-like populations were isolated and again started losing genetic diversity and became more inbred as the population declined (Figure 5A and B).
When we examined the allele frequencies of non-neutral mutations in the two populations over time, relative frequencies of deleterious mutations remain higher (RXY > 1) but stable over time in the small, isolated TX-like population as compared to the larger AZ-like population (Figure S9A). However, frequencies of beneficial mutations increased more rapidly in the smaller TX-like population before stabilizing when beneficial alleles were fixed (Figure S10). Our simulation results suggest that purifying selection against rare deleterious mutations may remain effective in small populations (i.e., Ne may be small, but s is large so Ne(s) > 1) but higher drift and/or positive selection acting on beneficial alleles maintained in small populations post-bottleneck fixes these common beneficial mutations more rapidly in the smaller populations as compared to the larger population where time of fixation is relatively slower (Figure S10). This is also explained by the levels of differentiation between the two simulated populations captured at functional and neutral mutations over time (Figure S9B). FST increases as populations diverge over time, but the level of differentiation is much higher for adaptive alleles (i.e., beneficial mutations). In contrast, the differentiation at deleterious mutations was comparable to neutral mutations (Figure S9B). When we investigated the distribution and frequency of non-neutral mutations at the end of the simulation, we observed that there were more considerably more deleterious mutations (N = 12571 ± 138) than beneficial mutations (211 ± 6) but on average beneficial mutations are considerably older and mostly fixed between the two populations (Figure S10). Just as in the empirical dataset, most deleterious mutations that are segregating in the contemporary populations at the end of the simulation are young and private (Figure S11).
Discussion
Natural populations with complex evolutionary histories may not be in equilibrium, and it is the combined effect of drift and selection that defines the distribution of non-neutral (i.e. functional) mutations within populations and within individual genomes. Advances in population genomics and our ability to identify putatively deleterious non-synonymous mutations within protein coding regions has enabled us to better understand the evolution of functional variation (; ). However, empirical evidence regarding genetic purging of deleterious alleles (; ; ) has led to arguments against supplemental gene flow (; ). These arguments reflect the complexity of genetic load and its potential negative impact on population fitness. Our study aimed to demonstrate the dynamic nature of genetic load over evolutionary time using individual genomic data from different Montezuma Quail populations (Figure 1A). Below, we discuss how an evolutionary perspective on genetic load can provide insights relevant to molecular ecology and conservation genetics.
Montezuma Quail populations as incipient ring species
Our comparisons of genome-wide variation patterns, shared ancestry, and demographic models all suggest that Montezuma Quail likely evolved similar to a ring species (Figure 2B; (). Ring species evolve as populations diverge from their common ancestor under a scenario where an unsuitable landscape creates divergent populations that could subsequently speciate over time despite historic gene flow (). In the case of Montezuma Quail, our demographic model indicates that a relatively small eastern population in the Sierra Madre Oriental mountains was separated around 15–25 thousand years ago from the large ancestral population by the Central Mexico Plateau (Figures 1A and 2). Following this separation, eastern populations remained relatively small, stable, and isolated to ultimately form the contemporary Texas populations. This scenario is evidenced by the modern-day distribution of the species (Figure 1A) and its suitable habitat, the demographic model (Figure 2A), the shorter ROHs in modern Texas genomes (Figure 1B), and the reduction of genome-wide diversity in Texas populations (Figure S3). In species with limited dispersal capacity, like ground-dwelling montane birds, range expansions are characterized by loss of genetic diversity along the expansion axis due to recurrent bottleneck effects () as seen in Arizona. Arizona populations of Montezuma quail were likely founded by serialized bottlenecks as the larger ancestral population along the Sierra Madre Occidental mountains in the West of Mexico continued to colonize new habitat (). Geographic conditions suitable for ring species formation with reproductive isolation are rare (), but stable terminal populations with historic gene flow can exist if the populations are locally adapted (). Natural history studies of Montezuma quail have identified distinct morphological features between individuals from West or East of the Central Plateau in Mexico () that may result from local adaptation associated with their specialist habitat of montane piñon-oak grasslands (). We do not mean to suggest that there is reproductive isolation between contemporary Montezuma quail populations in Arizona and Texas, that they now represent distinct species, or that they will speciate any time soon. Instead, we suggest that these populations are on incipient evolutionary trajectories similar to those that ultimately give rise to ring species (e.g., Greenish Warblers; ). Future phylogeographic and landscape ecology studies in Montezuma Quail could help identify admixture zones (like populations in New Mexico) and help illustrate the population dynamics of a species that evolved peripherally around a habitat barrier (; ).
Genetic purging and persistence of small populations following strong bottlenecks
Montezuma quail populations in Texas were established ~16.5 kya as part of a substantial bottleneck (i.e., an 80% reduction in size from the ancestral population; Figure 2A). This pattern is similar to other long-term small populations (or species) like polar bears (), Channel Island foxes (), Tibetean wolves (), and Western mountain gorillas (). Western mountain gorillas and island foxes have maintained small population sizes and reduced genetic diversity since they split from Eastern gorillas (T = 20 kya) and mainland gray foxes (T = 9 kya), respectively (; ). Our simulations show strong bottlenecks like those associated with founder effects or speciation events can purge ancestral deleterious mutations rapidly and that surviving small populations suffer from elevated inbreeding and lower genetic diversity relative to populations that experienced less pronounced bottlenecks (Figure 5A–E). These empirical examples (quail, fox, gorilla) and our simulations are from natural populations that underwent historic bottlenecks, but reintroduced populations provide another set of examples of small populations that underwent a strong, recent bottleneck (e.g., Alpine Ibex reintroductions () or the introduced steelhead trout ()). These small, reintroduced populations also have lower overall genomic diversity () and have purged deleterious mutations that still occur in larger populations (). Thus, strong bottlenecks reduce overall genomic diversity, including the reduction of deleterious mutations that comprise the ancestral genetic load (Figure 5D and E).
Small populations can be stable populations despite reduced overall diversity and increased load (; ; ). By including beneficial mutations in our simulations, we show that the small populations exibit lower overall diversity (e.g., heterozygosity), but can maintain relative fitness by maintaining and fixing strongly beneficial alleles via positive selection (i.e., “genetic thrust”). In our simulations, small populations purged strongly deleterious, but maintained strongly beneficial mutations immediately following the bottleneck (i.e. within 500 generations; Figure 5D–G). Rapid adaptation despite loss of diversity due to strong bottlenecks has been documented in introduced populations of steelhead trout (). Theoretical and empirical evidence suggest that populations can maintain adaptive genetic variance immediately post-bottleneck (; ), but adaptive variation is more stochastic long-term depending on the evolutionary history and on the quantitative traits underlying fitness (). Taken together, our simulations suggest that strong bottlenecks like founder events or (re)introductions increase individual load due to inbreeding but ultimately lead to increases in population fitness by purging the ancestral deleterious alleles from the population. However, as witnessed from both empirical data (Figures 3B and 4E) and simulations (Figure S9A), deleterious mutations that are not purged from the small population tend to rise more rapidly over time and segregate at higher frequencies in the smaller population as compared to the larger population. Since overall genetic load is proportional to the product of the number of deleterious mutations and their allele frequencies (), small populations may reach a fitness equilibrium (Figure 5C), and thus, bottlenecked populations can remain stable despite higher population load.
Historically large populations risk inbreeding depression due to recent declines, but historically small populations also risk loss of adaptive potential
Large populations harbor more deleterious mutations by masking them in heterozygotes and escape genetic purging by avoiding inbreeding (). For many species, recent population declines and small dispersal distances associated with fragmented habitat raise concerns about recent inbreeding. Consanguineous matings create longer ROHs () and since deleterious mutations disproportionally appear in longer ROHs (Figure S6; (), individuals of species with large historic population sizes that experienced recent inbreeding have higher individual load and carry signatures of inbreeding depression (; ; ).
Newly established populations require time to generate new de novo deleterious mutations, but these segregating deleterious mutations can rise in frequency over evolutionary timescales in small populations as shown in Montezuma quail from WTX and in other species ((e.g., Eastern massasauga rattlesnakes () or Mountain gorrilas ()). Even in reintroduced populations of Alpine Ibex or endangered populations like Indian tigers or Chinese crocodile lizards, the relative frequency of functional non-synonymous variation was higher in smaller populations (; ; ). Weaker selection (i.e., Ne(s) ~ 1), either due to moderate selective coefficients and/or small population sizes, leads to less effective purging, which results in more private deleterious alleles that become more frequent as small populations continue to grow more isolated. Besides gaining population load over time, our simulations show that, relative to large populations, small isolated populations lose weakly beneficial mutations (Figure 5G), as expected by high drift and small population dynamics (; ). Long-term small populations may be demographically stable, but their reduced levels of standing variation puts them at risk of losing adaptive potential because adaptation is strongly correlated with levels of genetic variation and is better predicted by genetic variation than levels of inbreeding ().
Genealogical dating, simulations, and their limitations
Our goal was to use distributions of mutational ages to assess allele frequency trends of pre- and post-bottleneck deleterious variants in the two populations; we were mostly interested in the comparisons between populations with differing demographies rather than the absolute age estimates of specific variants. Estimating geneaological ages of deleterious mutations is dependent on the accuracy of haplotype phasing and improves with the size of the sequencing datasets (). A wider distribution of independently sampled genomes improves genealogical resolution, but the evaluations of multiple runs capture the variation in the mutation age estimates and suggest our overall age distributions of deleterious mutations are robust (Figure S12). We acknowledge that our evolutionary genomics simulations of a miniaturized demographic model (Figure S1) could exaggerate the effect of drift despite our scaling the genetic parameters to account for small sizes (). Thus, the absolute number of SNPs and their allele frequency estimates might be inaccurate as opposed to estimates from the simulations of true population sizes, but our population genetic inferences should be well-supported as they are either proportional to the genome sizes (heterozygosity, FROH) or relative to another population (relative fitness, RXY, FST). This is evidenced by the fact that the temporal distribution of deleterious mutations currently segregating in the final populations at the end of our simulation was similar to our observations from the empirical genomic data (Figure 4B, D, and E and Figure S11), so our evolutionary genomic model recapitulates the evolutionary history of Montezuma Quail populations. A general limitation of simulation studies of natural populations is the lack of true estimates for genetic parameters like the distribution of fitness effects (DFE) of non-neutral mutations or the dominance-selection relationships (), which can lead to underestimates of load in empirical studies (). Herein, we used the same DFE estimates as other simulation studies (; ; ), but we incorporated a more realistic dominance-selection relationship and a slow bottleneck based on the inferred demographic history. Finally, we only simulated the exome (i.e., protein coding regions) that represents only 1–2% of the whole genome and ignores the putative functional effects of regulatory or non-coding intergenic regions. Simulations like ours have limitations, but they can also provide powerful insights as to the impact of population trajectories on genetic effects. Future simulation studies should consider epistatic interactions between different genes () and the role of dominance in maintaining additive genetic diversity ().
Evolutionary history, demography, genetic load, and conservation
Our study highlights that genetic load is complex and context-dependent. The evolutionary history (e.g., phylogeography and demography; Figures 1 and 2) of a population or species has a profound impact on its overall genomic variation, including the genetic load of deleterious recessive alleles. Recent inbreeding and short-term demographics shape individual realized load (Figure S5), but long-term population size is deterministic of population load and adaptive potential (). In the future, assisted conservation strategies such as supplementation or translocation of individuals from donor populations should continue to consider ecological limitations such as carrying capacity but may also consider evolutionary attributes (e.g., demographic history and genetic load) of the donor population(s). Our empirical data from natural populations indicates that natural selection against ancestral deleterious mutations purges them in small populations, much like artificial selection can (; ).
Small isolated populations have been traditionally conserved via assisted gene flow from genetically diverse populations (; ). Such a strategy may risk the inadvertent introduction of new or previously purged deleterious mutations into the small recipient population, which could further increase realized genetic load (; ). We think that future assessments of genetic load could reduce the likelihood of conservationists inadvertently introducing a Trojan horse full of deleterious alleles into a genetically fragile recipient population. These are important considerations for genetic rescue, but major knowledge gaps remain in our understanding of fitness in natural populations. Conservationists contemplating genetic rescue must try to maximize adaptive potential while minimizing reductions to fitness by introducing novel deleterious alleles. Accordingly, we think LoadP measures the trade-off between the number of deleterious alleles/loci and other functional alleles within an individual and, at least in principle, translocations using individuals with lower LoadP values could increase the number of putatively functional variants in the recipient population. The influx of functional but non-deleterious alleles could help replenish the lost adaptive variation in small populations and improve their adaptive potential. From a practical perspective, we think that our results suggest that in cases where genetic rescue is a plausible conservation scenario, biologists should consider the demographic history, inbreeding, and genetic load in donor populations as part of the conservation planning.
Conclusions
Genetic load is dynamic because deleterious mutations currently segregating in populations are subject to both selection and drift which vary in their efficacy depending on the evolutionary history of the species. We show that patterns of phylogeography shape the historic and recent demography, which in turn dictates the degree and duration of bottlenecks and their genetic effects. Our data indicate that strong bottlenecks purge ancestral deleterious mutations, but long-term small populations acquire contemporary load as de novo deleterious mutations rise in frequencies over time. By aging deleterious alleles, we show that roughly one-third of the genetic load exists privately in each Montezuma quail populations and has arisen in the last ~16,500 generations. Our forward-time simulations of deleterious, neutral, and beneficial mutations reveal that recent crashes in historically large populations are at greater risk of inbreeding depression due to the exposure of previously masked deleterious alleles. In contrast, historically small populations risk the loss of adaptive potential as drift can stochastically change the magnitude and/or direction of the genetic thrust associated with beneficial alleles. We think that future assessments of genetic load can and should become part of conversations about genetic rescue, and that such assessments should explicitly consider the evolutionary history of the species and potential donor populations.
Acknowledgements
The authors thank J. Heffelfinger at the Arizona Department of Game and Fish for the hunter-harvested wings. The authors also thank Genaro Olmos, Erasmo Olmos, and Juan Felipe Montoya for their Mexican field work support; Alberto Macías Duarte, Angel B. Montoya, James Weaver, Ryan Schmidt, Joyce Moore, and Mike Miller for Texas field work support. The authors also thank Drs Ryan Luna and Louis Harveson from Sul Ross State University; as well as Kristyn Stewart and Dr Fidel Hernandez from Texas A&M University-Kingsville.
References
- Abascal F., Corvelo A., Cruz F., Villanueva-Cañas J. L., Vlasova A., Marcet-Houben M., Godoy J. A. (2016). Extreme genomic erosion after recurrent demographic bottlenecks in the highly endangered Iberian lynx.Genome biology, 17(1), 1–19. https://doi.org/10.1186/s13059-016-1090-1
- Albers P. K., McVean G. (2020). Dating genomic variants and shared ancestry in population-scale sequencing data. PLoS Biology, 18(1): e3000586. https://doi.org/10.1371/journal.pbio.3000586
- Alcaide M., Scordato E. S. C., Price T. D., Irwin D. E. (2014). Genomic divergence in a ring species complex. Nature, 511(7507): 83–85. https://doi.org/10.1038/nature13285
- Baker Z., Schumer M., Haba Y., Bashkirova L., Holland C., Rosenthal G. G., Przeworski M. (2017). Repeated losses of PRDM9-directed recombination despite the conservation of PRDM9 across vertebrates. eLife, 6: e24133. https://doi.org/10.7554/eLife.24133
- Bateson Z. W., Hammerly S. C., Johnson J. A., Morrow M. E., Whittingham L. A., Dunn P. O. (2016). Specific alleles at immune genes, rather than genome-wide heterozygosity, are related to immunity and survival in the critically endangered Attwater’s prairie-chicken. Molecular Ecology, 25(19): 4730–4744. https://doi.org/10.1111/mec.13793
- Benazzo A., Trucchi E., Cahill J. A., Maisano Delser P., Mona S., Fumagalli M., Bertorelle G. (2017). Survival and divergence in a small group: The extraordinary genomic history of the endangered Apennine brown bear stragglers.Proceedings of the National Academy of Sciences, 114(45), E9589–E9597. https://doi.org/10.1073/pnas.1707279114
- Bertorelle G., Raffini F., Bosse M., Bortoluzzi C., Iannucci A., Trucchi E., Morales H. E., van Oosterhout C., van Oosterhout C. (2022). Genetic load: genomic estimates and applications in non-model animals. Nature Reviews Genetics, 23(8): 492–503. https://doi.org/10.1038/s41576-022-00448-x
- Biebach I., Keller L. F. (2009). A strong genetic footprint of the re-introduction history of Alpine ibex (Capra ibex ibex). Molecular Ecology, 18(24): 5046–5058. https://doi.org/10.1111/j.1365-294X.2009.04420.x
- Bijlsma R., Loeschcke V. (2012). Genetic erosion impedes adaptive responses to stressful environments. Evolutionary Applications, 5(2): 117–129. https://doi.org/10.1111/j.1752-4571.2011.00214.x
- Biscarini F., Cozzi P., Gaspa G., Marras G. (2018). detectRUNS: Detect runs of homozygosity and runs of heterozygosity in diploid genomes.
- Brown R. L. (1982). Effects of livestock grazing on mearns quail in southeastern Arizona. Journal of Range Management, 35(6): 727. https://doi.org/10.2307/3898250
- Browning B. L., Zhou Y., Browning S. R. (2018). A one-penny imputed genome from next-generation reference panels. The American Journal of Human Genetics, 103(3): 338–348. https://doi.org/10.1016/j.ajhg.2018.07.015
- Brüniche-Olsen A., Kellner K. F., Belant J. L., DeWoody J. A. (2021). Life-history traits and habitat availability shape genomic diversity in birds: implications for conservation.Proceedings of the Royal Society B, 288(1961), 20211441. https://doi.org/10.1098/rspb.2021.1441
- Ceballos F. C., Joshi P. K., Clark D. W., Ramsay M., Wilson J. F. (2018). Runs of homozygosity: Windows into population history and trait architecture. Nature Reviews Genetics, 19(4): 220–234. https://doi.org/10.1038/nrg.2017.109
- Chang C. C., Chow C. C., Tellier L. C., Vattikuti S., Purcell S. M., Lee J. J. (2015). Second-generation PLINK: rising to the challenge of larger and richer datasets.Gigascience, 4(1), s13742–015. https://doi.org/10.1186/s13742-015-0047-8
- Cooper G. M., Goode D. L., Ng S. B., Sidow A., Bamshad M. J., Shendure J., Nickerson D. A. (2010). Single-nucleotide evolutionary constraint scores highlight disease-causing mutations. Nature Methods, 7(4): 250–251. https://doi.org/10.1038/nmeth0410-250
- Danecek P., Auton A., Abecasis G., Albers C. A., Banks E., DePristo M. A., Handsaker R. E., Lunter G., Marth G. T., Sherry S. T., McVean G., Durbin R., Durbin R.; 1000 Genomes Project Analysis Group (2011). The variant call format and VCFtools. Bioinformatics, 27(15): 2156–2158. https://doi.org/10.1093/bioinformatics/btr330
- DeWoody J. A., Harder A. M., Mathur S., Willoughby J. R. (2021). The long-standing significance of genetic diversity in conservation. Molecular Ecology, 30(17): 4147–4154. https://doi.org/10.1111/mec.16051
- Do R., Balick D., Li H., Adzhubei I., Sunyaev S., Reich D. (2015). No evidence that selection has been less effective at removing deleterious mutations in Europeans than in Africans. Nature Genetics, 47(2): 126–131. https://doi.org/10.1038/ng.3186
- Ellegren H., Sheldon B. C. (2008). Genetic basis of fitness differences in natural populations. Nature, 452(7184): 169–175. https://doi.org/10.1038/nature06737
- Excoffier L., Foll M., Petit R. J. (2009). Genetic consequences of range expansions. Annual Review of Ecology, Evolution, and Systematics, 40(1): 481–501. https://doi.org/10.1146/annurev.ecolsys.39.110707.173414
- Fitzpatrick S. W., Bradburd G. S., Kremer C. T., Salerno P. E., Angeloni L. M., Funk W. C. (2020). Genomic and fitness consequences of genetic rescue in wild populations. Current Biology, 30(3): 517–522.e5.e515. https://doi.org/10.1016/j.cub.2019.11.062
- Frankham R. (2015). Genetic rescue of small inbred populations: Meta‐analysis reveals large and consistent benefits of gene flow.Molecular ecology, 24(11), 2610–2618. https://doi.org/10.1111/mec.13139
- Frankham R. (2005). Genetics and extinction. Biological Conservation, 126(2): 131–140. https://doi.org/10.1016/j.biocon.2005.05.002
- Fu W., Gittelman R. M., Bamshad M. J., Akey J. M. (2014). Characteristics of neutral and deleterious protein-coding variation among individuals and populations. The American Journal of Human Genetics, 95(4): 421–436. https://doi.org/10.1016/j.ajhg.2014.09.006
- Galtier N., Duret L. (2007). Adaptation or biased gene conversion? Extending the null hypothesis of molecular evolution. Trends in Genetics, 23(6): 273–277. https://doi.org/10.1016/j.tig.2007.03.011
- Gilpin M. E. (1986). Minimal viable populations: processes of species extinction. Conservation biology: the science of scarcity and diversity.
- Groenen M. A. M., Wahlberg P., Foglio M., Cheng H. H., Megens H. -J., Crooijmans R. P. M. A., Andersson L. (2009). A high-density SNP-based linkage map of the chicken genome reveals sequence features correlated with recombination rate. Genome Research, 19(3): 510–519. https://doi.org/10.1101/gr.086538.108
- Grossen C., Guillaume F., Keller L. F., Croll D. (2020). Purging of highly deleterious mutations through severe bottlenecks in Alpine ibex.Nature communications, 11(1), 1–12. https://doi.org/10.1038/s41467-020-14803-1
- Haller B. C., Messer P. W. (2019). SLiM 3: Forward genetic simulations beyond the Wright–Fisher model. Molecular Biology and Evolution, 36(3): 632–637. https://doi.org/10.1093/molbev/msy228
- Harveson L. A. (2009). Management of Montezuma quail in Texas: barriers to establishing a hunting season. Paper presented at the National Quail Symposium Proceedings.
- Harveson L. A., Allen T. H., Hernández F., Holdermann D. A., Mueller J. M., Whitley M. S. (2007). Montezuma quail ecology and life history. In: Brennan L. A. (ed.), Texas quails. Texas A&M University, College Station, USA, 23–29.
- Heffelfinger J. R., Olding R. J. (2000). Montezuma quail management in Arizona. Paper presented at the National Quail Symposium Proceedings.
- Hoffmann A. A., Sgrò C. M., Kristensen T. N. (2017). Revisiting adaptive potential, population size, and conservation. Trends in Ecology & Evolution, 32(7): 506–517. https://doi.org/10.1016/j.tree.2017.03.012
- Hofman C. A., Rick T. C., Hawkins M. T., Funk W. C., Ralls K., Boser C. L., Maldonado J. E. (2015). Mitochondrial genomes suggest rapid evolution of dwarf California Channel Islands foxes (Urocyon littoralis).PloS one, 10(2), e0118240. https://doi.org/10.1371/journal.pone.0118240
- Irwin D. E., Bensch S., Price T. D. (2001a). Speciation in a ring. Nature, 409(6818): 333–337. https://doi.org/10.1038/35053059
- Irwin D. E., Irwin J. H., Price T. D. (2001b). Ring species as bridges between microevolution and speciation. Genetica, 112(113): 223–243. https://doi.org/10.1023/a:1013319217703
- Jensen J. D., Thornton K. R., Bustamante C. D., Aquadro C. F. (2007). On the utility of linkage disequilibrium as a statistic for identifying targets of positive selection in nonequilibrium populations. Genetics, 176(4): 2371–2379. https://doi.org/10.1534/genetics.106.069450
- Kardos M., Armstrong E. E., Fitzpatrick S. W., Hauser S., Hedrick P. W., Miller J. M., Funk W. C. (2021). The crucial role of genome-wide genetic variation in conservation.Proceedings of the National Academy of Sciences, 118(48), e2104642118. https://doi.org/10.1073/pnas.2104642118
- Khan A., Patel K., Shukla H., Viswanathan A., van der Valk T., Borthakur U., Ramakrishnan U. (2021). Genomic evidence for inbreeding depression and purging of deleterious genetic variation in Indian tigers.Proceedings of the National Academy of Sciences, 118(49), e2023018118. https://doi.org/10.1073/pnas.2023018118
- Kim B. Y., Huber C. D., Lohmueller K. E. (2017). Inference of the distribution of selection coefficients for new nonsynonymous mutations using large samples. Genetics, 206(1): 345–361. https://doi.org/10.1534/genetics.116.197145
- Kimura M., Maruyama T., Crow J. F. (1963). The mutation load in small populations. Genetics, 48, 1303–1312. https://doi.org/10.1093/genetics/48.10.1303
- Kimura M., Ohta T. (1969). The average number of generations until extinction of an individual mutant gene in a finite population. Genetics, 63(3): 701–709. https://doi.org/10.1093/genetics/63.3.701
- Kleinman-Ruiz D., Lucena-Perez M., Villanueva B., Fernández J., Saveljev A. P., Ratkiewicz M., Godoy J. A. (2022). Purging of deleterious burden in the endangered Iberian lynx.Proceedings of the National Academy of Sciences, 119(11), e2110614119. https://doi.org/10.1073/pnas.2110614119
- Kyriazis C. C., Wayne R. K., Lohmueller K. E. (2020). Strongly deleterious mutations are a primary determinant of extinction risk due to inbreeding depression. Evolution Letters, 5(1): 33–47. https://doi.org/10.1002/evl3.209
- Lawson D. J., Hellenthal G., Myers S., Falush D. (2012). Inference of population structure using dense haplotype data. PLoS Genetics, 8(1): e1002453. https://doi.org/10.1371/journal.pgen.1002453
- Leopold A. S., McCabe R. A. (1957). Natural history of the Montezuma Quail in Mexico. The Condor, 59(1): 3–26. https://doi.org/10.2307/1364613
- Leroy G., Carroll E. L., Bruford M. W., DeWoody J. A., Strand A., Waits L., Wang J. (2017). Next-generation metrics for monitoring genetic erosion within populations of conservation concern. Evolutionary Applications, 11(7): 1066–1083. https://doi.org/10.1111/eva.12564
- Lohmueller K. E. (2014). The distribution of deleterious genetic variation in human populations. Current Opinion in Genetics & Development, 29, 139–146. https://doi.org/10.1016/j.gde.2014.09.005
- López-Cortegano E., Moreno E., García-Dorado A. (2021). Genetic purging in captive endangered ungulates with extremely low effective population sizes. Heredity, 127(5): 433–442. https://doi.org/10.1038/s41437-021-00473-2
- Lynch M., Gabriel W. (2017). Mutation load and the survival of small populations. Evolution, 44(7): 1725–1737. https://doi.org/10.1111/j.1558-5646.1990.tb05244.x
- Martins A. B., de Aguiar M. A. M., Bar-Yam Y. (2013). Evolution and stability of ring species. Proceedings of the National Academy of Sciences, 110(13): 5080–5084. https://doi.org/10.1073/pnas.1217034110
- Mathur S., DeWoody J. A. (2021). Genetic load has potential in large populations but is realized in small inbred populations. Evolutionary Applications, 14(6): 1540–1557. https://doi.org/10.1111/eva.13216
- Mathur S., Tomeček J. M., Heniff A., Luna R., DeWoody J. A. (2019). Evidence of genetic erosion in a peripheral population of a North American game bird: The Montezuma quail (Cyrtonyx montezumae). Conservation Genetics, 20(6): 1369–1381. https://doi.org/10.1007/s10592-019-01218-9
- McKenna A., Hanna M., Banks E., Sivachenko A., Cibulskis K., Kernytsky A., Garimella K., Altshuler D., Gabriel S., Daly M., DePristo M. A., DePristo M. A. (2010). The Genome Analysis Toolkit: A MapReduce framework for analyzing next-generation DNA sequencing data. Genome Research, 20(9): 1297–1303. https://doi.org/10.1101/gr.107524.110
- McLaren W., Gil L., Hunt S. E., Riat H. S., Ritchie G. R. S., Thormann A., Cunningham F. (2016). The Ensembl ariant effect predictor.Genome Biology, 17(1), 1–14. https://doi.org/10.1186/s13059-016-0974-4
- Morris K. M., Hindle M. M., Boitard S., Burt D. W., Danner A. F., Eory L., Smith J. (2020). The quail genome: Insights into social behaviour, seasonal biology and infectious disease response.BMC Biology, 18(1), 1–18. https://doi.org/10.1186/s12915-020-0743-4
- Mularo A. J., Bernal X. E., DeWoody J. A., Sherwin W. (2022). Dominance can increase genetic variance after a population bottleneck: A synthesis of the theoretical and empirical evidence. Journal of Heredity, 113(3): 257–271. https://doi.org/10.1093/jhered/esac007
- Muller H. J. (1950). Our load of mutations. Am J Hum Genet, 2(2), 111–76. Retrieved from https://www.ncbi.nlm.nih.gov/pubmed/14771033
- Nadachowska-Brzyska K., Li C., Smeds L., Zhang G., Ellegren H. (2015). Temporal dynamics of avian populations during pleistocene revealed by whole-genome sequences. Current Biology, 25(10): 1375–1380. https://doi.org/10.1016/j.cub.2015.03.047
- Ng P. C., Henikoff S. (2003). SIFT: Predicting amino acid changes that affect protein function. Nucleic Acids Research, 31(13): 3812–3814. https://doi.org/10.1093/nar/gkg509
- Nicholls J. A., Double M. C., Rowell D. M., Magrath R. D. (2000). The evolution of cooperative and pair breeding in thornbills Acanthiza (Pardalotidae). Journal of Avian Biology, 31(2): 165–176. https://doi.org/10.1034/j.1600-048x.2000.310208.x
- Noskova E., Ulyantsev V., Koepfli K. P., O’Brien S. J., Dobrynin P. (2020). GADMA: Genetic algorithm for inferring demographic history of multiple populations from allele frequency spectrum data.GigaScience, 9(3), giaa005. https://doi.org/10.1093/gigascience/giaa005
- Ochoa A., Gibbs H. L. (2021). Genomic signatures of inbreeding and mutation load in a threatened rattlesnake. Molecular Ecology, 30(21): 5454–5469. https://doi.org/10.1111/mec.16147
- Orr H. A. (2010). The population genetics of beneficial mutations. Philosophical Transactions of the Royal Society B: Biological Sciences, 365(1544): 1195–1201. https://doi.org/10.1098/rstb.2009.0282
- Ørsted M., Hoffmann A. A., Sverrisdóttir E., Nielsen K. L., Kristensen T. N. (2019). Genomic variation predicts adaptive evolutionary responses better than population bottleneck history. PLoS Genetics, 15(6): e1008205. https://doi.org/10.1371/journal.pgen.1008205
- Perrier C., Delahaie B., Charmantier A. (2018). Heritability estimates from genomewide relatedness matrices in wild populations: Application to a passerine, using a small sample size. Molecular Ecology Resources, 18(4): 838–853. https://doi.org/10.1111/1755-0998.12886
- Petren K., Grant P. R., Grant B. R., Keller L. F. (2005). Comparative landscape genetics and the adaptive radiation of Darwin’s finches: The role of peripheral isolation. Molecular Ecology, 14(10): 2943–2957. https://doi.org/10.1111/j.1365-294X.2005.02632.x
- Pujol G., Iooss B., Iooss M. B., DiceDesign S. (2015). Package “sensitivity”. CRAN.
- Ralls K., Sunnucks P., Lacy R. C., Frankham R. (2020). Genetic rescue: A critique of the evidence supports maximizing genetic diversity rather than minimizing the introduction of putatively harmful genetic variation. Biological Conservation, 251: 108784. https://doi.org/10.1016/j.biocon.2020.108784
- Ralls K., Ballou J. D., Dudash M. R., Eldridge M. D., Fenster C. B., Lacy R. C., Frankham R. (2018). Call for a paradigm shift in the genetic management of fragmented populations.Conservation Letters, 11(2), e12412. https://doi.org/10.1111/conl.12412
- Randel C. J., Johnson C. Z., Chavarria P. M., Lopez R. R., Silvy N. J., Tomeček J. M. (2019). Estimating Montezuma quail hatch date using primary molt at harvest. Wildlife Society Bulletin, 43(4): 766–768. https://doi.org/10.1002/wsb.1017
- Reed D. H. (2010). Albatrosses, eagles and newts, Oh My!: Exceptions to the prevailing paradigm concerning genetic diversity and population viability?. Animal Conservation, 13(5): 448–457. https://doi.org/10.1111/j.1469-1795.2010.00353.x
- Rettelbach A., Nater A., Ellegren H. (2019). How linked selection shapes the diversity landscape in ficedula flycatchers. Genetics, 212(1): 277–285. https://doi.org/10.1534/genetics.119.301991
- Robinson J. A., Brown C., Kim B. Y., Lohmueller K. E., Wayne R. K. (2018). Purging of strongly deleterious mutations explains long-term persistence and absence of inbreeding depression in island foxes. Current Biology, 28(21): 3487–3494.e4.e3484. https://doi.org/10.1016/j.cub.2018.08.066
- Robinson J. A., Räikkönen J., Vucetich L. M., Vucetich J. A., Peterson R. O., Lohmueller K. E., Wayne R. K. (2019). Genomic signatures of extensive inbreeding in Isle Royale wolves, a population on the threshold of extinction.Science Advances, 5(5), eaau0757. https://doi.org/10.1126/sciadv.aau0757
- Rogers R. L., Slatkin M. (2017). Excess of genomic defects in a woolly mammoth on Wrangel island. PLoS Genetics, 13(3): e1006601. https://doi.org/10.1371/journal.pgen.1006601
- Singhal S., Leffler E. M., Sannareddy K., Turner I., Venn O., Hooper D. M., Strand A. I., Li Q., Raney B., Balakrishnan C. N., Griffith S. C., McVean G., Przeworski M., Przeworski M. (2015). Stable recombination hotspots in birds. Science, 350(6263): 928–932. https://doi.org/10.1126/science.aad0843
- Soulé M. E. (1985). What is conservation biology?. BioScience, 35(11): 727–734. https://doi.org/10.2307/1310054
- Stoffel M. A., Johnston S. E., Pilkington J. G., Pemberton J. M. (2021). Genetic architecture and lifetime dynamics of inbreeding depression in a wild mammal.Nature communications, 12(1), 1–10. https://doi.org/10.1038/s41467-021-23222-9
- Stromberg M. R. (1990). Habitat, movements and roost characteristics of montezuma quail in southeastern Arizona. The Condor, 92(1): 229–236. https://doi.org/10.2307/1368404
- Swindell W. R., Bouzat J. L. (2005). Modeling the adaptive potential of isolated populations: Experimental simulations using Drosophila. Evolution, 59(10): 2159–2169. https://doi.org/10.1111/j.0014-3820.2005.tb00925.x
- Szpiech Z. A., Xu J., Pemberton T. J., Peng W., Zöllner S., Rosenberg N. A., Li J. Z. (2013). Long runs of homozygosity are enriched for deleterious variation.The American Journal of Human Genetics, 93(1), 90–102. https://doi.org/10.1016/j.ajhg.2013.05.003
- Team R. C. (2013). R: A language and environment for statistical computing.
- Templeton A. R., Read B. (1984). Factors eliminating inbreeding depression in a captive herd of speke’s gazelle (Gazella spekei). Zoo Biology, 3(3): 177–199. https://doi.org/10.1002/zoo.1430030302
- Tennessen J. A., Bigham A. W., O’Connor T. D., Fu W., Kenny E. E., Gravel S., McGee S., Do R., Liu X., Jun G., Kang H. M., Jordan D., Leal S. M., Gabriel S., Rieder M. J., Abecasis G., Altshuler D., Nickerson D. A., Boerwinkle E., … NHLBI Exome Sequencing Project (2012). Evolution and functional impact of rare coding variation from deep sequencing of human exomes. Science, 337(6090): 64–69. https://doi.org/10.1126/science.1219240
- Uricchio L. H. (2019). Evolutionary perspectives on polygenic selection, missing heritability, and GWAS. Human Genetics, 139(1): 5–21. https://doi.org/10.1007/s00439-019-02040-6
- van der Valk T., Díez-del-Molino D., Marques-Bonet T., Guschanski K., Dalén L. (2019). Historical genomes reveal the genomic consequences of recent population decline in eastern gorillas. Current Biology, 29(1), 165–170.e6.e166. https://doi.org/10.1016/j.cub.2018.11.055
- van Oosterhout C. (2020). Mutation load is the spectre of species conservation. Nature Ecology & Evolution, 4(8): 1004–1006. https://doi.org/10.1038/s41559-020-1204-8
- Wang P., Burley J. T., Liu Y., Chang J., Chen D., Lu Q., Li S.-H., Zhou X., Edwards S., Zhang Z., Wei F. (2021). Genomic consequences of long-term population decline in brown eared pheasant. Molecular Biology and Evolution, 38(1): 263–273. https://doi.org/10.1093/molbev/msaa213
- Whitlock M. C., Phillips P. C., Moore F. B. G., Tonsor S. J. (1995). Multiple fitness peaks and epistasis. Annual Review of Ecology and Systematics, 26(1): 601–629. https://doi.org/10.1146/annurev.es.26.110195.003125
- Willoughby J. R., Harder A. M., Tennessen J. A., Scribner K. T., Christie M. R. (2018). Rapid genetic adaptation to a novel environment despite a genome-wide reduction in genetic diversity. Molecular Ecology, 27(20): 4041–4051. https://doi.org/10.1111/mec.14726
- Xie H. X., Liang X. X., Chen Z. Q., Li W. M., Mi C. R., Li M., Du W. G. (2022). Ancient demographics determine the effectiveness of genetic purging in endangered lizards.Molecular biology and evolution, 39(1), msab359. https://doi.org/10.1093/molbev/msab359
- Xue Y., Prado-Martinez J., Sudmant P. H., Narasimhan V., Ayub Q., Szpak M., Frandsen P., Chen Y., Yngvadottir B., Cooper D. N., de Manuel M., Hernandez-Rodriguez J., Lobon I., Siegismund H. R., Pagani L., Quail M. A., Hvilsom C., Mudakikwa A., Eichler E. E., Scally A. (2015). Mountain gorilla genomes reveal the impact of long-term population decline and inbreeding. Science, 348(6231): 242–245. https://doi.org/10.1126/science.aaa3952