Introduction
Our knowledge of the gut microbiome’s role in animal health and fitness has grown dramatically in recent years, yielding an understanding that the microbiome aids in a wide array of host functions, including degradation of dietary material, production of energy for the host, immune development, pathogen exclusion, and endocrine function (Troyer , Kau et al. , Valdes et al. , Williams et al. ). To date, most studies of the gut microbiome have been cross-sectional in nature, and while these have substantially advanced our understanding of microbial contributions to host physiology, they ignore temporal variation in microbiome composition. Microbiomes can be highly variable across days, weeks, and months, and cross-sectional studies may over-or underestimate the relative importance of particular microbial taxa or draw spurious conclusions based on data collected at a single time point. The degree to which this may be a concern likely varies among animal taxa, and emerging evidence suggests that the degree of fluctuation in the gut microbiome varies between species (Xue et al. , Williams et al. , Yao et al. , Zoelzer et al. ). However, there remain few studies that characterize the temporal dynamics of the gut microbiome of different species. As a result, it remains unknown which variables—including ecological and evolutionary factors—may influence gut microbiome dynamics (Björk et al. ). Characterization of these temporal dynamics at the individual, population, and species levels could help assess the validity and generalizability of cross-sectional results for a particular species, identify or verify which microbial taxa are indeed important for host function, and provide insights as to how various species may respond to environmental change and microbiome-based therapeutics. Therefore, there is a need for more longitudinal studies to validate and expand our knowledge of the role of the gut microbiome across the tree of life.
It is well known that the gut microbiome of a particular species can be shaped by both environmental factors and its evolutionary history (Ley et al. , Muegge et al. , Eichmiller et al. , Schmidt et al. , Baek et al. , Rojas et al. , Akiko Sawada et al. , Williams et al. ). The phenomenon whereby phylogenetic signal is detected in microbiome communities has been referred to as phylosymbiosis (Brooks et al. , Lim and Bordenstein ). Studies of phylosymbiosis have shown that the co-evolution of microbiota and their host can produce diversification in gut microbiota that reflects a host’s evolutionary history (Lim and Bordenstein ). In addition to a host’s species identity, diet is a well-known environmental influence of the gut microbiome and the signal of a host’s diet is often reflected in its microbial community—even hosts that are phylogenetically distantly related but share similar diets have been shown to converge on similar gut microbiome communities and functions (Ley et al. , Muegge et al. , McKenney et al. ). Parsing out whether diet or evolutionary history is more important for shaping microbiome diversity can be challenging, and recent studies have been aimed at understanding the relative importance of these factors in different species across different timescales (Muegge et al. , Delsuc et al. , Groussin et al. , Weinstein et al. ).
While the diversity of the gut microbiome is known to be shaped by both diet and host species identity, it is unknown how a host’s evolutionary history and present diet affect the longitudinal dynamics of its gut microbiome. Red pandas (Ailurus fulgens) present a useful model species with which to tease apart the relative importance of diet vs. host species identity in structuring the longitudinal dynamics of the gut microbiome. Despite being a member of the order Carnivora, the red panda consumes a diet overwhelmingly composed of bamboo. However, the red panda gastrointestinal tract is poorly suited for bamboo consumption as it remains largely carnivore-like, with a short passage time and no anatomical adaptations for herbivory (Davis ). This mismatch between evolutionary history and dietary specialization can enable characterization of how these factors affect the gut microbiome—both in its composition and in its longitudinal dynamics. Several studies have characterized the red panda gut microbiome, finding that it is dominated by the orders Clostridiales, Lactobacilliales, Enterobacteriales, and Erysipelotrichales, is likely established early, either via birth or through maternal contact, and is thought to play an important role in nutrient acquisition in early life (Kong et al. , Li et al. , Williams et al. , Zeng et al. ). Some studies have also noted that the red panda gut microbiome experiences high levels of variability compared to other animal taxa (Yao et al. , Zoelzer et al. ). However, to our knowledge, no study has characterized the seasonal dynamics of individual red pandas nor sought to tease apart how these patterns might be governed by their evolutionary history and dietary specialization.
Here, we characterized the seasonal dynamics of the red panda gut microbiome by collecting fecal samples from individuals housed in a zoological facility in the USA across the four North American seasons. Because red pandas are in the family Carnivora and yet underwent a diet switch to herbivory in their evolutionary history, we also sought to evaluate which aspects of the red panda gut microbiome might be more similar to a “traditional” carnivore, vs. a herbivore. Therefore, we obtained samples from the herbivorous southern white rhinoceroses (Ceratotherium simum simum) and carnivorous Sumatran tigers (Panthera tigris sumatrae) in the same fashion. Using this “traditional” carnivore and herbivore as a reference, we attempted to reveal the signature of the red panda’s diet shift on its gut microbiome’s temporal dynamics. Using amplicon sequencing of the 16S rRNA gene, we characterized seasonal dynamics of the gut microbiome of individuals of each of these species and hypothesized that red pandas would possess gut microbiome dynamics that shared some similarities with carnivores and others with herbivores, uniquely shaping the trajectory of their gut microbiomes across the year.
Materials and methods
Sample collection, storage, DNA extraction, and sequencing
Red pandas were housed at the Smithsonian’s National Zoo and Conservation Biology Institute in Front Royal, VA, USA (n = 9). Tigers (n = 5) and rhinos (n = 5) were housed at the San Diego Zoo Safari Park in Escondido, CA, USA. For all species, three fresh fecal samples were collected from each individual in each of four seasons to control for potential variation within a season (except for some instances where we were unable to obtain a sample from an individual; see Table S1): fall (between 22 September and 20 December), winter (between 21 December and 20 March), spring (between 21 March and 20 June), and summer (between 21 June and 21 September). Red panda samples were collected between fall 2013 and summer 2014. Rhino samples were collected between fall 2016 and summer 2017. Tiger samples were collected between fall 2014 and summer 2015. All sample dates for all individuals are available in Table S1. Between species, sample preservation methods, DNA extraction, and sequencing differed slightly due to logistical constraints associated with leveraging intensive sampling efforts already in place for non-contact animals. However, within each species protocols were standardized to enable characterization of changes within a species across the seasons. For red pandas, fecal samples were collected immediately after defecation, flash frozen in liquid nitrogen, and kept on dry ice until their final storage at −80°C. For rhinos, fecal samples were collected immediately after defecation and frozen at −80°C prior to extraction. For tigers, fecal samples were collected immediately after defecation, frozen at −20°C, and lyophilized prior to extraction. For rhino and red panda samples, genomic DNA was extracted using a hot–cold phenol extraction (Stevenson and Weimer , Williams et al. ). The only modification to this protocol was the use of 24:24:1 phenol:chloroform:isoamyl alcohol in place of phenol:chloroform. Genomic DNA was extracted from tiger samples using a ZymoBIOMICS DNA extraction kit (Zymo Research, Irvine, CA, USA). DNA was quantified using either a Qubit Fluorometer or Quant-iT assay (Invitrogen, Waltham, MA, USA) and stored at −20°C. For red panda samples, the V3–V4 region of the 16S rRNA gene was sequenced on Illumina MiSeq v3 (Illumina, San Diego, CA, USA) using a 300-bp paired-end protocol as described previously (Williams et al. ). For tiger and rhino samples, the V4 region of the 16S rRNA gene was sequenced on Illumina MiSeq v2 using a paired-end protocol previously described (Williams et al. ).
Sequence processing
Demultiplexed FASTQ files were imported into QIIME2 (Bolyen et al. ). Then, the DADA2 QIIME2 plug-in and “denoise-paired” command were used to remove primers and trim and quality control sequences (Callahan et al. ). Sequences were clustered into 97% OTUs (operational taxonomic units) using the vsearch “cluster-features-de-novo” command implemented in QIIME2 (Rognes et al. ). A phylogenetic tree was generated by first aligning the sequences using the alignment MAFFT plug-in in QIIME2, masking highly variable positions, and aligning sequences using the FastTree plug-in (Katoh et al. , Price et al. ). The tree was rooted by implementing the phylogeny midpoint root plug-in. Taxonomy was assigned using the feature-classifier classify-sklearn plug-in in conjunction with the SILVA full-length 16S (reference database release 138) database (Quast et al. ). Sequences assigned to mitochondria, chloroplasts, or those that could not be assigned to at least a phylum level were discarded. This script was automated using the Snakemake workflow manager and has been made publicly available on GitHub alongside a usage tutorial to ensure reproducibility of the data analysis (Köster and Rahmann , Williams ).
Statistical analyses
Our statistical analyses fell into two primary categories: (1) exploring the seasonal variation within the gut microbiome of the red panda specifically, and (2) understanding how the seasonal variation of the red panda (a herbivorous carnivore) compared to two other taxa, the tiger (a carnivore) and rhino (a herbivore).
Red panda analyses
For red panda sequences, we first calculated Shannon diversity in QIIME2 on rarefied data using the core-metrics plug-in (Shannon and Weaver , Bolyen et al. ). Sequences were rarefied to 5000 reads. We used a linear mixed model, implemented by the nlme R package to determine differences in alpha diversity between seasons, accounting for individual as a random effect (R Core Team , Pinheiro and Bates ). A post-hoc estimated marginal means test implemented by the emmeans R package was then used to determine the comparisons driving the significant differences (Lenth ).
For beta diversity analyses and ordinations, a robust Atchison principal coordinate analysis (RPCA) was performed, which is designed to deal with microbiome data, which are composed of matrices with a high abundance of zeros (Martino et al. ). RPCA has been shown to improve the robustness of PCA through its matrix completion algorithm (Martino et al. ). The RPCA was implemented through the DEICODE plug-in in QIIME2 (Martino et al. ). A distance matrix was constructed, and statistical differences in seasonal composition were compared with a permutational ANOVA (PERMANOVA) implemented by vegan::adonis in R (Anderson , Oksanen et al. ). We constrained permutations to account for the random effect of individual red pandas. Significant differences in OTU relative abundance between seasons were determined using Maaslin2, implementing linear models with a log-transformation, with season as a fixed effect and individual red panda as a random effect (Mallick et al. ).
Finally, to determine which microbiota were maintained over time in red pandas, we used an abundance-occupancy approach to highlight “core” microbial taxa (Shade and Stopnisek ), OTUs and families were ranked based on their occupancy and abundance across samples. We used a <2.0% contribution to Bray–Curtis community composition as a cutoff (Bray and Curtis ) to identify the taxa that are maintained over time and are important for the community structure of the gut microbiome.
Between-species comparisons
To determine differences in richness between species, the number of observed OTUs in each sample was calculated in QIIME2 on rarefied data using the core-metrics plug-in (Bolyen et al. ). For all three species, sequencing datasets were rarefied to 5000 reads without replacement. Kruskal–Wallis tests were performed to determine statistically significant differences in alpha diversity between species, and in cases where significant differences were identified in comparisons with more than two groups, subsequent pairwise Kruskal–Wallis tests with a Benjamini–Hochberg (BH) correction were applied in R to determine the comparisons driving significant differences (Kruskal and Wallis , Benjamini and Hochberg , R Core Team ).
Two types of beta diversity analyses were conducted as follows: first, we calculated the Jaccard index in QIIME2 on sequencing datasets rarefied to 5000 reads (Jaccard ). Jaccard was used to determine the overlap of microbial taxa (presence/absence) between samples taken from the same individual in different seasons (i.e. turnover). For this purpose, we calculated the mean Jaccard distance between the samples taken from an individual in two subsequent seasons. Significant differences in turnover between species were determined using a linear mixed effects model with species and season as fixed effects and individual as a random factor implemented through the nlme R package (Pinheiro and Bates ). Second, to examine whether the composition of the gut microbiome of different individual animals within a species changes in the same ways across seasons [i.e. whether individuals follow the same trajectories in principal coordinate (PC) space], we performed an RPCA implemented through the DEICODE plug-in in QIIME2 (Martino et al. ). PC1 and PC2 scores were extracted for each species (ordinated separately) and standardized to create z-scores for interspecies comparisons. Only individuals with sufficient sample numbers in each season were included. Due to this, for red pandas, we excluded three individuals (Angus, Rusty, and Shama). These values were used as the response variable in Bayesian hierarchical models implemented using the R package jagsUI for each species with season as a predictor variable and individual as the lower level in the hierarchy (Kellner ).
To understand how the different species might vary in the nature of the relationships between microbial taxa (i.e. in the co-occurrence of different microbial taxa), we created co-occurrence networks created using the NetCoMi package implementing the ccrepe network construction method, including the top 50 most abundant taxa from five individuals from each species (n = 60 per species) (Peschel et al. , Schwager and Weingart ). The degree (number of connected nodes) of each node and the mean degree for each network were calculated.
Figure generation
All figures were created in R using the libraries ggplot2, qiime2R, phyloseq, ggraph, igraph, and tidygraph (Csardi and Nepusz , McMurdie and Holmes , Hadley Wickham : 2, Bisanz : 23, Pedersen , ).
Results
The seasonal dynamics of the red panda gut microbiome
Red panda gut microbiomes showed seasonal differences and high variation within a season. Shannon diversity changed significantly across seasons, with differences most dramatic at the winter/spring transition (Fig. 1A; P < 0.001, F = 6.84, df = 3; P = 0.001 for the winter/spring transition). Season was a significant determinant of microbiome community structure, and the red panda gut microbiome composition was significantly different between seasons (Fig. 1B–E; PERMANOVA P = 0.001, pseudo-F = 5.60). This change in community composition was driven in part by several taxa that changed significantly across the seasons (Fig. 1F; all q-values < 0.001), most notably an OTU belonging to Escherichia–Shigella, which becomes most dominant in seasons where Shannon diversity is lower (fall, spring, and summer). Despite seasonal variation, our abundance-occupancy analysis showed that a number of taxa were maintained in red panda samples across the seasons. These included OTUs belonging to Escherichia–Shigella, Streptococcus, Turicibacter, and Clostridium sensu stricto, among others (Table S2).
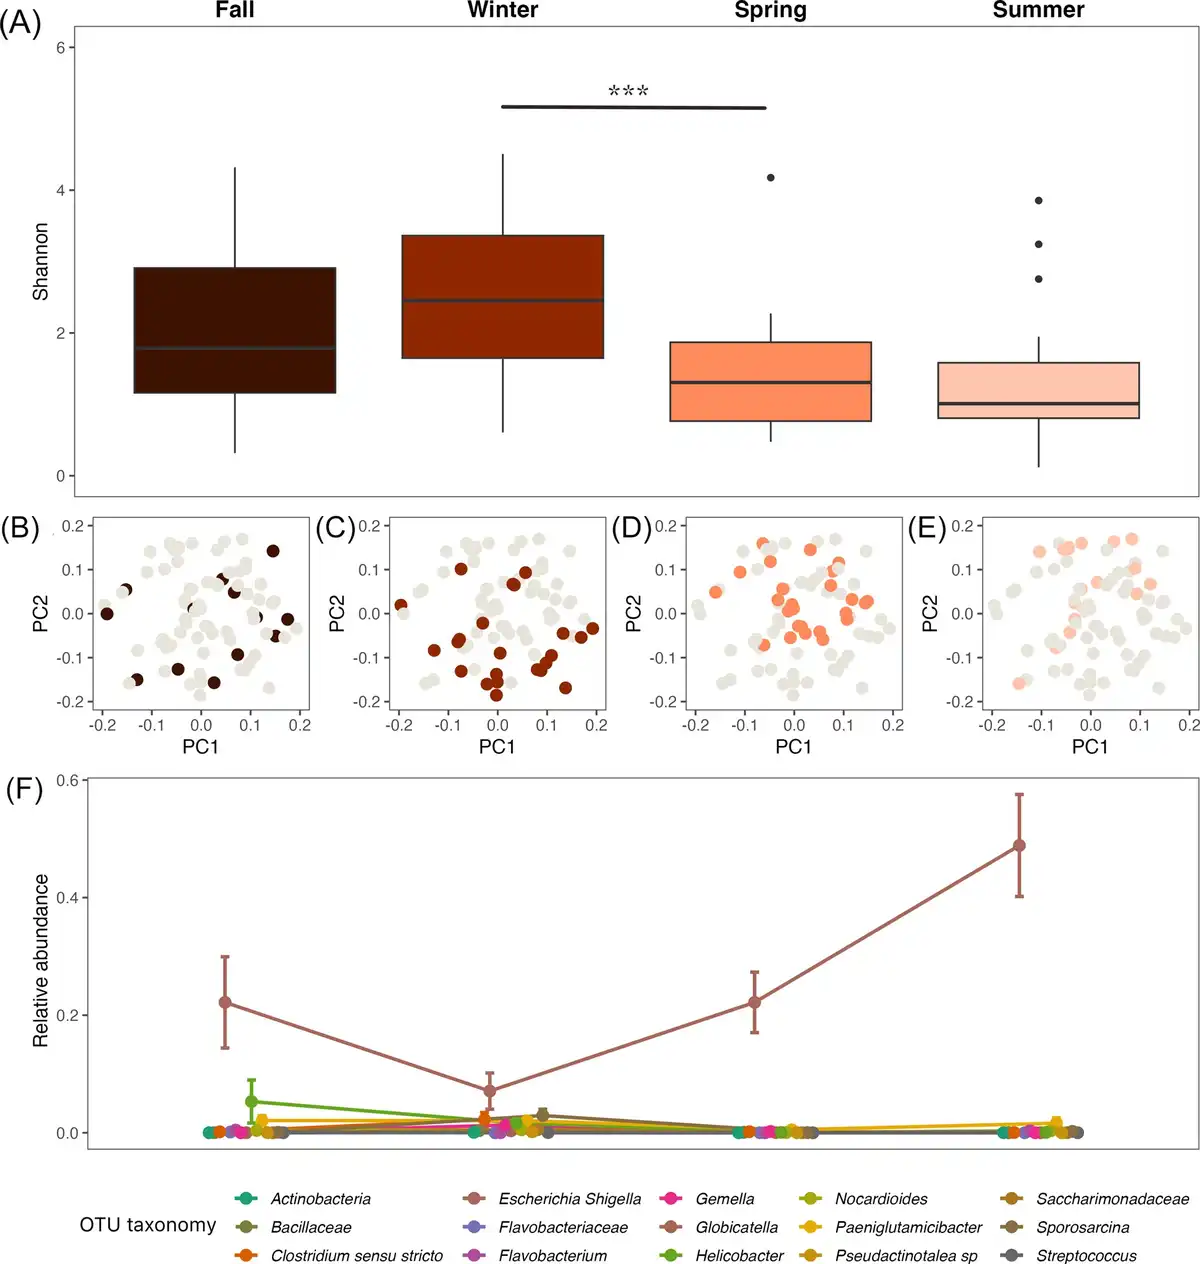
Figure 1
The seasonal dynamics of the red panda gut microbiome. (A) The alpha diversity (Shannon) of the red panda gut microbiome varied between seasons, changing significantly at the winter to spring transition (*** indicates P < 0.001). (B–E) The beta diversity (robust Aitchison PCA) of the red panda gut microbiome was significantly different between seasons. PC1 = 56.50% variance explained; PC2 = 30.79% variance explained. (F) The relative abundance (proportion) of several key taxa changed across the seasons, most notably in an OTU annotated as belonging to the genus Escherichia–Shigella. Points show the mean relative abundance in each season; bars indicate standard error.
Comparisons of diversity and seasonal dynamics of the red panda, tiger, and rhinoceros gut microbiome
Our sequencing results showed that the gut microbiota of rhinos is overwhelmingly dominated by the classes Bacteroidia (70.7% mean relative abundance across all samples, Notus = 159) and Clostridia (18.7%, Notus = 350). At the order level, these OTUs were classified as Bacteroidales (71.0%), Lachnospirales (7.98%), and Oscillospirales (6.20%). The gut microbiota of tigers is dominated by Clostridia (44.0%, Notus = 133), Bacteroidia (25.2%, Notus = 40), and Fusobacteria (19.2%, Notus = 17). At the order level, these dominant OTUs were classified as Bacteroidales (25.2%), Lachnospirales (25.1%), Fusobacteriales (19.2%), Peptostreptococcales (9.51%), and Clostridiales (9.02%). The gut microbiota of red pandas consisted primarily of Bacilli (38.1%, Notus = 263), Gammaproteobacteria (28.2%, Notus = 317), Clostridia (14.3%, Notus = 260), and Actinobacteria (8.18%, Notus = 273). At the order level, these dominant OTUs were classified as Enterobacterales (23.1%), Lactobacillales (22.2%), Erysipelotrichales (12.5%), Clostridiales (11.7%), Micrococcales (6.83%), Pseudomonadales (2.64%), and Bacillales (2.46%).
When compared to the gut microbiome of tigers and rhinos, red pandas have an intermediate OTU diversity in their gut microbiome with higher individual level variation (Fig. 2A; Kruskal–Wallis P < 0.001; X2= 78.707). Despite having an intermediate level of diversity, individual red pandas replace the most microbes between seasons, as they show the highest seasonal turnover in the gut microbiome (Fig. 2B). Using a linear mixed effect model with species and season as interacting fixed effects and individual as a random effect, turnover differed significantly at all seasonal transitions between species (P < 0.001 for all species comparisons), and turnover differed by season only in rhinos, driven by the difference in the fall/winter transition as compared to the other seasonal transitions (P < 0.003 for rhino winter/spring vs. fall/winter and spring/summer vs. fall/winter). When considering how individuals move through PC space across the seasons, individual rhinos largely follow the same trajectory over time (Fig. 3A), as illustrated by their relatively narrow credible intervals (Fig. 3B). Tigers and red pandas are similar as both species show high interindividual variability in the seasonal trajectories of their microbiomes, as illustrated by relatively wide credible intervals (Fig. 3A and B). In other words, individual tigers and red pandas respond in different ways to the seasonal transitions.
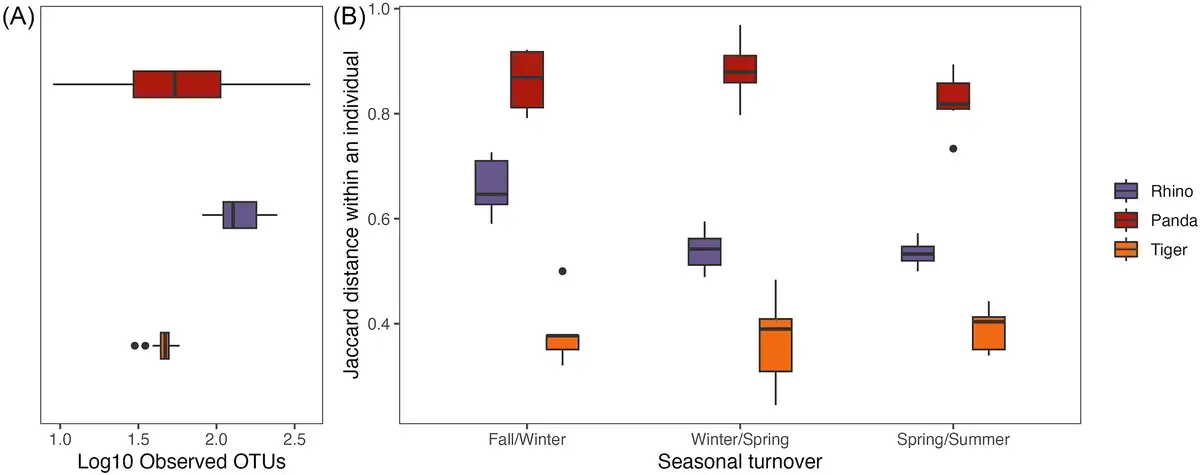
Figure 2
Seasonal turnover and alpha diversity of tiger, red panda, and rhino gut microbiomes at the species level. (A) Boxplots show observed OTU counts on a log scale for samples from the three species. Alpha diversity is highest in rhinos but the variation in alpha diversity is highest in red pandas. (B) Boxplots show the level of turnover (i.e. Jaccard distances between the gut microbiomes of individuals in two subsequent seasons) in the three species. The seasonal turnover in the gut microbiome is highest in red pandas, moderate in rhinos, and lowest in tigers. (Significance values not indicated in the figure; refer to the text.)
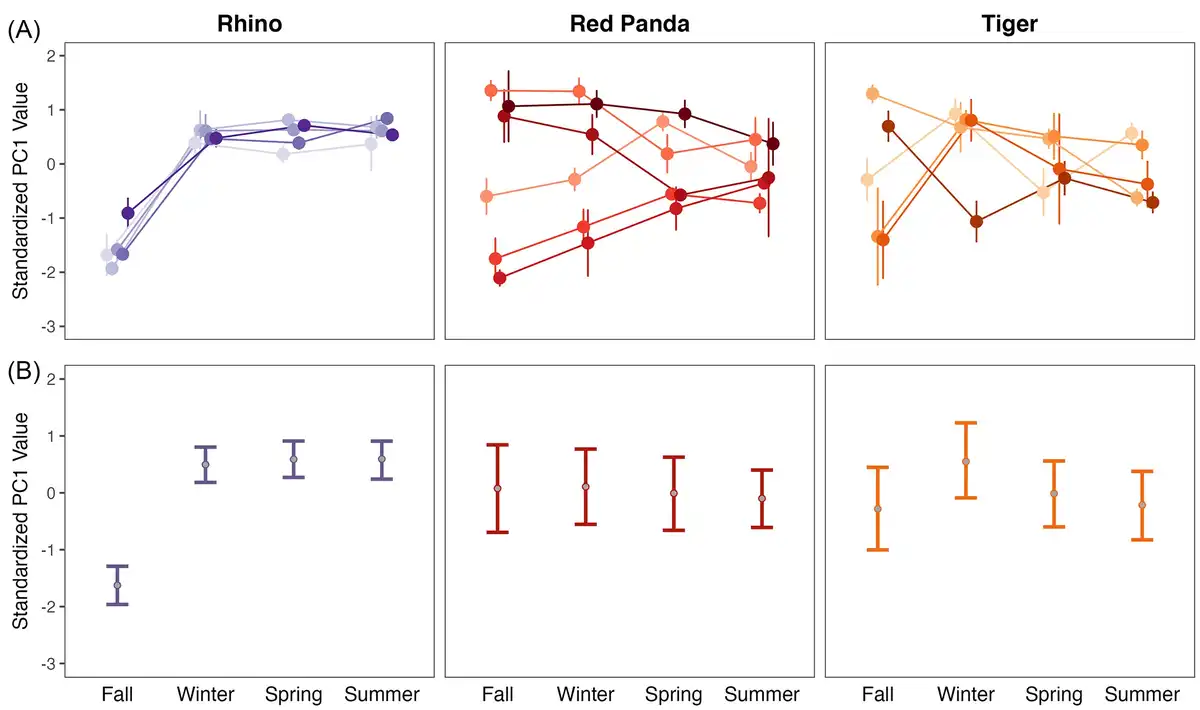
Figure 3
Seasonal volatility in the individual microbiomes of rhinos, red pandas, and tigers. (A) Mean and standard error of standardized PC1 values of different individuals of each species across four seasons (PC1 = 67.56% variation explained for rhinos, 56.50% for red pandas, and 50.72% for tigers). Individual points connected by lines indicate individual animals; error bars indicate standard error within an individual across samples in that season. Individual rhinos move synchronously through PC space at the across seasons, particularly as compared to the dyssynchronous trajectories of individual red pandas and tigers. (B) Bayesian hierarchical model parameter estimates for PC1. Points show the mean PC1 value across all individuals, error bars show the 95% credible intervals for PC1 values.
Comparisons of co-occurrence of microbial taxa within rhinos, tigers, or pandas
When examining the co-occurrence networks within southern white rhinos, Sumatran tigers, or red pandas, rhinos and tigers show high interconnectedness, indicating that many taxa may be interacting and that the relative abundance of one taxon often depends on another, if not many others (Fig. 4A). This is illustrated by the degree distribution of the rhino and tiger networks, where a node has a mean degree (number of connections; k) of 10. In rhinos, 5% of all possible connections occurs and in tigers, it is 5.4% (Fig. 4B). In contrast, red pandas illustrate a low connectivity, and the degree distribution highlights how many taxa are connected to no—or few—other taxa, resulting in a mean degree (k) of 3.96 and only 2.7% of all possible links realized. Moreover, red pandas had only positive associations among networked taxa, while both tiger and rhino networks showed positive and negative associations (rhinos: 20% positive, 80% negative; tigers: 24% positive, 76% negative).
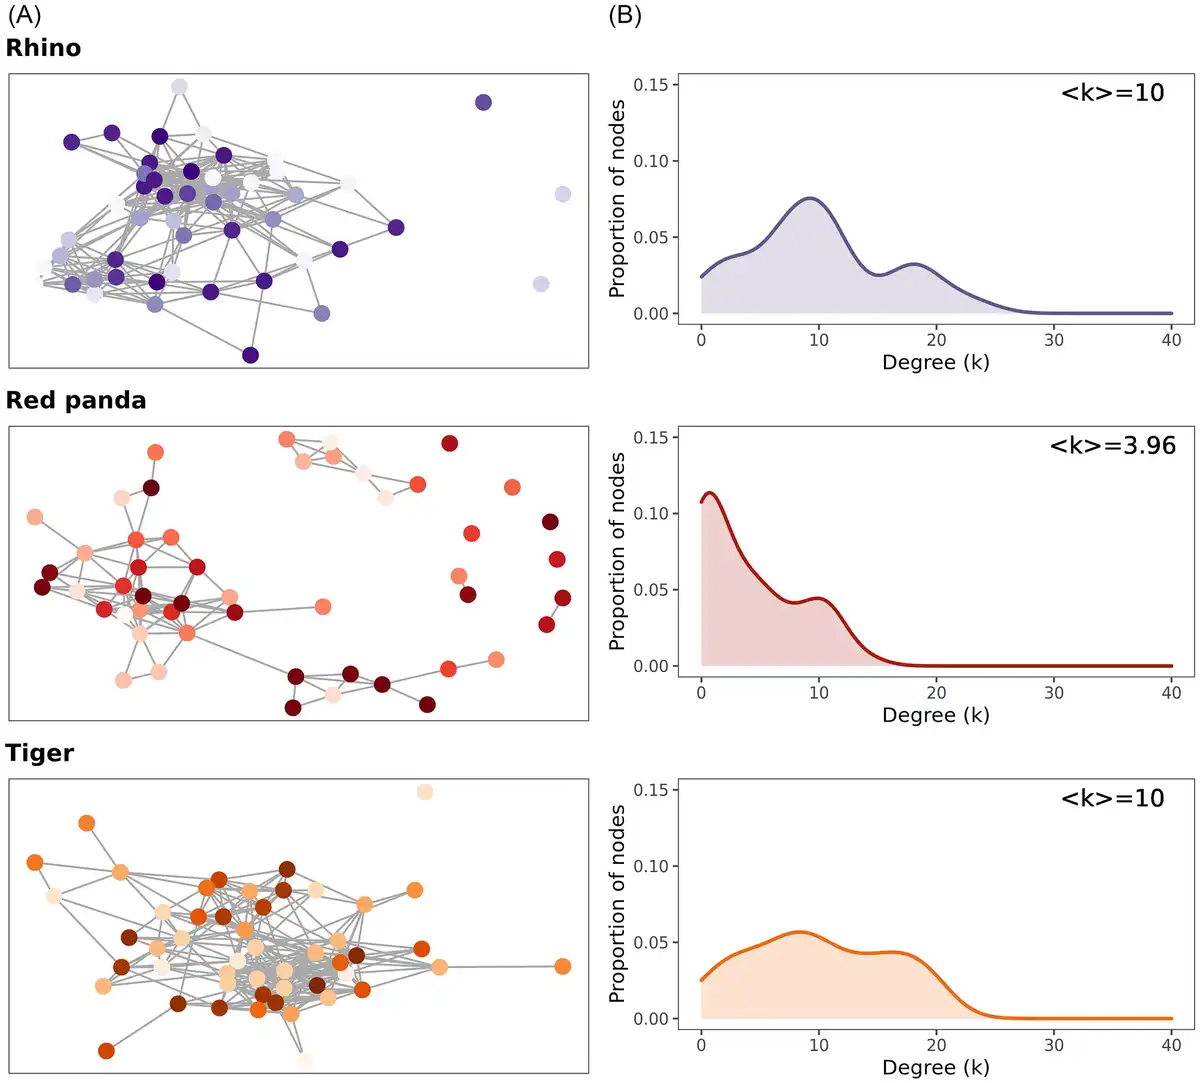
Figure 4
Co-occurrence networks and degree distributions showing the connectivity of microbial taxa in each species. (A) Networks showing links between the top 50 most abundant OTUs in each species. Individual points indicate unique OTUs. Red pandas have a higher number of peripheral, disconnected nodes. (B) The distribution of degrees (number of connections; k) across the nodes in each network. <k> indicates the mean number of degrees for each node. Red pandas have a higher proportion of nodes with no or few connections compared to rhinos or tigers.
Discussion
The gut microbiome plays an important role in host health and can be highly dynamic—changing over an hours-to-months time frame. How variable the gut microbiome is may vary systematically among animal taxa, though few studies have sought to characterize these differences, particularly at the individual level. Understanding the patterns of gut microbiome stability across the tree of life may help discern how generalizable cross-sectional results are for a particular taxonomic group. Moreover, untangling these patterns may yield interesting information about how a more—or less—variable gut microbiome may result from certain ecological and evolutionary pressures. Here, we investigated the relative roles of host species identity and diet in shaping the seasonal dynamics of gut microbiomes by drawing comparisons between a herbivore (the southern white rhinoceros), a carnivore (the Sumatran tiger), and a herbivorous carnivore (the red panda)—whose plant-based diet poorly matches its carnivore-like gastrointestinal anatomy. We found that the red panda exhibits marked seasonal variation in its gut microbiome, in part driven by the dramatic change in abundance of one Escherichia–Shigella OTU. Through comparison with other species, our analysis showed that its high levels of seasonal variation may be due to decreased connectivity of microbial taxa, a low proportion of negative interactions, and a high degree of variation in the number of microbial taxa comprising an individual’s gut microbiome at any given point. Our results have implications for the understanding of how a host’s evolutionary history and diet may together inform the dynamics of its gut microbiome.
The red panda gut bacterial community changed significantly throughout the year. Both the richness and community composition of the gut microbiota shifted at the transition between seasons. Red pandas also replaced more microbial taxa from season to season (i.e. had higher turnover) than both rhinos and tigers, a pattern that has also been observed in giant pandas—herbivorous carnivores that consume bamboo year-round similar to red pandas (Xue et al. ). Across the year, the relative abundance of several bacterial taxa also changed, including one OTU belonging to Escherichia–Shigella, which varied dramatically in its relative abundance, from 5% to 40%. This taxon had an inverse relationship with alpha diversity, but the causative directionality of this relationship is unclear. Escherichia–Shigella has previously been noted as a dominant member of the red panda gut microbiome, as we found here (Williams et al. , Zeng et al. ), as well as that of giant pandas (Xue et al. , Williams et al. , McKenney et al. ). While it may be an innocuous member of the gut microbiota of red pandas, shifts toward an Escherichia–Shigella-dominated gut microbiota between seasons have previously been linked to dysbiosis, gastrointestinal distress, and mucoid stool production in giant pandas (Williams et al. , ). Moreover, gastrointestinal distress has been noted as a common issue in red pandas, and future studies could characterize which specific environmental changes lead to dominance of Escherichia–Shigella and whether this has an impact on the prevalence of gastrointestinal distress as has been suggested for giant pandas (Philippa and Ramsay ).
In giant pandas, high microbiome variability has been hypothesized to be related to the consumption of bamboo, more specifically both seasonal changes in the parts of bamboo plants that pandas selectively consume and seasonal changes in the nutritional content of bamboo plants (Williams et al. , , Xue et al. , Wu et al. , Yao et al. ). Similar to giant pandas, wild red pandas were found to consume lower levels of bamboo dry matter in spring as compared to autumn and winter, despite being presented with the same proportion of bamboo parts (Wei et al. ). Moreover, bamboo leaves vary in protein, hemicellulose, cellulose, and lignin content throughout the year (Wei et al. , Wei and Zhang ). Thus, if panda dietary bamboo is nutritionally different in summer and autumn, the bacterial community of the red panda gut should vary by season but with similar trends among individuals undergoing the same diet shifts. However, this was not the case here. Rather, each individual red panda’s gut microbiota composition appeared to follow a unique trajectory throughout the year, and red pandas clustered loosely in each season. This individual volatility was similar to that observed in tigers, though tigers exhibited lower overall community turnover across the season despite interindividual variation in the precise compositional nature of these changes. In other words, individual tigers replace fewer microbial taxa between seasons than red pandas, but the compositional changes vary among individuals to a similar degree. This illustrates that, like red pandas, all individual tigers may not respond to the same seasonal cues in the same ways.
In contrast, individual rhinos responded to the same environmental stimuli in the same manner, and while they experienced seasonal variation in the composition of their gut microbiota, they remained closely clustered at the population level. This may be due to the fact that rhinos have a close reliance on their gut microbiota for dietary degradation via fermentation in the hindgut (Flint et al. ). If seasonal changes in food composition occur, each individual rhino’s microbiome may respond in a similar manner due to the disproportionate role the microbiome plays in host nutrient acquisition—e.g. through host-driven pressure to maintain sufficient nutrient acquisition. While a previous study posited that the red panda hosts several taxa that possess the ability to degrade plant material, there is no evidence that this actually occurs, as the red panda gut has an extremely short passage time that may preclude fermentation (Wei and Zhang , Kong et al. ). Of the taxa our analysis deemed to be core in red pandas, only one genus, Ruminococcus, has previously been characterized as having cellulolytic activity in a host environment. However, the red panda-associated Ruminococcus taxon is in the Lachnospiraceae family, most closely related to Ruminococcus gnavus, a human-associated symbiont known primarily for mucin metabolism (Crost et al. ). Thus, the degree to which an animal relies on its microbiome for major functions such as nutrient acquisition may affect how tight the host–microbiome association is and its level of predictability between hosts and across time.
Our network analysis showed that, in contrast to a traditional herbivore and carnivore, the red panda has an exceptionally disconnected gut microbial community with low levels of competitive interactions. We suggest that this, combined with high levels of microbial diversity, may contribute to the high levels of turnover and individual volatility observed in the gut microbiome. While rhinos harbor the highest levels of microbiome richness, they experience only moderate turnover and relatively high synchronicity between individuals, likely due in part to higher levels of competitive interactions. Similarly, tigers also exhibited low levels of turnover between the seasons, possibly as a result of high levels of connected taxa within the network and low overall microbiome richness. Our findings are in line with existing theory regarding network structure and diversity in the microbiome, which posits that high diversity, low levels of competition, lower host control, and lower compartmentalization should lead to high levels of microbiome instability (i.e. frequent changes in the sets of microbial species present in an individual) (Coyte et al. ). This is the pattern we see in red pandas, which exhibit all of these characteristics.
Beyond microbial diversity and connectivity, host effects may also contribute to explaining aspects of microbiome stability. Herbivores, such as rhinos, have long-standing co-evolutionary relationships with their gut microbiota and specialized gastrointestinal compartments that maintain microbial communities (Groussin et al. ). Herbivore-related bacterial taxa also arose early on in bacterial evolution (>200 Mya), creating deep phylogenetic relationships between herbivores and their bacterial taxa. Carnivore-related bacterial taxa arose more recently (as little as 150 Mya), and thus, while tigers may not exhibit the same extent of host–microbe co-evolution, the timescale of host–microbe co-evolution in carnivores is still several orders of magnitude longer than that of red pandas who experienced a diet switch from carnivory to herbivory only during the Pleistocene (<3 Mya) (Salesa et al. , Groussin et al. ). The mismatch between red panda’s gastrointestinal anatomy and their diet may induce a state where it is difficult for them to harbor a carnivore-like community (due to their lack of symbionts and symbiont-required nutrients from their diet) and simultaneously difficult to harbor a herbivore-like community (due to the lack of gastrointestinal compartmentalization). Thus, decoupling their diet from phylogeny precludes the acquisition of microbes that may have co-evolved with the host and each other (Groussin et al. ). This mismatch may, in turn, lead to a volatile microbial community. If the red panda is indeed decoupled from a suitable microbial community, the question remains—what role might the gut microbiome of red pandas play?
Altogether, we found that the red panda gut microbiome is exceptionally volatile when compared to a “traditional” herbivore and a carnivore. Individual red pandas experience high levels of microbial replacement (turnover) between seasons and respond in idiosyncratic ways to seasonal transitions. There are several limitations to our study that warrant further investigation in this area. First, our comparisons are limited to a single herbivore and carnivore, and understanding the generalizability of our results requires the inclusion of additional species. This work highlights the microbiome field’s need for increased numbers of longitudinal datasets with repeat samples collected from the same individuals. Second, differences in DNA extraction and sequencing methodologies might affect our comparisons of richness and diversity between species. In addition, it is possible that these differences might affect the structure of our networks. However, to attempt to minimize bias associated with sequencing errors, we clustered all sequences into 97% OTUs. We rarefied our datasets before diversity metrics and standardized the number of individuals and taxa included in our network analyses. Additionally, several microbiome studies have found that the effect of storage and extraction method on sequencing results is often smaller than the effect of individual or species identity (Carroll et al. , Blekhman et al. , Song et al. , Bartolomaeus et al. , Keady et al. ). Therefore, the signature of host species likely trumps any technical confounders. Moreover, our primary comparisons do not rely on the detection of the same OTUs across animal taxa; rather, we are concerned with temporal patterns (i.e. comparing time point to time point) within a particular species, and within each animal species, protocols were standardized.
Additionally, due to difficulty in obtaining intensive longitudinal fecal samples from zoo-housed animals, particularly those that are non-contact, such as tigers, our sampling efforts varied in their geographic location and year. As a result, there may have been different environmental changes experienced by our different species. However, our results for red pandas were recapitulated in a smaller dataset collected from a separate zoo (Fig. S1), suggesting that despite differences in geography or precise seasonal influences, the effect of host species likely predominates. Finally, the animals we studied were housed in human care, and this may cause differences compared to the true dynamics of their gut microbiome in the wild, where additional ecological variables may influence seasonal variation. Despite these limitations, our study highlights that the microbiome does not behave the same way temporally in all species and improves our understanding of what factors may influence community stability, which is important for moving microbiome science toward a mechanistic and predictive framework.
How the microbiome fluctuates in an individual and species over time is particularly important for our understanding of which microbial taxa are essential for an animal host, how these communities respond to environmental change, and what role the gut microbiome might play in host fitness. We found that the red panda’s gut microbiome possesses low levels of connectivity, high variation in richness, high variation in how individuals’ gut microbiomes respond to seasonal changes, and high levels of seasonal turnover. We suggest that these factors may be in part a relic of its evolutionary history, which may have produced a scenario in which host–microbiome co-evolution has been disrupted.
Acknowledgements
The authors would like to thank the Memphis Zoological Society red panda care staff, Melanie Lewis, Louie Bell, Fred Wagner, Morgan Powers, and Gail Karr; Jessica Cordell (National Zoological Park, Smithsonian Conservation Biology Institute); William T. Ford (Mississippi State University); and San Diego Zoo Wildlife Alliance tiger and rhino wildlife care specialists, including Jonnie Capiro, Jill Van Kempen, Marco Zeno, Scott Smith, Weston Popichak, and Todd Schwenk for assistance in sample collection. We would also like to thank all members of the Applied Biotechnology Laboratory at Mississippi State University, especially Olivia K. Crowe; Garret Suen’s Lab (University of Wisconsin-Madison), especially Kimberly A. Dill-McFarland; and San Diego Zoo Wildlife Alliance’s Kira L. Marshall, Corinne Pisacane, Kelly Sagen, Peyton Flynn, and Lisa Dvorak for their assistance in sample processing. We also thank Michelle Herrera for assistance with library preparation. We would like to thank Stephen Waldren, Brittany M. Berdy, and Kimberly A. Dill-McFarland for their support, insightful discussions, and careful reading of manuscript drafts. This project was approved under the Institutional Animal Care and Use Committee (IACUC) protocol number #13-02 at the Smithsonian National Zoo. At the San Diego Zoo Safari Park, the project was considered non-invasive and therefore IACUC-exempt.
References
- Akiko S, Hayakawa T, Yosuke K, et al Seasonal responses and host uniqueness of gut microbiome of Japanese macaques in lowland Yakushima. Anim Microbiome. 2022;4:54. https://doi.org/10.1186/s42523-022-00205-9.
- Anderson MJ. Permutational Multivariate Analysis of Variance (PERMANOVA). Auckland, New Zealand: Wiley StatsRef: Statistics Reference Online, John Wiley & Sons, Ltd, 2017, 1–15.
- Baek YC, Choi H, Jeong J-Y, et al The impact of short-term acute heat stress on the rumen microbiome of Hanwoo steers. J Anim Sci Technol. 2020;62:208–17.
- Bartolomaeus TUP, Birkner T, Bartolomaeus H, et al Quantifying technical confounders in microbiome studies. Cardiovasc Res. 2021;117:863–75.
- Benjamini Y, Hochberg Y. Controlling the false discovery rate: a practical and powerful approach to multiple testing. J R Stat Soc Ser B Methodol. 1995;57:289–300.
- Bisanz JE. qiime2R: importing QIIME2 artifacts and associated data into R sessions. 2018. https://github.com/jbisanz/qiime2R(15 September 2023, date last accessed).
- Björk JR, Dasari M, Grieneisen L, et al Primate microbiomes over time: longitudinal answers to standing questions in microbiome research. Am J Primatol. 2019;81:e22970.
- Blekhman R, Tang K, Archie EA, et al Common methods for fecal sample storage in field studies yield consistent signatures of individual identity in microbiome sequencing data. Sci Rep. 2016;6:31519.
- Bolyen E, Rideout JR, Dillon MR, et al Reproducible, interactive, scalable and extensible microbiome data science using QIIME 2. Nat Biotechnol. 2019;37:852–7.
- Bray JR, Curtis JT. An ordination of the upland forest communities of southern Wisconsin. Ecol Monogr. 1957;27:325–49.
- Brooks AW, Kohl KD, Brucker RM, et al Phylosymbiosis: relationships and functional effects of microbial communities across host evolutionary history. PLoS Biol. 2016;14:e2000225.
- Callahan BJ, McMurdie PJ, Rosen MJ, et al DADA2: high-resolution sample inference from Illumina amplicon data. Nat Methods. 2016;13:581–3.
- Carroll IM, Ringel-Kulka T, Siddle JP, et al Characterization of the fecal microbiota using high-throughput sequencing reveals a stable microbial community during storage. PLoS One. 2012;7:e46953.
- Core Team R. R: a language and environment for statistical computing. 2021. https://www.R-project.org/(15 September 2023, date last accessed).
- Coyte KZ, Schluter J, Foster KR. The ecology of the microbiome: networks, competition, and stability. Science. 2015;350:663–6.
- Crost EH, Le Gall G, Laverde-Gomez JA, et al Mechanistic insights into the cross-feeding of Ruminococcus gnavus and Ruminococcus bromii on host and dietary carbohydrates. Front Microbiol. 2018;9:2558.
- Csardi G, Nepusz T. The igraph software package for complex network research. InterJournal. 2006. Complex Systems:1695. https://igraph.org(15 September 2023, date last accessed).
- Davis D. The giant panda: a morphological study of evolutionary mechanisms. In: Fieldiana: zoology Memoirs. Vol. 3. Chicago, IL: Chicago Natural History Museum, 1964.
- Delsuc F, Metcalf JL, Wegener Parfrey L, et al Convergence of gut microbiomes in myrmecophagous mammals. Mol Ecol. 2014;23:1301–17.
- Eichmiller JJ, Hamilton MJ, Staley C, et al Environment shapes the fecal microbiome of invasive carp species. Microbiome. 2016;4:44.
- Flint HJ, Bayer EA, Rincon MT, et al Polysaccharide utilization by gut bacteria: potential for new insights from genomic analysis. Nat Rev Micro. 2008;6:121–31.
- Groussin M, Mazel F, Sanders JG, et al Unraveling the processes shaping mammalian gut microbiomes over evolutionary time. Nat Commun. 2017;8:14319.
- Jaccard P. Nouvelles recherches sur la distribution florale. Bull Société Vaudoise Sci Nat. 1908;44:223–70.
- Katoh K, Misawa K, Kuma K, et al MAFFT: a novel method for rapid multiple sequence alignment based on fast Fourier transform. Nucleic Acids Res. 2002;30:3059–66.
- Kau AL, Ahern PP, Griffin NW, et al Human nutrition, the gut microbiome and the immune system. Nature. 2011;474:327–36.
- Keady MM, Prado N, Lim HC, et al Clinical health issues, reproductive hormones, and metabolic hormones associated with gut microbiome structure in African and Asian elephants. Anim Microbiome. 2021;3:85.
- Kellner K. jagsUI: a wrapper around rjags to streamline JAGS analyses. R Package Version. 2015; 1. https://CRAN.R-project.org/package=jagsUI(15 September 2023, date last accessed).
- Kong F, Zhao J, Han S, et al Characterization of the gut microbiota in the red panda (Ailurus fulgens). PLoS One. 2014;9:e87885.
- Köster J, Rahmann S. Snakemake–a scalable bioinformatics workflow engine. Bioinforma Oxf Engl. 2012;28:2520–2.
- Kruskal WH, Wallis WA. Use of ranks in one-criterion variance analysis. J Am Statist Assoc. 1952;47:583–621.
- Lenth RV. Emmeans: e stimated Marginal Means. Aka Least-Squares Means. 2023. https://cran.r-project.org/web/packages/emmeans/index.html(15 September 2023, date last accessed).
- Ley RE, Hamady M, Lozupone C, et al Evolution of mammals and their gut microbes. Science. 2008;320:1647–51.
- Li Y, Guo W, S, et al The evolution of the gut microbiota in the giant and the red pandas. Sci Rep. 2015;5:10185.
- Lim SJ, Bordenstein SR. An introduction to phylosymbiosis. Proc Biol Sci. 2020;287:20192900.
- Mallick H, Rahnavard A, McIver LJ, et al Multivariable association discovery in population-scale meta-omics studies. PLoS Comput Biol. 2021;17:e1009442.
- Martino C, Morton JT, Marotz CA, et al A novel sparse compositional technique reveals microbial perturbations. mSystems. 2019;4:e00016–19.
- McKenney EA, Maslanka M, Rodrigo A, et al Bamboo specialists from two mammalian orders (Primates, Carnivora) share a high number of low-abundance gut microbes. Microb Ecol. 2018;76:272–84.
- McMurdie PJ, Holmes S. phyloseq: an R package for reproducible interactive analysis and graphics of microbiome census data. PLoS One. 2013;8:e61217.
- Muegge BD, Kuczynski J, Knights D, et al Diet drives convergence in gut microbiome functions across mammalian phylogeny and within humans. Science. 2011;332:970–4.
- Oksanen J, Simpson GL, Blanchet FG, et al Vegan: Community Ecology Package . 2022. https://cran.r-project.org/web/packages/vegan/index.html(15 September 2023, date last accessed).
- Pedersen TL. Ggraph: An Implementation of Grammar of Graphics for Graphs and Networks. 2021. https://cran.r-project.org/web/packages/ggraph/index.html(15 September 2023, date last accessed).
- Pedersen TL. Tidygraph: A Tidy API for Graph Manipulation. 2022. https://cran.r-project.org/web/packages/tidygraph/index.html(15 September 2023, date last accessed).
- Peschel S, Müller CL, von Mutius E, et al NetCoMi: network construction and comparison for microbiome data in R. Brief Bioinform. 2021;22:bbaa290.
- Philippa J, Ramsay E. Captive red panda medicine. In: Red Panda: biology and conservation of the first panda. Amsterdam, Boston: Elsevier/Academic Press, 2011, 271–85.
- Pinheiro J, Bates D. nlme: Linear and Nonlinear Mixed Effects Models. 2023. https://cran.r-project.org/web/packages/nlme/index.html(15 September 2023, date last accessed).
- Price MN, Dehal PS, Arkin AP. FastTree 2–approximately maximum-likelihood trees for large alignments. PLoS One. 2010;5:e9490.
- Quast C, Pruesse E, Yilmaz P, et al The SILVA ribosomal RNA gene database project: improved data processing and web-based tools. Nucleic Acids Res. 2013;41:D590–6.
- Rognes T, Flouri T, Nichols B, et al VSEARCH: a versatile open source tool for metagenomics. PeerJ. 2016;4:e2584.
- Rojas CA, Ramírez-Barahona S, Holekamp KE, et al Host phylogeny and host ecology structure the mammalian gut microbiota at different taxonomic scales. Anim Microbiome. 2021;3:33.
- Salesa MJ, Antón M, Peigné S, et al Evidence of a false thumb in a fossil carnivore clarifies the evolution of pandas. Proc Natl Acad Sci U S A. 2006;103:379–82.
- Schmidt E, Mykytczuk N, Schulte-Hostedde AI. Effects of the captive and wild environment on diversity of the gut microbiome of deer mice (Peromyscus maniculatus). ISME J. 2019;13:1293–305.
- Schwager E, Weingart G. Ccrepe: Ccrepe_and_n c.S core., 2021. https://doi.org/10.18129/B9.bioc.ccrepe(15 September 2023, date last accessed).
- Shade A, Stopnisek N. Abundance-occupancy distributions to prioritize plant core microbiome membership. Curr Opin Microbiol. 2019;49:50–8.
- Shannon CE, Weaver W. The Mathematical Theory of Communication. Urbana: University of Illinois Press, 1949.
- Song SJ, Amir A, Metcalf JL, et al Preservation methods differ in fecal microbiome stability, affecting suitability for field studies. mSystems. 2016;1: https://doi. org/10.1128/msystems.00021-16.
- Stevenson DM, Weimer PJ. Dominance of Prevotella and low abundance of classical ruminal bacterial species in the bovine rumen revealed by relative quantification real-time PCR. Appl Microbiol Biotechnol. 2007;75:165–74.
- Troyer K. Microbes, herbivory and the evolution of social behavior. J Theor Biol. 1984;106:157–69.
- Valdes AM, Walter J, Segal E, et al Role of the gut microbiota in nutrition and health. BMJ. 2018;361:k2179.
- Wei F, Feng Z, Wang Z, et al Use of the nutrients in bamboo by the red panda (Ailurus fulgens). J Zool. 1999;248:535–41.
- Wei F, Zhang Z. Red pandas in the wild in China. In: Glatston AR. (ed.), Red Panda Biology.Vol. 1. The Hague: SPB Academic Publishing, 2011.
- Weinstein SB, Martínez-Mota R, Stapleton TE, et al Microbiome stability and structure is governed by host phylogeny over diet and geography in woodrats (Neotoma spp.). Proc Natl Acad Sci USA. 2021;118:e2108787118.
- Wickham H. Ggplot2: elegant Graphics for Data Analysis. New York: Springer-Verlag, 2016.
- Williams CE, Kueneman JG, Nicholson DJ, et al Sustained drought, but not short-term warming, alters the gut microbiomes of wild Anolis lizards. Appl Environ Microb. 2022;88:e00530–22. https://doi.org/10.1128/aem.00530-22.
- Williams CE. SnakeMakeQIIMECW. 2021. https://github.com/claireewilliams/SnakeMakeQIIMECW(15 September 2023, date last accessed).
- Williams CL, Caraballo-Rodríguez AM, Allaband C, et al Wildlife-microbiome interactions and disease: exploring opportunities for disease mitigation across ecological scales. Drug Discov Today Dis Models. 2018;28:105–15.
- Williams CL, Dill-McFarland KA, Sparks DL, et al Dietary changes during weaning shape the gut microbiota of red pandas (Ailurus fulgens). Conserv Physiol. 2018;6:cox075.
- Williams CL, Dill-McFarland KA, Vandewege MW, et al Dietary shifts may trigger dysbiosis and mucous stools in giant pandas (Ailuropoda melanoleuca). Front Microbiol. 2016;7:661.
- Williams CL, Garcia-Reyero N, Martyniuk CJ, et al Regulation of endocrine systems by the microbiome: perspectives from comparative animal models. Gen Comp Endocrinol. 2020;292:113437.
- Williams CL, Willard S, Kouba A, et al Dietary shifts affect the gastrointestinal microflora of the giant panda (Ailuropoda melanoleuca). J Anim Physiol Anim Nutr (Berl). 2013;97:577–85.
- Williams CL, Ybarra AR, Meredith AN, et al Gut microbiota and phytoestrogen-associated infertility in southern white rhinoceros. mBio. 2019;10:e00311–19.
- Wu Q, Wang X, Ding Y, et al Seasonal variation in nutrient utilization shapes gut microbiome structure and function in wild giant pandas. Proc R Soc B. 2017;284:20170955.
- Xue Z, Zhang W, Wang L, et al The bamboo-eating giant panda harbors a carnivore-like gut microbiota, with excessive seasonal variations. mBio. 2015;6:e00022–15.
- Yao R, Yang Z, Zhang Z, et al Are the gut microbial systems of giant pandas unstable?. Heliyon. 2019;5:e02480.
- Zeng Y, Zeng D, Zhou Y, et al Microbial biogeography along the gastrointestinal tract of a red panda. Front Microbiol. 2018;9:1411.
- Zoelzer F, Burger AL, Dierkes PW. Unraveling differences in fecal microbiota stability in mammals: from high variable carnivores and consistently stable herbivores. Anim Microbiome. 2021;3:77.