Key messages
China has implemented national drug negotiations to alleviate the financial burden on patients.
Research on how China's drug prices compare globally under this policy is lacking.
Despite significant price differences among countries, China's negotiation policy has effectively reduced prices for certain high-value medications.
China's drug pricing strategies can provide insights for other developing countries.
The five distinct price indices provide valuable insights into cross-country drug price comparisons.
Introduction
China’s healthcare system has faced numerous challenges, including high medical costs, limited healthcare access, and disproportionate drug prices. Recently, it has focused on regulating drug prices through policy interventions. National drug price negotiations have been the most significant measure to successfully reduce the high costs of innovative medications ().
Numerous studies have assessed these policies’ impact, demonstrating high effectiveness. evaluated 17 innovative medicines and found that negotiations improved availability, utilization, and affordability. By observing claims data in Shandong province, concluded that negotiations improved access to anticancer medicines and alleviated outpatient care’s financial burden.
Existing studies have primarily focused on changes in the cost and burden of innovative drugs before and after policy implementation, with some making international comparison with local drug prices. compared the retail prices of branded drugs in China with those in eight developed countries, adjusting prices based on exchange rates and purchasing power parity (PPP). utilized the Laspeyres price index to compare the top 150 best-selling drugs in a Chinese province with those in six other countries. examined the prices of 25 rare disease drugs across China, Japan, and South Korea using pricing coefficients and price differences as indicators. These studies reached similar conclusions: drug prices in China are relatively higher than the purchasing power of residents in developed countries.
However, these studies used data from either 2009, 2012, or 2020. Additionally, most studies focused on comparisons with developed countries and had limited drug price calculation methodologies. Only a few studies have used the Laspeyres index. Given China’s recent transformative drug price reforms, previous findings may no longer accurately reflect the current pricing landscape. In particular, as the government seeks to reduce the financial burden of essential medicines through price negotiations, it becomes increasingly important to examine China’s negotiated drug prices within a global context.
This study compares the prices of 140 innovative drugs across 15 countries using five price indices: Average Price Index (API), Laspeyres, Paasche, Fisher, and Chained Laspeyres Index. By assessing the price levels of innovative drugs negotiated in China with international prices, this study aims to provide a more accurate depiction of Chinese drug prices on a global scale. These international comparisons offer insights to guide drug price management strategies.
Addressing high drug prices: global measures and initiatives
As global drug prices rise continuously, countries tailor their approaches, ranging from reference pricing and healthcare negotiations to setting maximum prices. Global disparities in drug prices not only reflect governments’ strategic choices but also result from underlying differences in economic development, regulatory environments, and market structures.
United States
In USA, drug pricing is primarily manufacturer-driven, with Pharmacy Benefit Managers (PBMs) acting as intermediaries between manufacturers and pharmacies, negotiating discounts for health insurance plans (, ). They are also experimenting with price negotiations for selected drugs under Medicare Part D ().
United Kingdom
In the UK, the Voluntary Scheme for Branded Medicine Pricing and Access (VPAS) caps the National Health Service (NHS) spending on branded medicines, increasing by 2% annually. Manufacturers contribute 26.5% of their sales to keep NHS spending growth on branded medicines within the limit. Over 90% of suppliers to the NHS participate in VPAS ().
Europe
European countries use price controls through reference pricing, both within groups of similar drugs (reference group pricing) and based on international prices (external reference pricing) (, ). France and Italy negotiate prices with pharmaceutical companies, considering production costs and efficacy (). Germany uses a ‘free pricing’ approach for the first 6 months of a new drug's market entry, followed by negotiated reimbursement prices based on incremental benefits. Drugs without additional benefits are priced through reference pricing ().
Canada
In Canada, the Patented Medicine Prices Review Board (PMPRB) sets interim Maximum List Prices (iMLP) for new patented drugs based on international and domestic comparisons. If prices exceed the iMLP/MLP by 5% or generate excess revenue above CAD 50 000, the PMPRB may initiate an investigation. Manufacturers can voluntarily comply by lowering prices and refunding excess revenues ().
Australia
Australia’s Pharmaceutical Benefits Advisory Committee (PBAC) conducts economic evaluations using cost-effectiveness and cost-minimization analyses to determine drug pricing and reimbursement. After approval from PBAC, prices are negotiated with the applicant. Pricing may be facilitated through five agreements, including Facilitated, New Deed, Existing Deed, No deed, and Secretariat pricing. PBAC may also recommend usage restrictions to ensure equitable resource allocation ().
Japan
In Japan, after drug approval, companies must apply to the Central Social Insurance Medical Council (Chuikyo) to include their drug in the National Health Insurance (NHI) drug price standard. Pricing is determined through similar drug comparison or cost-based methods, with cost-effectiveness evaluations starting since 2019. Reference pricing based on the average retail prices in USA, UK, Germany, and France is also used. Price adjustments are made based on the Average Overseas Price (AOP) ().
South Korea
South Korea introduced the Drug Expenditure Rationalization Plan (DERP) and the Positive List System (PLS) in 2007, where essential drugs’ pricing is negotiated. A Single Price System that encourages market competition by setting a Maximum Allowable Price (MAP) for both original and generic drugs (, ) is also used.
BRICS countries
In Brazil, the Câmara de Regulação do Mercado de Medicamentos (CMED) regulates maximum product price and annual price adjustments. Price evaluations combine economic assessments and external reference pricing, with price caps set according to the lowest prices from nine reference countries. In Russia, maximum prices are set for drugs, including ex-manufacturer, wholesale, and retail prices, with regional variation. Regulatory price limits apply to medicinal products included in an essential medicines list. In India, the National Pharmaceutical Pricing Authority (NPPA) regulates drug prices. Drugs listed on the National List of Essential Medicines (NLEM) are priced at the weighted average of brands with over 1% market share. Prices for non-essential drugs are set by manufacturers but are controlled if price increases exceed 10% annually. In South Africa, the Single Exit Price (SEP) mechanism restricts manufacturers to selling drugs at a single price to all private sector pharmacies and clinics. Annual price increases are regulated, and the government negotiates with pharmaceutical companies to lower prices for patients covered by public health insurance (, ).
China
China launched an innovative national drug price negotiation in 2015, integrating three high-cost innovative drugs into the National Reimbursement Drug List (NRDL). The 2018 establishment of the National Healthcare Security Administration (NHSA) was significant, as it took over the responsibility of these negotiations, intensifying efforts and refining the pricing mechanism. Subsequently, the NRDL has been adjusted annually. The NHSA conducts price negotiations with manufacturers for certain patented and expensive drugs, prioritizing oncology, rare diseases, pediatric diseases, and public health outbreaks (). The goal is to include these drugs in the National Medical Insurance Catalogue at the optimal price, thereby meeting clinical needs. Since 2024, following 7 years of continuous updates, 835 innovative drugs have been incorporated. During the negotiation period, the healthcare fund allocated more than 350 billion RMB for the reimbursement of negotiated drugs, benefiting over 830 million patients ().
Methods
Study design
We conducted a cross-sectional time-series analysis of global quarterly prices for innovative drugs from the first quarter (Q1) of 2017 to the fourth quarter (Q4) of 2022 across 15 countries. A total of 140 innovative drugs were included in the study. Five drug price indices (DPIs) were calculated using PPP for fair international comparison. We compared the gap between patient and wholesale prices internationally, focusing on China. Finally, a subgroup analysis using the Interrupted Time Series (ITS) model was conducted to further investigate the impact of China's price negotiations. As price indices can vary with exchange rates or PPP, we converted monetary values to a common currency: national units per USD. Data and statistical analyses were performed using STATA version 16.0.
Data source
This analysis utilized the Multinational Integrated Data Analysis System (MIDAS®) from Q1 2017 to Q4 2022. The database contains data from 93 countries and regions, covering over 95% of the global pharmaceutical sales market. MIDAS is regularly used in global drug pricing comparisons and expenditure studies (, ). Each drug’s unit price negotiation discount is sourced from the Pharmcube database. It is calculated as the average reduction across various specifications.
The drug price data comprises two sources: (i) wholesale prices—pharmacy purchase and wholesalers’ selling prices and (ii) patient prices—consumer purchase and pharmacies’ selling prices. Pharmacy sales are reported in standardized units, both overall and by sector (retail and hospital). Standardized units are defined as a single tablet or capsule, vial, or 5-mL oral liquid. Products with different specifications are weighted by sales volume. To accurately reflect actual out-of-pocket expenditure, this study used patient prices as the primary measure for calculations, comparing the gap between patient and wholesale prices. Reported data are internally validated against alternate sources ().
Countries and medicines
We selected 15 countries, including 10 with strict drug pricing and reimbursement regulations to compare China’s negotiation and pricing processes: USA, UK, France, Germany, Italy, Canada, Australia, Japan, South Korea, and Turkey. Additionally, we included the BRICS countries—Brazil, Russia, India, and South Africa—with income levels comparable to those of China.
We focused on drugs listed in the NRDL. These drugs are innovative, high-cost, and typically patent-protected or exclusive, reflecting their unique market status (). The inclusion criteria are as follows: (i) drugs included in NRDL through the national drug price negotiation from 2017 to 2022; (2) drugs available in at least eight countries. The second criterion was adopted to strike a balance between data availability and sample size. Requiring data availability in all countries would have led to the exclusion of many drugs, significantly limiting the scope of cross-country comparisons. This approach is consistent with previous studies that have applied similar thresholds to ensure meaningful international comparisons while managing missing data ().
The exclusion criteria are (i) traditional Chinese medicines and drugs; (ii) drugs manufactured by Chinese domestic producers, as most of these do not have no international reference prices. One hundred and forty drugs were retained for analysis. Figure 1 presents the drug selection process.
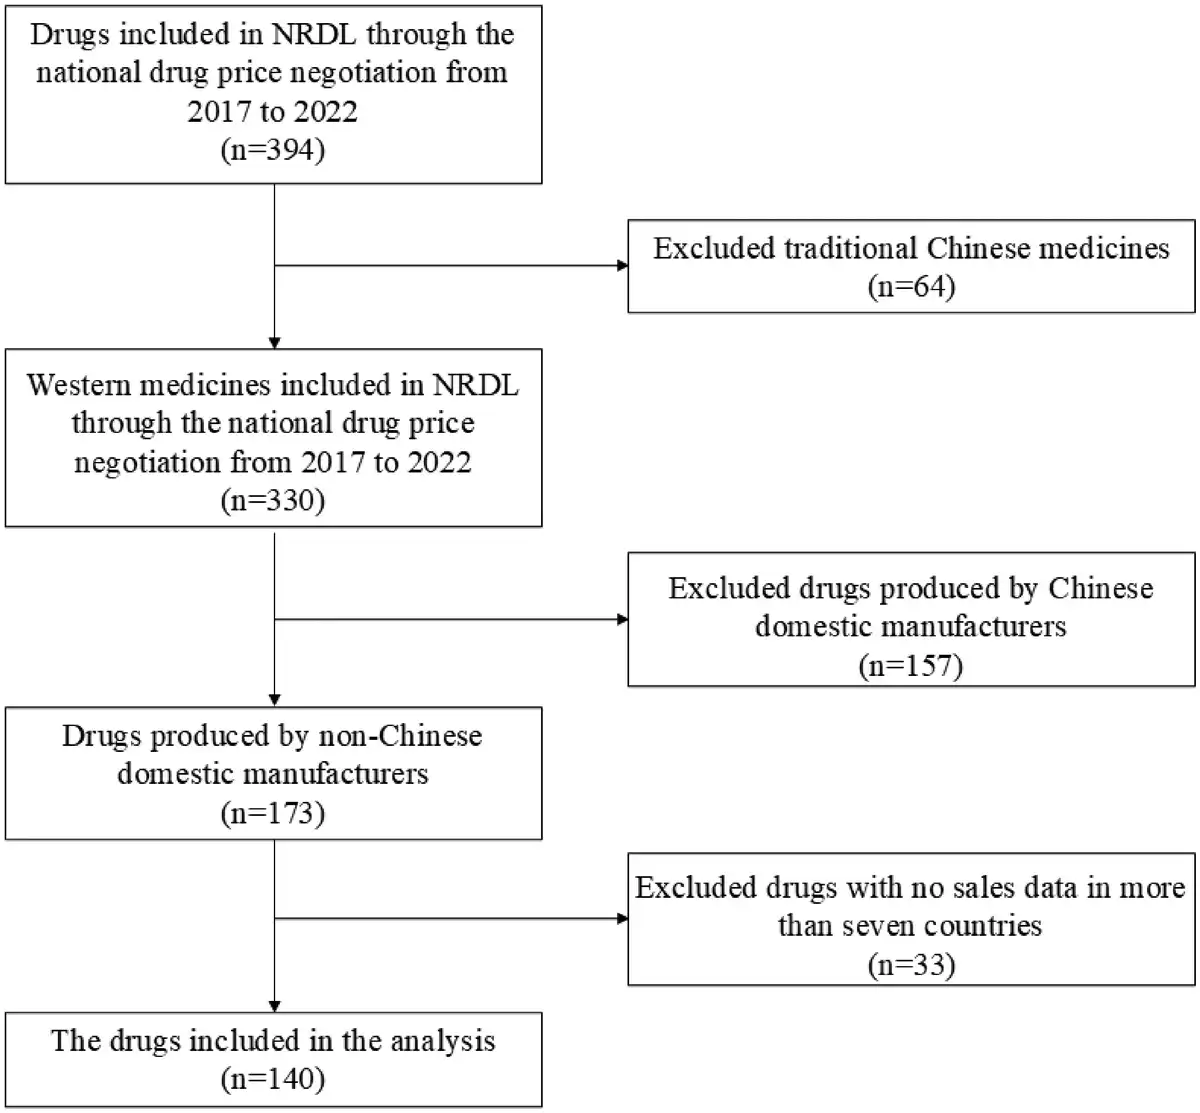
Figure 1
Overview of the drug selection process.
Data analysis
Although exchange rates explain some variations in drug prices over time, adjusting prices based on exchange rates to analyze international price changes is controversial. First, exchange rates fluctuate over time, causing the results to change from when first presented (). Additionally, the currencies of countries with relatively high GDP per capita are overvalued because higher salaries are offset by higher living costs (). PPP is an alternative to exchange rates. Using PPPs to convert currencies enables the comparison of economic output and welfare of inhabitants in real terms (). Therefore, DPIs were adjusted by PPP in USD, with exchange-rate-based prices also presented for comparison.
DPI is suitable for comparing differences in the cost of a basket of goods over time or across countries. This study employed five DPIs, categorized into fixed-weight and non-fixed-weight. To compare drug prices across countries in a meaningful and consistent manner, we adopted the Average Price Index (API) as the primary metric in our analysis. Referencing , this index-based approach enables cross-national comparisons by focusing solely on price differences, without being confounded by variations in drug volume, utilization patterns, or product mix across countries. It provides a transparent and easily interpretable measure of relative price levels across countries. The API, similar in logic to the Consumer Price Index (CPI), is especially suitable for studies where the primary aim is to assess price level differences rather than expenditure burden or market dynamics.
The weighted API is computed as (1):
where denotes the average price of a basket of drugs in country a in quarter t and represents the price of drug i in country a in quarter t. , the fixed sales weight, is based on 2020 US data—the most comprehensive in the database. Q1 2020 covers a wide range of drugs, minimizing interference with price estimation. Additional to quarterly variations, we also calculated the 6-year API per country.
Subsequently, we calculated four other DPIs: the Laspeyres, Paasche, Fisher, and Chained Laspeyres indices, with formulas provided in Equations (2), (3), (4), and (5), respectively:
where P represents the price and Q represents the quantity of drug i in the country. The base period (t = 0) is Q1 2017, and the current time period t is Q4 2022.
The Laspeyres index, the standard index number concept for consumer price indices (CPI) worldwide (), assumes a constant goods quantity in the base period. It does not account for the substitution of products or services in response to current economic conditions (). The Paasche index uses current period fixed weights to reflect current purchase patterns.
A limitation of the Laspeyres and Paasche indices is that they are equally plausible but generally provide different results (). As fixed-weight price indices they fail to address drug market structural shifts owing to new drug introductions and old drug withdrawals, leading to potential deviations in estimating actual long-term price levels ().
To address this limitation, the Fisher price index is introduced, which averages the Paasche and Laspeyres indices to obtain a more accurate price level estimate (). However, it fails to account for missing prices owing to the introduction and withdrawal of new drugs. Contrastingly, the Chained price index connects indices from shorter periods, allowing for the gradual inclusion of new drugs. However, it only shows trend changes over time and lacks clear economic significance with irregular quantities (). In China, the Chained Laspeyres index is used to calculate the CPI. Consequently, it was used in this study.
To assess the impact of China’s drug price negotiations, a subgroup analysis was conducted using the Interrupted Time Series (ITS) model. It was chosen to evaluate price changes of 140 selected innovative drugs before and after negotiations. The ITS model allows for the analysis of time-series data, capturing potential shifts in pricing trends attributable to policy intervention ().
Results
Descriptive analysis of selected drugs
Figure 2 shows the number and average negotiation discount of selected drugs by year. From 2017 to 2022, the number of selected drugs were 21, 15, 32, 27, 19, and 26, respectively. The annual average price reduction ranged from 44.83% to 70.35%, highlighting China's drug negotiation mechanism’s impact on price reduction. In 2022, the price reduction moderated, with the average discount for the selected drugs being 61.78%, similar to the trend for all negotiated drugs that year (average reduction of 60.1%; ). Among the 140 selected drugs, the price reduction for 55 drugs (39.29% of the total) ranged from 60% to 80%, 37 drugs (26.43% of the total) reduced between 40% and 60%, and only 2 drugs had a price reduction below 20%. Eleven drugs had a price reduction exceeding 80%, while data on price reductions for 18 drugs could not be obtained.
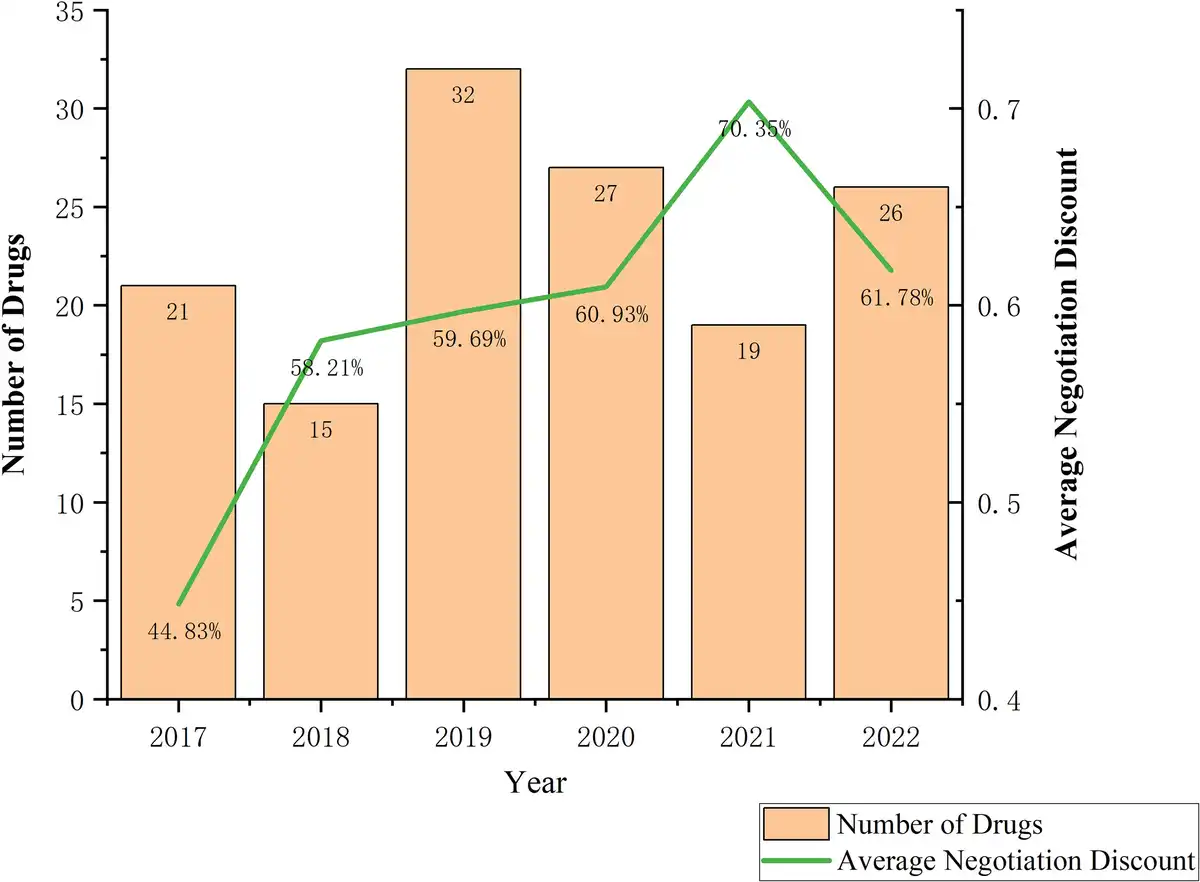
Figure 2
Number and average negotiation discount of selected drugs by year.
In terms of therapeutic areas, there are 28 oncology-related drugs and 31 drugs for rare diseases, with 23 drugs used for both. According to the Anatomical Therapeutic Chemical (ATC) Classification System, the 140 drugs cover 13 ATC categories, with the exception of Antiparasitic products, insecticides, and repellents. The largest group is Antineoplastic and immunomodulating agents, with 64 drugs, followed by anti-infectives for systemic use and alimentary tract and metabolism, with 13 and 11 drugs, respectively. Three drugs belong to more than one ATC group, with Dexamethasone covering the most categories, spanning six groups.
Comparison of average prices
Figure 3 illustrates the API over 6 years across 15 countries, revealing significant disparities in negotiated drug prices. The highest value ($41.56) was observed in the US, followed by Brazil ($26.63), Italy ($26.34), and Germany ($18.34). Contrastingly, South Korea ($7.57), Australia ($8.31), and China ($9.88) exhibited lower values.
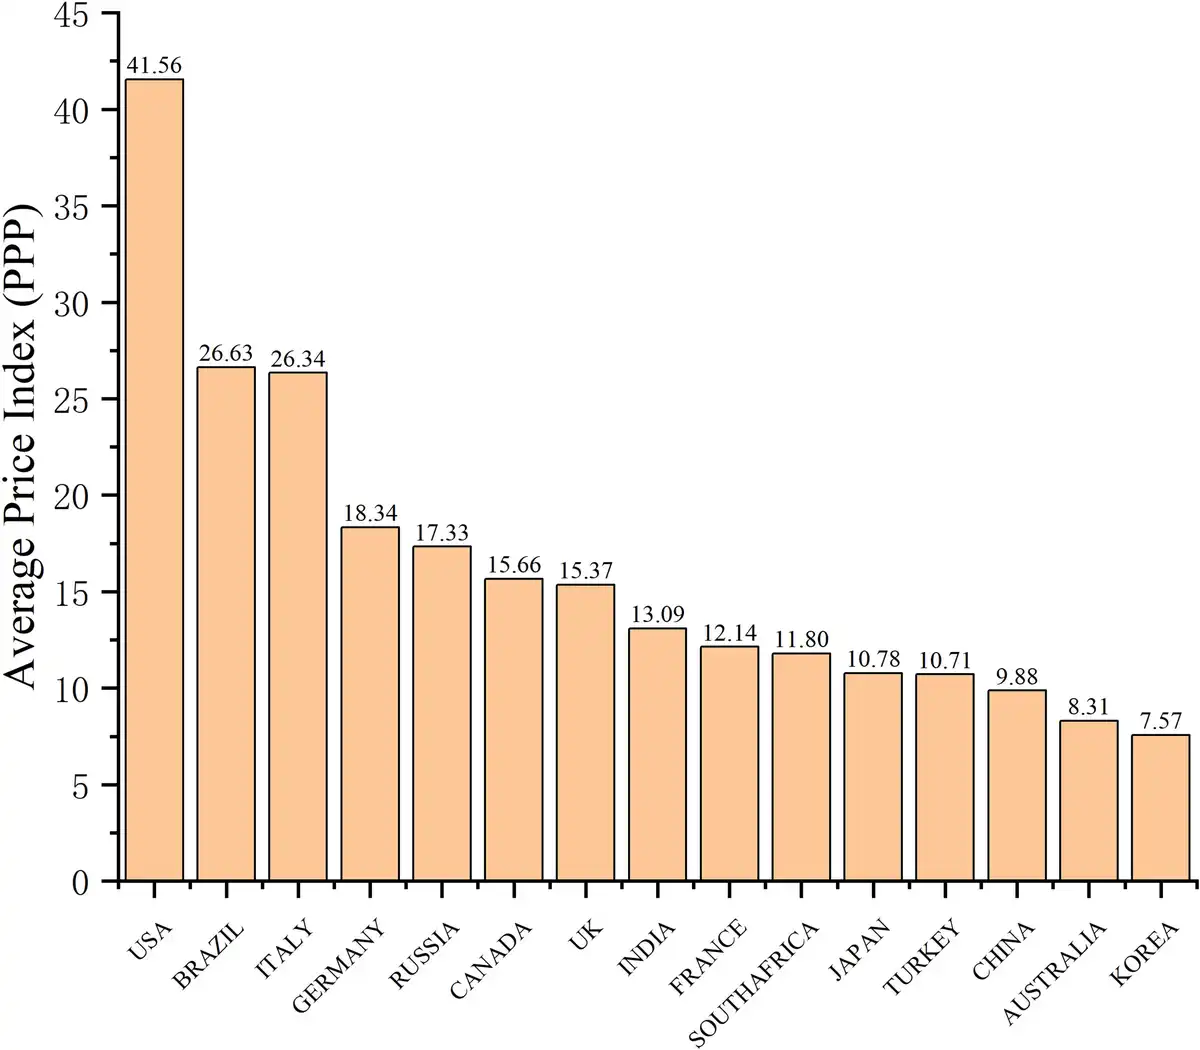
Figure 3
Average drug prices over 6 years across 15 countries.
Table 1 and Fig. 4 show the changes in API calculated using PPP in USD from 2017 to 2022 across 15 countries. Compared with Q1 2017, 10 countries experienced an upward trend, with increases of 33.44%, 30.32%, and 29.80% in Italy, Russia, and Brazil, respectively. Conversely, this value decreased in 5 countries, Australia, Germany, the UK, Korea, and China by 44.53%, 23.04%, 9.38%, 7.24%, and 6.54%, respectively.
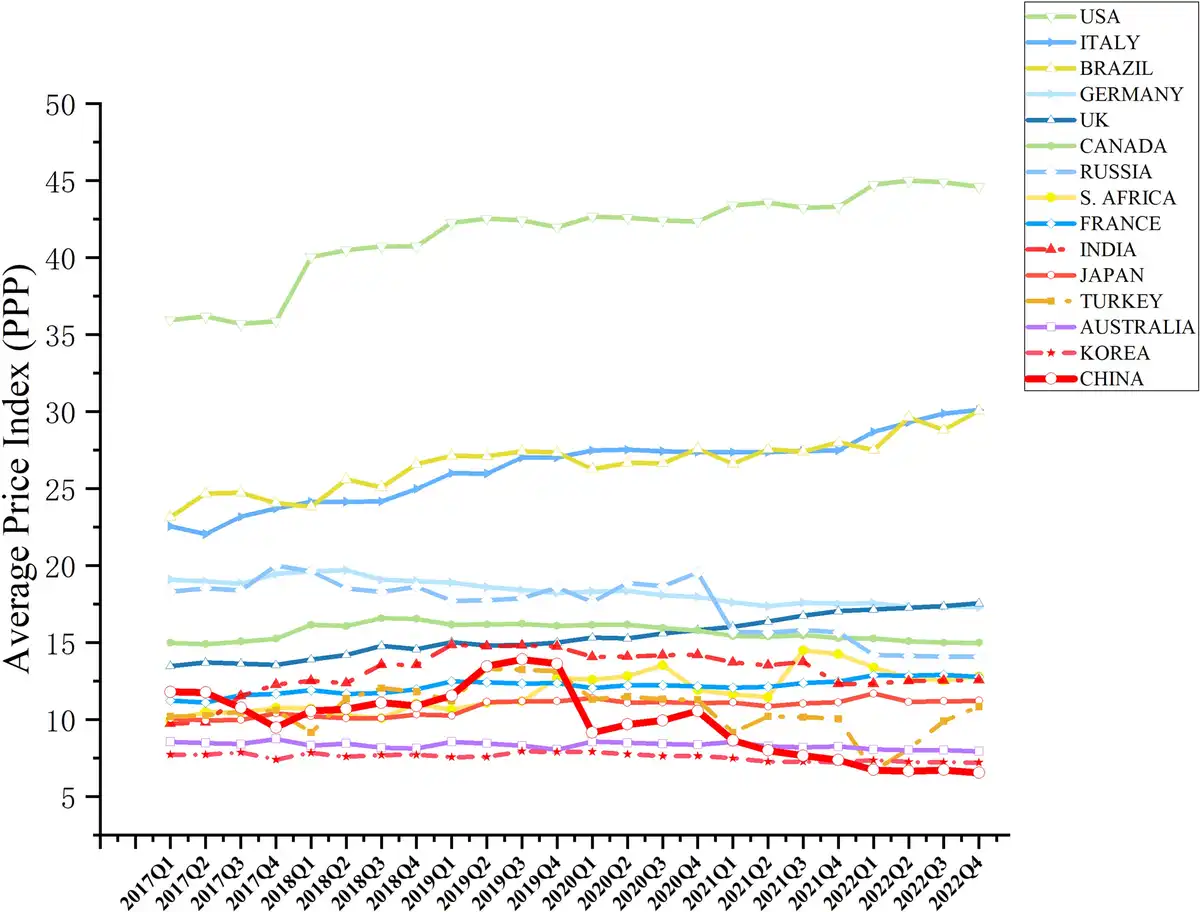
Figure 4
Changes in API calculated using PPP in USD from 2017 to 2022 in the 15 countries.
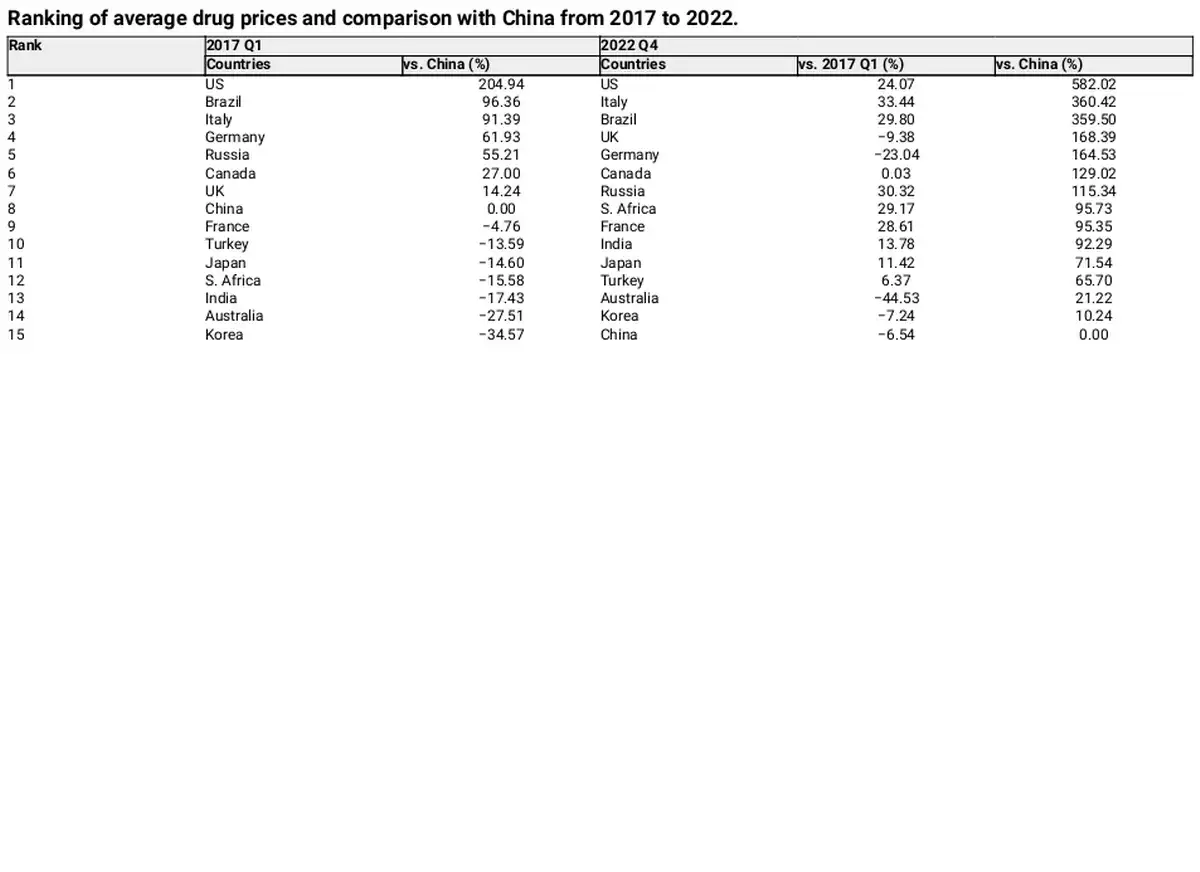
Drug prices in China have fluctuated significantly. Before 2020, China’s API was comparable to that of developed countries ranking eighth among the comparison countries. With the gradual implementation of several drug price reforms, China has maintained a steady downward trend in prices. Commencing 2022, China had the lowest drug prices among the selected 15 countries. In Q1 2017, the API in the top three countries (USA, Brazil, and Italy) were 204.94%, 96.36%, and 91.39%, higher than those in China, respectively. By Q4 2022, the values in the top three countries (the US, Italy, and Brazil) were 582.02%, 360.42%, and 359.50%, respectively, higher than those in China, indicating a significant widening of the gap.
Comparison of drug price indices
Table 2 compares the four DPIs based on PPP and exchange rates for 15 countries in Q4 2022. China ranked the lowest in all cases. Using PPPs to calculate the Laspeyres price index, India had the highest value (1.18), while the US had the highest Paasche and Chained Laspeyres indices, both at 1.15. Regarding the Fisher index, the US and the UK achieved the highest indices, each at 1.11. Contrastingly, when employing exchange rates, the US had the highest Paasche, Fisher, and Chain-Laspeyres indices (1.18, 1.13, and 1.18, respectively), whereas India had the highest Laspeyres index (1.20).
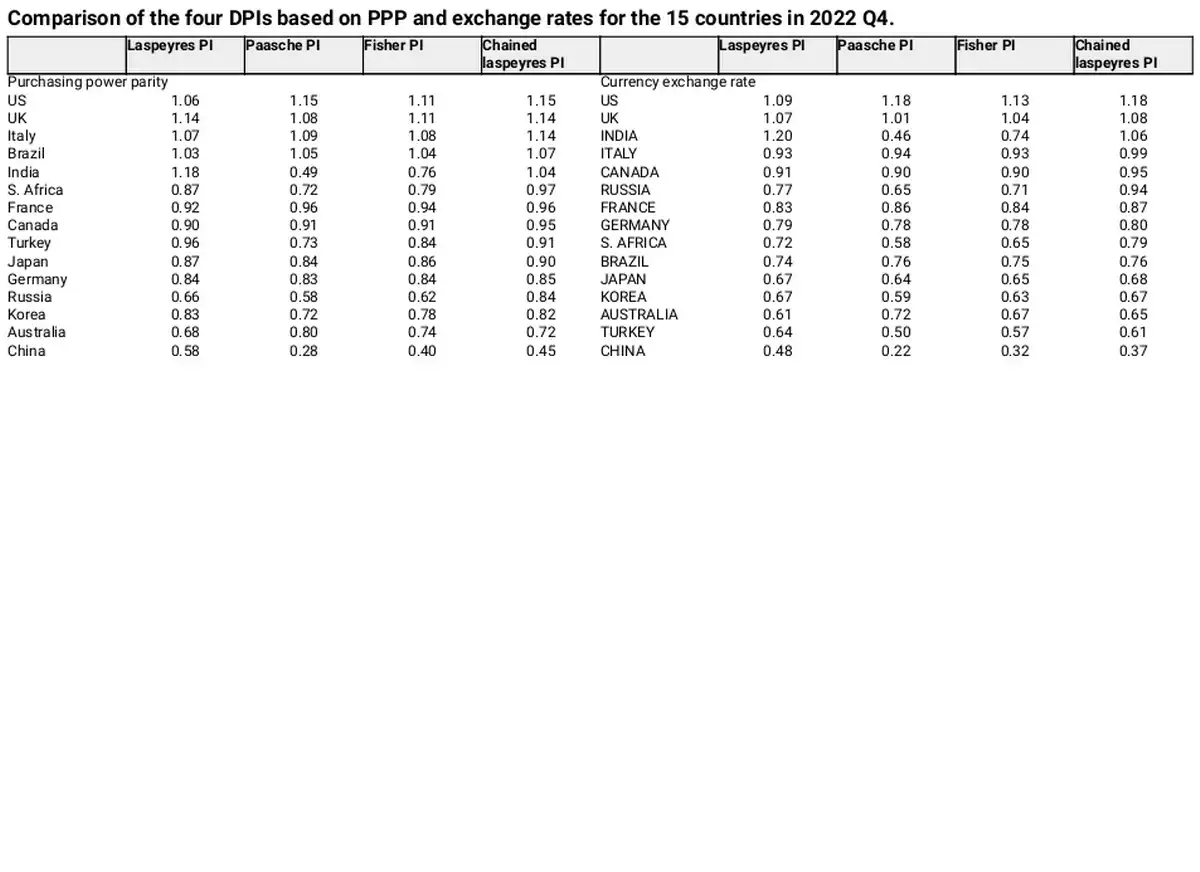
Figure 5 shows the changes in the four DPIs across 15 countries from 2017 to 2022. These trends were generally similar across countries. Significant differences existed between the Paasche and Laspeyres indices, with Australia, Brazil, Canada, and France often having higher Paasche indices than Laspeyres indices. Conversely, the Laspeyres indices were higher than the Paasche indices in China, India, Japan, Turkey, the UK, and Italy. In Germany, South Korea, Russia, and South Africa, Paasche indices were initially higher than Laspeyres indices but subsequently decreased. By contrast, in USA, the Paasche index was initially lower but subsequently exceeded the Laspeyres index. The Fisher index consistently fell between the Laspeyres and Paasche indices. The Chained Laspeyres index was generally higher than the other three indices in most countries, except in a few countries (Australia, China, India, and Turkey) where it fell between them.
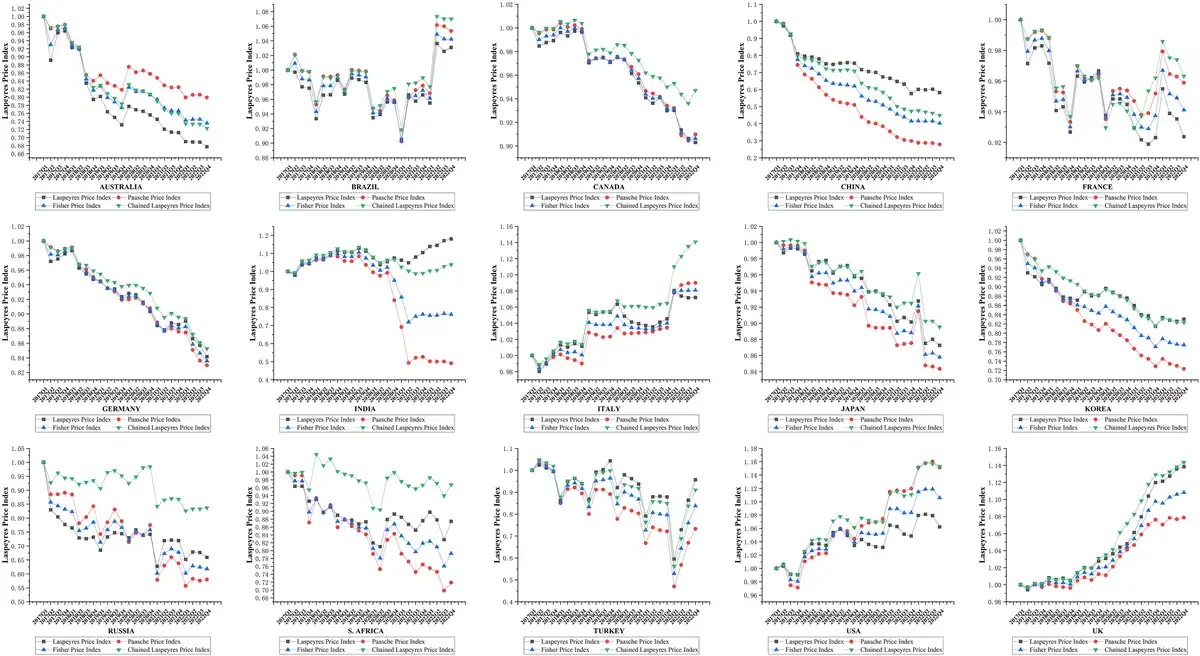
Figure 5
Changes in the four DPIs across the 15 countries from 2017 to 2022.
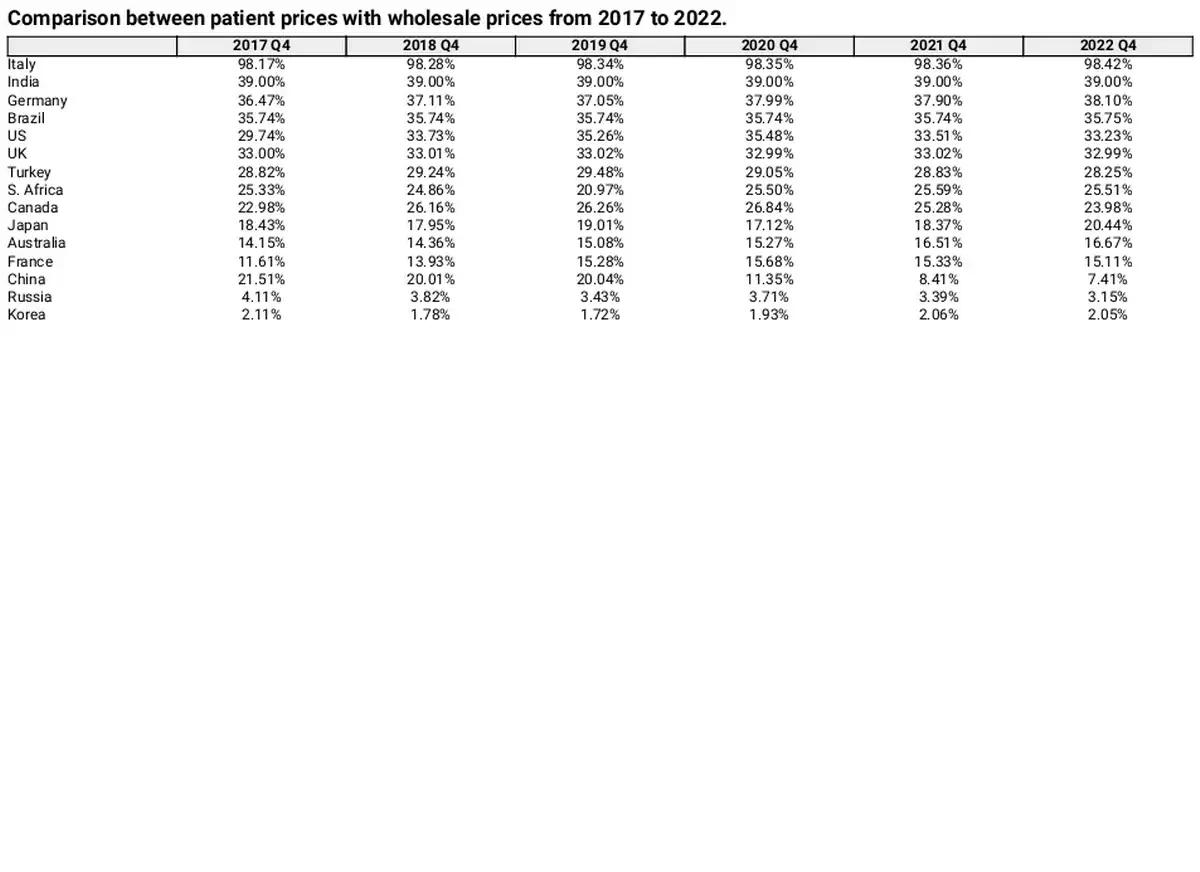
Comparison between patient prices and wholesale prices
Table 3 compares patient prices with wholesale prices for each fourth quarter from 2017 to 2022, showing the percentage by which patient prices exceed wholesale prices. Patient prices were higher than wholesale purchase prices in all 15 countries, with Italy demonstrating the largest difference at 98.42%. In most countries, the percentage of patient prices exceeding wholesale prices ranged from 20% to 40%. Contrastingly, patient prices in China, Russia, and Korea were only 7.41%, 3.15%, and 2.05% higher than wholesale prices, respectively. Compared with Q4 2017, the gap between patient and wholesale prices increased in nine countries, including the USA, France, and Australia, whereas the differences in India, the UK, and Korea remained almost unchanged. Figure 6 illustrates the gap between patient and wholesale prices in China, showing a narrowing trend, particularly after 2020, when the gap decreased from 21.51% to 7.41%.
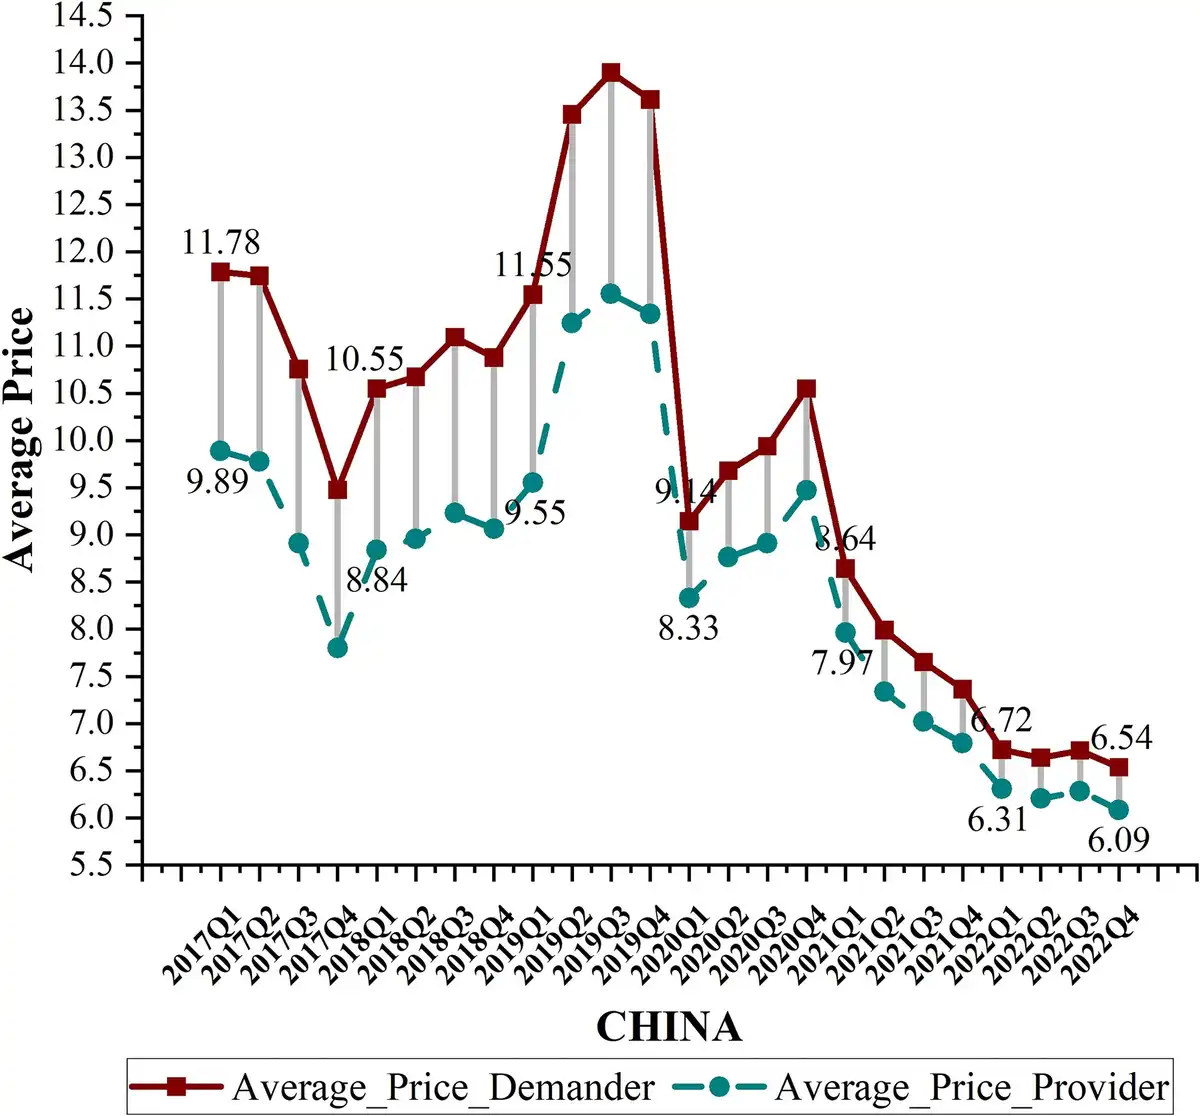
Figure 6
Gap between patient and wholesale prices in China.
Subgroup analysis: price comparison before and after China's drug price negotiations
Figure 7 presents the Interrupted Time Series (ITS) analysis of the API for 140 drugs in China, comparing price trends before and after the price negotiations. The results showed that following policy implementation, the API of five drug batches from 2017 to 2021 decreased by 0.57, 0.50, 2.20, 1.06, and 0.65, respectively. The reductions ranged from 2.5 to 131.36 times the pre-policy levels. For the 2018–2021 batches, the API showed an increasing trend before the policy but shifted to a decreasing trend post-implementation. This indicates that China's national drug negotiation policy played a significant role in reducing drug prices. Due to insufficient data following the policy implementation, drugs from 2022 were excluded from the ITS analysis.
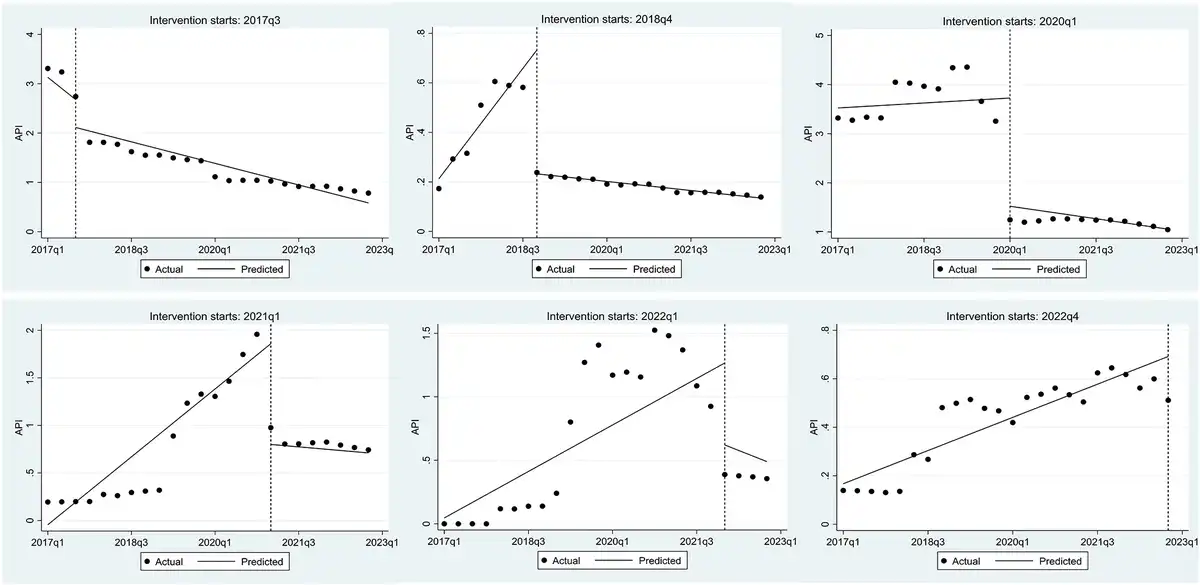
Figure 7
ITS analysis of API before and after negotiations in China.
Discussion
This study utilizes five DPIs to assess the pricing levels of 140 negotiated drugs across 15 countries. Although the role of external reference pricing in public policy formulation varies by country and remains inconclusive (, ), this study aims to provide a reference for international drug price management.
First, the findings confirmed significant variations in drug prices across countries. From 2017 to 2022, China’s drug prices underwent significant changes, making it the country with the lowest drug prices among all reference countries. US drug prices significantly exceeded those of other developed countries, with continuous price increases. Several factors contribute to this situation—(i) the country’s commercial insurance-dominated healthcare system; (ii) lack of a unified bargaining force among insurance companies, weakening negotiating power; and (iii) Medicare does not fully leverage its strategic purchasing capabilities (). Drug prices are also relatively high in several developing countries, such as Brazil and India. In India, low insurance coverage leaves a significant proportion of the population without access to essential medication or forces them to pay considerable out-of-pocket expenses (). In Brazil, approximately 87% of the country’s expenditure on medicines and medical devices is attributed to out-of-pocket payments (). Drugs sold by private pharmacies in Brazil often have excessively high prices, resulting in substantial profit margins (). Drug prices in South Korea and Australia have consistently remained at relatively low levels. Both countries have strict drug price regulation policies and some price negotiations.
Before 2020, China experienced irrational pricing, where drug prices were misaligned with the country’s economic development level as a developing nation. However, by implementing a series of strategic healthcare purchasing reforms, China has significantly progressed in monitoring and managing drug prices towards more rational and scientifically based levels. The subgroup analysis reveals that the national drug price negotiation policy has significantly reduced the prices of innovative drugs. Including high-value drugs in NRDL ensures stable sales volumes in the country, allowing pharmaceutical companies to adjust prices sustainably without compromising profit margins. This places high demands on the efficiency and capacity of national healthcare systems. China's experience highlights the crucial role of stakeholder communication and collaboration, health economic evaluations based on real-world evidence, and comprehensive monitoring mechanisms throughout policy implementation in drug price management.
Second, the trends of the four DPIs were similar, aligning with the results of previous studies. Currently, no definitive conclusion exists on the most appropriate DPI for drug price comparisons, as each method has its own strengths and limitations (, ). However, we identified substantial differences in the magnitudes of the Laspeyres and Paasche price indices. According to , in a market with a normal supply–demand relationship, when the price of a product increases, consumption typically decreases, reducing its weight in the calculation. The Laspeyres index employs fixed weights from the base period, often underestimating drugs with declining prices and overestimating those with rising prices. Consequently, the Laspeyres index yields a higher result than the Paasche index. Conversely, under abnormal supply–demand dynamics, the Paasche index may exceed the Laspeyres index. Based on these findings, this study suggests that pharmaceutical markets in countries such as China, Japan, the UK, and Germany are trending towards a balanced supply–demand relationship, while the US and Brazil may face potential imbalance. A comparison between the Laspeyres and Paasche price indices are a practical tool for monitoring and managing drug prices. When the Paasche index surpasses the Laspeyres index, closer scrutiny of newly listed drug pricing may be warranted.
The comparison between API and other price indices revealed a general consistency: the United States was at the higher end of all indices, while South Korea, Australia, and China had relatively lower drug prices. The performance of certain countries varied across different indices. For instance, under the DPIs calculation, the United Kingdom ranked relatively high, second only to the United States. In contrast, its ranking in the API index fell between fifth and seventh. This discrepancy arose from differences in the calculation methodologies of these indices. In API calculations, the fixed sales weight assigned to drugs may influence the results by placing greater emphasis on lower-priced drugs with higher sales volumes. The UK follows a free-pricing mechanism for pharmaceuticals, which leads to higher prices for innovative drugs (). Both DPIs and API reflected the UK's relatively high drug prices. However, API may overstate the impact of lower-priced drugs, resulting in a lower price ranking.
Similarly, the results of calculating DPI with exchange rates and PPP aligned closely with each other. However, using PPP, drug prices in Brazil ranked 4th and those in Turkey 9th, while under exchange rates, they dropped to 10th and 14th, respectively. Drug price transparency in Brazil remains a significant issue, with private pharmacies driving up drug prices, even exceeding those in certain developed countries (, ). In Turkey, innovative drugs, particularly orphan drugs, are often excluded from Social Security (). Furthermore, study indicated that between 2007 and 2021, the average price per box of medicine in Turkey increased two-fold, while the prices of imported drugs and biopharmaceuticals rose fivefold and threefold, respectively, making them less affordable for low-income patients (). Results based on PPP calculations may be more reasonable and better reflected the actual affordability, particularly in countries with limited purchasing power.
Finally, the results suggest that, in certain countries, the gap between patient and wholesale prices is widening. Previous studies have demonstrated that unadjusted patient prices can be, on average, $0.085 higher than the prices reported by suppliers (). Thus, actual patient prices may be even higher than those reflected in these countries. Our study finds that South Korea, Russia, and China exhibit relatively small disparities between consumer purchase prices and pharmacy purchase prices. These countries have all implemented centralized pricing mechanisms to manage drug costs and enhance price transparency, including price negotiations or centralized procurement. South Korea operates a health technology assessment (HTA)-based pricing system for new drugs, with a robust post-listing price-cutting system ensuring that prices are regularly adjusted after market entry (). Moreover, the separation of prescribing and dispensing responsibilities reduces financial incentives for providers to increase prices (). These comprehensive regulations minimize profit margins along the supply chain, which likely contributes to the small gap between procurement and patient prices. In China, significant efforts to enhance the regulatory systems and reimbursement policies have brought patient prices closer to wholesale procurement prices, effectively reducing inflated drug prices, alleviating the financial burden on patients, and maximizing their benefits. The slightly higher patient purchase prices in China compared to Korea and Russia may be attributed to the regional variation in policy implementation, where procurement prices may vary across provinces depending on local bidding outcomes and execution capacities (). The procurement prices achieved through national negotiation are not always reflected in the final prices paid by patients in China, especially in private retail settings. Policy recommendations for China include enhancing price transparency, mandating retail price caps for negotiated drugs, strengthening oversight of distribution margins, and establishing a comprehensive price evaluation and post-listing adjustment mechanism.
This study has some limitations. First, it focuses on high-value innovative drugs listed for negotiation in China. Differences in the recognition of these drugs across countries may result in either an overestimation or underestimation of their prices elsewhere. Second, the patient and procurement prices calculated in this study may not accurately reflect actual prices because of variations in reimbursement policies, as prices for the same drug can vary among patients. Third, drug prices are determined by a combination of multiple factors. This study focuses on reflecting the current state of drug pricing and does not conduct an in-depth analysis of specific causes or their impact. Future research should establish standards for innovative drugs across different countries and incorporate a broader range of these drugs for more comprehensive price comparisons. Additionally, researchers should further examine the impact of various reimbursement policies and procurement mechanisms on drug pricing to reflect actual prices.
Despite these limitations, this study offers a comparative analysis of negotiated drug prices in China and 14 reference countries. Given the scarcity of public data in China, studies in this field are relatively rare, making this study a valuable contribution to empirical evidence. The MIDAS database used in this study provides advantages in standardization, comparability across different times and locations, coverage, and data reliability. These features enhance the reliability of the findings and contribute to the review and development of drug price regulation policies worldwide.
Conclusion
Drug prices vary significantly internationally owing to differences in national drug pricing and reimbursement policies. Among the 15 selected countries, China managed to secure the relatively lowest drug prices starting in 2022. However, for a long time before that, its drug prices were higher than those in high-income countries. Owing to healthcare reforms since 2009, the narrowing gap between patient and wholesale procurement prices has gradually and effectively mitigated inflated drug costs and reduced patients’ financial burden. These outcomes highlight the success of China’s drug price management initiatives. The results of the five DPIs are generally consistent. Comparing the Laspeyres and Paasche price indices provides a beneficial statistical approach for monitoring drug prices and promoting pricing transparency. Utilizing PPPs may better reflect actual affordability and provide a more reasonable assessment.
Acknowledgements
The author has no acknowledgments to declare.
References
- Aksu B. Rare disease and orphan drug situations in Turkey and around the World. A J Health Sci. 2019;1:95–109. https://dergipark.org.tr/en/pub/ajhs/issue/47098/592398
- Andersson F. Methodological aspects of international drug price comparisons’. PharmacoEconomics 1993;4:247–56. 10.2165/00019053-199304040-00003
- Armknecht P. Fixed basket methods for compiling consumer price indexes. Am Int J Contempor Res 2015;5:97–106. 10.13140/RG.2.1.4869.0406
- Atikeler EK, Özçelikay G. Comparison of pharmaceutical pricing and reimbursement systems in Turkey and certain EU countries’. SpringerPlus 2016;5:1876. 10.1186/s40064-016-3455-z
- Australian Department of Health, Disability and Ageing. The Pharmaceutical Benefits Scheme: Procedure Guidance. 2022. https://www.pbs.gov.au/info/industry/listing/procedure-guidance/8-procedures-positive-recommendation-list/8-1-price-agreement (15 Jun 2025, date last accessed).
- Bangalee V, Suleman F. A comparative study on medicine pricing in Brazil, Russia, India, China and South Africa (BRICS). Glob J Health Sci 2018;10:152. 10.5539/gjhs.v10n10p152
- Bernal JL, Cummins S, Gasparrini A. Interrupted time series regression for the evaluation of public health interventions: a tutorial. Int J Epidemiol 2017;46:348–55. 10.1093/ije/dyw098
- Berndt ER, Aitken ML. Brand Loyalty, Generic Entry and Price Competition in Pharmaceuticals in the Quarter Century After the 1984 Waxman-Hatch Legislation. 2010. http://papers.ssrn.com/sol3/papers.cfm?abstract_id=1689363 (19 April 2024, date last accessed).
- Cai L, Tao T, Li H, et al Impact of the national drug price negotiation policy on the utilization, cost, and accessibility of anticancer medicines in China: a controlled interrupted time series study. J Glob Health 2022;12:11016. 10.7189/jogh.12.11016
- Dang A, Dang D, Vallish BN. Importance of evidence-based health insurance reimbursement and health technology assessment for achieving universal health coverage and improved access to health in India. Value Health Reg Issues 2021;24:24–30. 10.1016/j.vhri.2020.04.007
- Danzon PM, Kim JD. International price comparisons for pharmaceuticals: measurement and policy issues. PharmacoEconomics 1998;14:115–28. 10.2165/00019053-199814001-00014
- Department of Health and Social Care. Voluntary scheme for branded medicines pricing and access (VPAS)—media fact sheet. 2023. https://healthmedia.blog.gov.uk/2023/03/28/voluntary-scheme-for-branded-medicines-pricing-and-access-vpas-media-fact-sheet/ (25 July 2024, date last accessed).
- Diewert WE. Fisher ideal output, input, and productivity indexes revisited. J Product Anal 1992;3:211–48. 10.1007/BF00158354
- Diewert BMBWE, Fixler KJFD, Nakamura AO. Price and Productivity Measurement: Volume 6 - Index Number Theory. Canada: Trafford Press; 2010 https://economics.ubc.ca/wp-content/uploads/sites/38/2021/04/pdf_paper_diewert-erwin_PPMVolume6.pdf.
- Ding Y, Zheng C, Wei X, et al The impacts of the national medication price-negotiated policy on the financial burden of cancer patients in shandong province, China: an interrupted time series analysis. BMC Public Health 2022;22:2363. 10.1186/s12889-022-14525-7
- Divino V, DeKoven M, Kleinrock M, et al Orphan drug expenditures in the United States: a historical and prospective analysis, 2007-18. Health Affairs (Project Hope) 2016;35:1588–94. 10.1377/hlthaff.2016.0030
- Dmitrii L. ‘What makes use drugs so expensive? A comparative study of price-setting institutions in the USA, Germany, and China’. Universum: экономика и юриспруденция. 2024;7:12–7. https://7universum.com/ru/economy/archive/item/17784
- Earl-Slater A. The pharmaceutical price regulation scheme. Financial Accountability & Management 1997;13:35–54. 10.1111/1468-0408.00025
- Elshiekh C, Rudà R, Cliff ERS, et al Financial challenges of being on long-term, high-cost medications’. Neurooncol Pract 2025;12:i49–58. 10.1093/nop/npae098
- Erkut Y, Okcun S, Tibet B, et al HPR80 examination of the changes in the turkish pharmaceutical market between 2007 and 2021. Value Health 2023;26:S267. 10.1016/j.jval.2023.09.1398
- Fitzpatrick A. Which price is right? A comparison of three standard approaches to measuring prices’. J Dev Econ 2023;163:103106. 10.1016/j.jdeveco.2023.103106
- Fontrier A-M, Gill J, Kanavos P. International impact of external reference pricing: should national policy-makers care? Eur J Health Econ 2019;20:1147–64. 10.1007/s10198-019-01083-w
- Gerdtham U-G, Jönsson B. Conversion factor instability in international comparisons of health care expenditure. J Health Econ 1991;10:227–34. 10.1016/0167-6296(91)90005-8
- Gill J, Fontrier A-M, Kyriopoulos D, et al Variations in external reference pricing implementation: does it matter for public policy? Eur J Health Econ 2019;20:1375–97. 10.1007/s10198-019-01100-y
- Gu Y, Zhuang Q. Does China’s centralized volume-based drug procurement policy facilitate the transition from imitation to innovation for listed pharmaceutical companies? Empirical tests based on double difference model. Front Pharmacol 2023;14:1192423. 10.3389/fphar.2023.1192423
- Hasan SS, Kow CS, Dawoud D, et al Pharmaceutical policy reforms to regulate drug prices in the Asia Pacific region: the case of Australia, China, India, Malaysia, New Zealand, and South Korea. Value Health Reg Issues 2019;18:18–23. 10.1016/j.vhri.2018.08.007
- Healthcare Security Administration of Hubei Province. What are nationally negotiated drugs? 2022. https://ybj.hubei.gov.cn/bmdt/ztzl/2021/ybzckpzl/hbs/yyfwgl_hbs/202209/t20220929_4327293.shtml (15 Jun 2025, date last accessed).
- International Monetary Fund. Consumer Price Index Manual: Theory and Practice. Washington, DC: International Monetary Fund, 2004.
- Ivama-Brummell AM, Pingret-Kipman D, Louly PG, et al Medicines regulation, pricing and reimbursement in Brazil. Rev Bras Farm Hosp Serv Saúde 2022;13:769. 10.30968/rbfhss.2022.131.0769
- Kim S, Lee JH. Price-cutting trends in new drugs after listing in South Korea: the effect of the reimbursement review pathway on price reduction. Health Care 2020;8:233. 10.3390/healthcare8030233
- Kockaya G, Atikeler K, Esen A, et al Comparison retail prices of drug prices between Turkey and European countries. Value Health 2013;16:A457. 10.1016/j.jval.2013.08.774
- Kwon S. Pharmaceutical reform and physician strikes in Korea: separation of drug prescribing and dispensing. Soc Sci Med 2003;57:529–38. 10.1016/S0277-9536(02)00378-7
- Kwon H-Y, Godman B. Drug pricing in South Korea. Appl Health Econ Health Policy 2017;15:447–53. 10.1007/s40258-017-0307-0
- Liu Y, Guan X, Shi L. International comparison of drug price level in China. China Pharm. 2012;23:4537–9. https://kns.cnki.net/kcms2/article/abstract?v=__pNPjlwk1q7lvrczrPiPbpHhp7nJz_By30IQIXFc2EO9OvJUgBM1kx3cHO9-d_4A7DL9HrcYTGSRECWtX4frzkRnYfJ6XqQT5Ck9EPF7w1zNLhqiybPT29v9WKsmmQFn_b9cBaXO5w0toiiFwqKc02Aarec6p1VCmkolSl0PrS19c06xhAqAA==&uniplatform=NZKPT&language=CHS
- Liu X, Ni Q, Shi L. Comparison of the retail drug prices between China and other developed countries or districts’. China Pharm. 2009;20:490–2. https://kns.cnki.net/kcms2/article/abstract?v=__pNPjlwk1pp4XgYXT-evZ8tQKUndxDOkv_Uh01JyWcQGGd9_gnSoa4l7HsQzdkoxbXfeMYQM5mBTnx_YRywMe7VCpwECZiuSYha55HjUXfm8bLDCZXPJSSfBQ4sv6GDdALZvSRlMcM7-j_DqKmy8oBKM6i9HyfxUQX0j3fycrCWAIYPqPyI5Q==&uniplatform=NZKPT&language=CHS
- Lu N, XU W, LI S. Comparative study on the price level of rare disease drugs in China, Japan and South Korea. Chin Health Econ 2020;39:84–8. 10.7664/CHE20201220
- Lyles A. Pharmacy benefit management companies: do they create value in the US healthcare system? PharmacoEconomics 2017;35:493–500. 10.1007/s40273-017-0489-1
- Mingge X, Jingyu W, Qi L, et al Promoting access to innovative anticancer medicines: a review of drug price and national reimbursement negotiation in China. Inquiry 2023;60:469580231170729. 10.1177/00469580231170729
- Mulcahy AW, Schwam D, Lovejoy SL. International Prescription Drug Price Comparisons: Current Empirical Estimates and Comparisons with Previous Studies. Santa Monica, Calif: RAND Corporation, 2021. https://www.rand.org/pubs/research_reports/RR2956.html.
- National Healthcare Security Administration, Ministry of Human Resources and Social Security of the People's Republic of China. The National Medical Insurance Catalogue was released in 2022. 2023. https://www.gov.cn/fuwu/2023-01/18/content_5737837.htm (15 Jun 2025, date last accessed).
- Nóbrega OdT, Marques AR, Araújo ACGd, et al Retail prices of essential drugs in Brazil: an international comparison. Rev Panam Salud Pública = Pan Am J Public Health 2007;22:118–23. 10.1590/S1020-49892007000700006
- Oj W, Pg K. A comparison of generic drug prices in seven European countries: a methodological analysis. BMC Health Serv Res 2017;17:242. 10.1186/s12913-017-2184-5
- Patterson JA, Wagner TD, O'Brien JM, et al Medicare part D coverage of drugs selected for the drug price negotiation program. JAMA Health Forum 2024;5:e235237. 10.1001/jamahealthforum.2023.5237
- People's Daily. The 2024 edition of the National Health Insurance Drug List is out. 2024. https://www.gov.cn/zhengce/202411/content_6989980.htm (15 Jun 2025, date last accessed).
- Rémuzat C, Urbinati D, Mzoughi O, et al Overview of external reference pricing systems in Europe. J Mark Access Health Policy 2015;3:10.3402/jmahp.v3.27675. 10.3402/jmahp.v3.27675
- Ribeiro AA, Pontes MA, Bermudez JAZ, et al Transparency of medicines market, from the global perspective to the challenges faced in Brazil. J Health Manag 2023;25:240–53. 10.1177/09720634231177343
- Rodwin MA. Common pharmaceutical price and cost controls in the United Kingdom, France, and Germany: lessons for the United States’. Int J Health Serv 2021;51:379–91. 10.1177/0020731421996168
- Salmasi S, Lee KS, Ming LC, et al Pricing appraisal of anti-cancer drugs in the south east Asian, western Pacific and east Mediterranean region. BMC Cancer 2017;17:903. 10.1186/s12885-017-3888-y
- Sarnak DO, Squires D, Kuzmak G, et al Paying for prescription drugs around the world: why is the U.S. An outlier. Issue brief (Commonwealth Fund). 2017;2017:1–14. https://pubmed.ncbi.nlm.nih.gov/28990747/
- Schulman KA, Dabora M. The relationship between pharmacy benefit managers (PBMs) and the cost of therapies in the US pharmaceutical market: a policy primer for clinicians’. Am Heart J 2018;206:113–22. 10.1016/j.ahj.2018.08.006
- Suda KJ, Kim KC, Hernandez I, et al The global impact of COVID-19 on drug purchases: a cross-sectional time series analysis’. J Am Pharm Assoc (2003) 2022;62:766–774.e6. 10.1016/j.japh.2021.12.014
- World Bank. Global Purchasing Power Parities and Real Expenditures: 2005 International Comparison Program. Washington, DC. 2008. http://hdl.handle.net/10986/21558 (15 Jun 2025, date last accessed).
- Yuan Y. 2019 ACTS annual report: statistical quality assurance applied to IQVIA's information offerings. 2020. https://www.iqvia.com/-/media/iqvia/pdfs/library/publications/2019-acts-annual-report.pdf (15 Jun 2025, date last accessed).
- Zhang X, Lyu L. The international experience and enlightenment of pharmaceutical price governance—from the perspective of drug life cycle. China Health Insurance 2024;2024:95–103. 10.19546/j.issn.1674-3830.2024.12.014