Introduction
The quantity of artificial intelligence (AI) applications for clinical use is rapidly increasing. Presently, the US Food and drug administration (FDA) lists 692 AI-enabled medical devices marketed in the US, while many more are described in the scientific literature, including more than 100 models for prediction of sepsis, more than 10 models for identifying hip fractures in x-ray images, and an abundance of other applications.
In many cases, AI has demonstrated superiority over its human counterparts. Noteworthy examples include chatGPT outperforming more than 99% of medical journal readers in diagnosing complex clinical cases and AI systems surpassing human readers in breast cancer screening with the potential to substantially reduce the workload for this task. Thus, AI solutions hold transformative potential for the health care system, potentially yielding better patient outcomes and enhanced health care efficiency.
AI models typically undergo validation before clinical implementation to ensure adequate performance. However, AI model performance may change during the course of deployment as a result of changes to the environment in which the model operates. Acceptable performance at validation, therefore, does not guarantee sustained adequacy and it may become necessary to retrain, recalibrate, or decommission the model to ensure safe operation. Timely intervention must be based on timely detection of declining performance. This can be achieved through continuous monitoring of the performance of AI models during deployment.
However, selecting an appropriate method for monitoring clinical AI is a non-trivial task. In particular, direct monitoring of clinical performance can be a challenge when access to ground truth data is limited due to ethical concerns, resource scarcity, or delays between the AI model application and the time of the event it predicts. Further, models with the potential to affect the outcomes they predict can complicate performance evaluation even when ground truth data are readily available, causing apparent performance loss even when operating at a stable performance level.
Other AI monitoring methods avoid some of these complications with obtaining ground truth data by monitoring features that are not dependent on knowing the ground truth. Examples include monitoring the distribution of the models’ input variables, monitoring the distribution of the models output, and monitoring feature importance within the model. Changes detected through these indirect monitoring methods signify that changes to the model’s environment have occurred, and that there is a risk that changes in model performance have also occurred. These methods, however, entail their own challenges, since the relation to actual model performance is highly unpredictable. It can, therefore, be hard to determine whether a change to the model environment is critical and whether it necessitates intervention or not.
Additionally, AI models predictions are no better than the ground truth data on which the models are trained. In some cases this ground truth is far from an actual gold standard, and it may sometimes be preferable to monitor downstream consequences of model operation (patient outcome) rather than the model’s ability to correctly predict a sometimes dubious ground truth.
As outlined previously, both the options and the obstacles for implementing monitoring of clinical AI are many. Choice of strategy will include ethical, economical, statistical, and practical considerations, and many questions inevitably emerge. How many patients will we need to misclassify before we can statistically detect a performance drop? How certain do we need to be of the performance while the model is operating? How many resources can we reasonably spend on monitoring our models? While the importance of ongoing real-world performance monitoring of medical AI is emphasized by both the FDA, the European Parliament Research Service, and multiple other public agencies, these official sources offer little to no guidance regarding which specific monitoring methods should be applied, leaving health care institutions to answer these questions themselves. Scientific sources addressing performance monitoring of clinical AI are also sparse and heterogeneous. Thus, to address this gap and to guide both implementation and further research on monitoring of clinical AI, there is a need for an overview of the currently known methods. Due to the heterogeneity of the known sources of evidence, a scoping review approach was deemed most appropriate for this task. Preliminary searches revealed no completed or ongoing reviews on this topic in MEDLINE, the Cochrane Database of Systematic Reviews, or JBI Evidence Synthesis.
The objectives of this scoping review were to identify which methods for monitoring the performance of clinical AI have been described, tested, or implemented, and to summarize the arguments given for or against these methods.
Review questions
Which methods for monitoring performance of AI models have been described, tested, or implemented specifically for clinical use?
Which rationales for choosing specific monitoring strategies for clinical AI have been described?
Inclusion criteria
Participants
Methods and models described for use on any category of human patients were eligible for inclusion in the review.
Concept
Performance monitoring methods were defined broadly as any systematic, continuous, or repeated effort to evaluate clinical performance (eg, discrimination, calibration, accuracy, fairness) of models or detect risk of deterioration of performance or evaluate downstream consequences or other proxy indicators of model performance. Patient-specific quality assurance, with no intent to evaluate the model performance (eg, output shown to physician who then chooses to use it or not) was not considered monitoring of AI performance.
Rationales were defined as the arguments given for or against choosing a particular monitoring method or outlines of which consideration should guide choice of monitoring methods. This did not include arguments for why it might be important (or unimportant) to monitor AI in health care in general. Any type of argument from any perspective was included (eg, ethical, practical, cultural, organizational).
Context
AI models for clinical use were defined as algorithms with the possibility of directly influencing patient management (eg, algorithms for diagnosis, treatment, prognosis, or triage), but not algorithms that primarily affect the overall health care efficiency (eg, algorithms for efficient staffing, waiting time prediction). Methods described for use in health care in more general terms such as for “clinical use” were also eligible for inclusion.
Methods and models described for use in any part of the health care system were eligible for inclusion. Direct-to-consumer services (DTC), where the consumer uses AI without a health care professional as an intermediary, were not eligible. Examples of DTC include health apps for smartphones or smart watches and self-tests online.
Types of sources
This scoping review considered all study design types, including randomized and non-randomized controlled trials, interrupted time series studies, prospective and retrospective cohort studies, case-control studies, case reports, qualitative studies, systematic reviews, opinion and perspective papers, and guidelines. Studies using fully or partially simulated data were also considered for inclusion.
Methods
The project was registered on Open Science Framework (https://osf.io/afkrn) and was conducted according to the published protocol, following the JBI methodology for scoping reviews.
Deviations from the a priori protocol
In the course of the review, it became evident that additional specifications of the concepts “method” and “artificial intelligence” were necessary to ensure consistent source inclusion and data extraction. A performance monitoring method, in essence, consists of many smaller parts; for example, the frequency of evaluation (eg, monthly), the data sources, the metrics used (eg, sensitivity), the statistical processing (eg, χ2 test), the definition of acceptable performance level and so on. Although not explicitly defined in the protocol, the intention of the review was to summarize monitoring methods in terms of metrics and statistical processing, and as a result, sources not specifying metrics or statistical processing were excluded from the review.
The term AI is not universally well-defined. For this review, AI was defined as machine learning–derived models, and therefore did not include models based on direct implementation of expert knowledge.
During the forward citation search, it became apparent that some of the included sources were highly cited in areas unrelated to health care; for instance, 1 included paper had in excess of 2000 citations, including sources in biology, economics, and electrical engineering. To manage the workload, all forward citation search results were filtered through the same health care filter as was used in the initial searches.
Some identified sources were not formatted as titles and abstracts, such as videos, web tools, and web pages, and were, as a result, unable to be uploaded into Covidence (Veritas Health Innovation, Melbourne, Australia). This included sources identified through the webpage searches of the gray literature search and parts of the citation search results. These sources were screened by 1 reviewer only (ESA) and, if deemed relevant for inclusion, discussed with an additional reviewer before final inclusion and extraction.
Search strategy
The search strategy aimed to capture both published and unpublished sources. An initial limited search of MEDLINE and Embase was undertaken to identify articles on the topic. The text words contained in the titles and abstracts of relevant articles, and the index terms used to describe the articles were used to develop a full search strategy for Embase (Ovid), MEDLINE (Ovid), Scopus, and ProQuest Dissertations and Theses Global (Appendix I). As the Scopus and ProQuest databases are not health care–specific databases, a search block limiting the searches to the health care domain was added in each of these 2 searches. The searches were initially conducted on September 5, 2023, and updated on November 12, 2023.
Gray literature searches for unpublished studies included abstracts, conference proceedings, and preprints from preprint servers (medRXiv, bioRXiv, arXiv, ChemRxiv, SSRN) indexed in Embase and Scopus. These sources were included through the respective Embase and Scopus searches. Additionally, ISO standards including standards under development, webpages of the European Union and European parliament as well as the FDA and the National institute of Health and Care Excellence (NICE) were explored. Queries used for theses searches are specified in Appendix II.
On November 21–22, 2023, the reference lists (backward citation search) and citations (forward citation search) of included sources of evidence were identified primarily through Scopus and, when necessary, Web of Science. Unfortunately, 1 source could not be located in either database and, therefore, could not undergo forward citation search.
No restrictions were imposed on publication date or geographic location and sources in any language were considered for inclusion. Included sources in languages other than English or the Nordic languages were translated. Studies published in Chinese were translated by a Chinese-speaking co-author (DMCA), while studies in other languages (Russian and German) were translated using chatGPT (OpenAI, San Francisco, USA) and subsequently verified by individuals proficient in the respective languages.
Study selection
Following the search, all identified citations were collected and uploaded into EndNote v.X9 (Clarivate Analytics, PA, USA) and duplicates were removed. Titles and abstracts were then imported to Covidence and screened by 2 independent reviewers for assessment against the inclusion criteria for the review. ESA screened all sources and LHF, JBBK and RSH each screened a randomly assigned portion of the sources. Sources not provided as title and abstract (eg, videos, web applications) were screened by 1 reviewer (ESA). Potentially relevant sources were retrieved in full and imported into Covidence. The full text of selected citations was assessed against the inclusion criteria by 2 independent reviewers. ESA assessed all sources and LHF and JBBK assessed a randomly assigned portion of the sources. Reasons for exclusion of sources of evidence at full text that did not meet the inclusion criteria were recorded. Any disagreements between the reviewers at each stage of the selection process were resolved through discussion or with an additional reviewer.
Data extraction
Data extraction was carried out by ESA and JBBK independently, using a data extraction tool developed by the reviewers for this purpose. The data extraction was performed in Covidence and included specific details about the type of sources, including study design, country of origin, and funding sources as well as key findings relevant to the review questions.
A draft extraction form was pilot tested on known relevant literature and by all members of the data extraction team and modified as necessary both before and during data extraction. The modifications consisted of dropping questions relating to dilemmas encountered in monitoring clinical AI, as this review question was ultimately dropped entirely from the review. The final extraction form can be found in Appendix III. Any disagreements between the reviewers during extraction were resolved through discussion. For sources that described clinical tests or implementation of monitoring clinical AI but lacked details or had insufficient information regarding metrics and statistical methods, the research team attempted to contact the authors via email twice to request additional details. In cases where no response was received, and the original source lacked the required details, the studies were excluded.
Data analysis and presentation
The results of the search and the study inclusion process are presented through a Preferred Reporting Items for Systematic Reviews and Meta-analyses (PRISMA) flow diagram. Characteristics of sources of evidence are presented in tabular format with selected characteristics summarized across sources through summary statistics.
In the data extraction phase, the monitoring methods identified in the review were categorized by type of method. These methods were divided into methods intended to measure performance (eg, diagnostic accuracy measures, measures of clinical outcome) and methods intended to detect the risk of changing performance without measuring the performance itself (eg, measures of changes to input variable, changes to importance of each input variable). Each broad category underwent further subdivision into more specific categories as specified in the protocol. During extraction, additional categories were added as needed when a method did not fit any of the predefined categories. The addition of categories was performed individually by each member of the extraction team (ESA, JBBK) during extraction, and the final definition of the category discussed between ESA and JBBK afterwards. The categories of methods described by each included source are summarized in tabular format, while details regarding each specific method as well as summary statistics (number of sources reporting each method or method type) are narratively described. Additionally, the arguments provided for the selection of monitoring methods are narratively outlined in conjunction with the description of each individual method.
Results
Study inclusion
The searches identified 20,664 sources of which 7335 were duplicates, leaving 13,329 potential sources, with 39 sources ultimately meeting the inclusion criteria. The source selection process is outlined in Figure 1. Of the included sources, 23% (9 sources) were identified through the citation search. During the full-text screening stage, the predominant reasons for exclusion were that the source included no monitoring of AI or that the source merely mentioned monitoring of clinical AI without providing technical details (metric or statistical method). The authors of 4 papers were contacted for additional details. One author replied, while the remaining requests yielded no replies, resulting in the exclusion of 2 sources due to no details regarding metrics or statistical processing being available. The author of the fourth paper did not respond to our request for more information, and this study is included but limited to the information in the existing study. A list of sorces excluded at full text stage inckudin reasons are given in supplemental digital content 1, http://links.lww.com/SRX/A67.
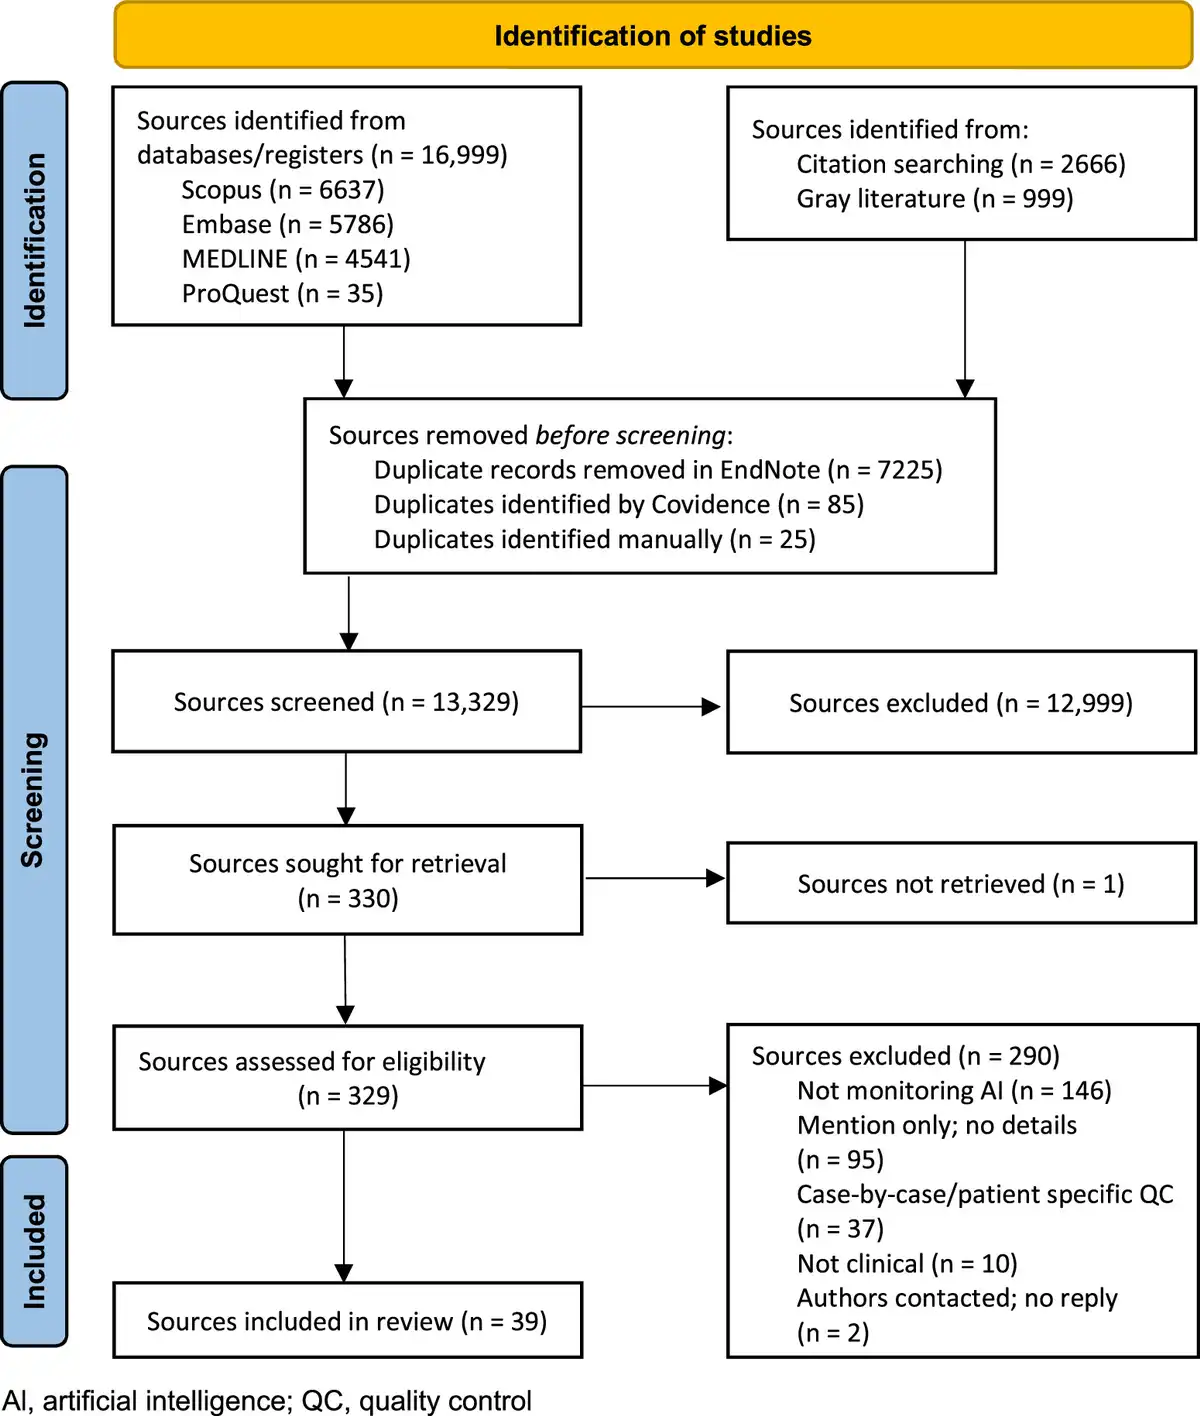
Figure 1
Search results and study selection and screening process
Characteristics of included studies
Characteristics of the included sources are listed in Appendix IV and summary statistics are given in Figure 2. Overall, no relevant sources from before 2019 were identified, and the number of included sources generally increased year by year. The majority of sources were either narrative reviews, opinion papers, or simulation studies. Most of the included studies had monitoring of clinical AI as their research target. The dominant country of origin was the USA and of the sources reporting funding, most reported public funding.
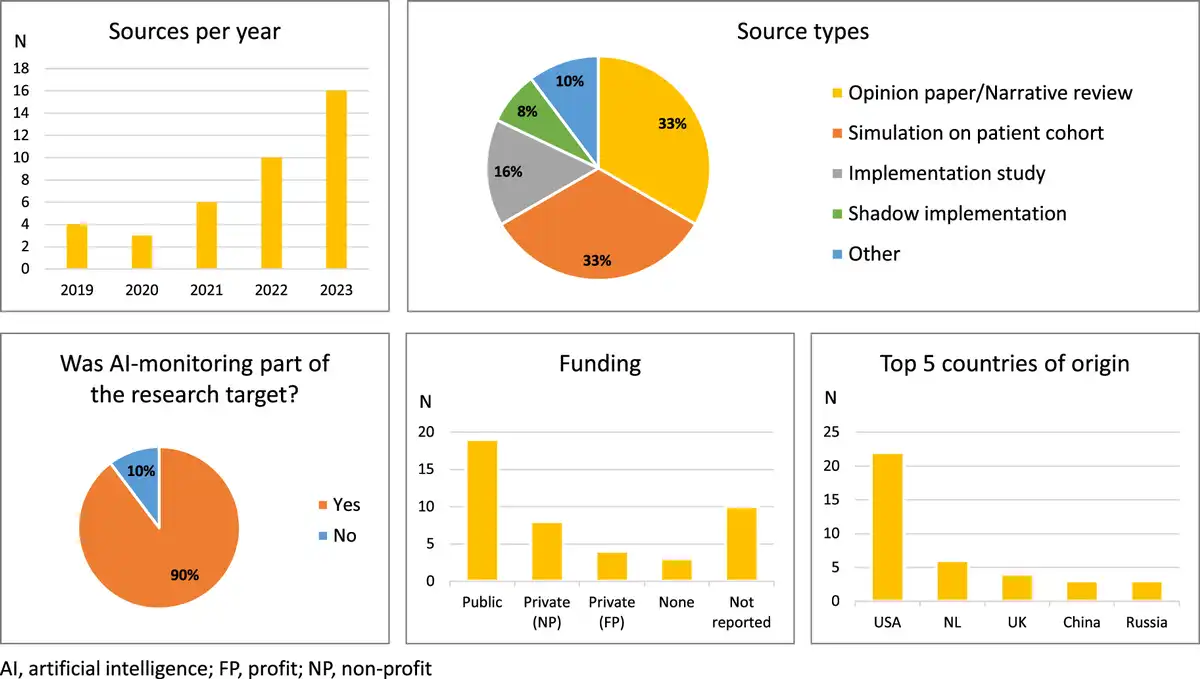
Figure 2
Summary statistics of characteristics of 39 sources of evidence included in the scoping review
Review findings
Of the 39 included sources, 21 sources described direct performance monitoring methods only, while 5 sources solely described methods for detecting risk of changing performance; 11 sources described both method types. Of the 39 sources describing methods for monitoring clinical AI, 9 sources indicated that the method(s) had been clinically tested or implemented. In the sources, few arguments were given for specific choice of monitoring method.
Direct performance monitoring methods
Types of direct performance monitoring methods described in the included sources are summarized in Table 1 and each method is described in further detail including argumentations regarding its use in the sections below. Arguments are emphasized using the following symbol (*) in the text. For a brief explanation of metrics and statistical methods mentioned, see Appendix V.
Table 1
Types of performance properties measured in the 39 included sources
| First author, year | Accuracy | Discrimination | Calibration | Proxy outcomes | Fairness |
|---|---|---|---|---|---|
| Aguilar, 2023 | |||||
| Allen, 2021 | • | ||||
| American College of Radiology, Allen 2019, 2022 | • | • | |||
| Andreychenko, 2022 | • | ||||
| Bartels, 2022 | |||||
| Bedoya, 2022 | • | • | • | ||
| Bhaskhar, 2023 | |||||
| Chetverikov, 2023 | x | ||||
| Claessens, 2022 | x | x | |||
| Corbin, 2023 | x | x | x | x | |
| Davis, 2020 | x | ||||
| Davis, 2022 | x | x | |||
| DeKerf, 2023 | • | • | |||
| DiMartino, 2023 | x | ||||
| Duckworth, 2021 | x | x | |||
| Elguindi, 2022 | • | ||||
| Feng, 2022 | x | x | x | ||
| George, 2023 | x | ||||
| Juluru, 2021 | • | ||||
| Levy, 2022 | x | x | |||
| Lundberg, 2020 | x | ||||
| Magrabi, 2019 | x | ||||
| Mahadevaiah, 2020 | x | ||||
| Merkow, 2023 | |||||
| Nakatsugawa, 2019 | x | ||||
| Pruski, 2023 | x | ||||
| Rahmani, 2023 | x | x | x | ||
| Rotalinti, 2023 | x | ||||
| Sahiner, 2023 | x | ||||
| Schelb, 2021 | x | ||||
| Schinkel, 2023 | x | x | |||
| Smeden, 2023 | x | x | |||
| Stacke, 2021 | |||||
| Wang, 2019 | x | x | |||
| Wong, 2023 | • | ||||
| Yang, 2021 | • | ||||
| Zinchenko, 2022 | x | x |
Accuracy
Accuracy measures were the most abundantly described metrics for monitoring the performance of clinical AI, having been described in 27 sources. Most dominant were diagnostic sensitivity and specificity and positive and negative predictive values (PPV and NPV), with PPV often referred to as “precision” in AI literature. Wong et al. argued that predictive values are useful for assessing the balance between clinical relevance and over-alerting (*). In 1 case, PPV normalized to prevalence (referred to as lift) was described, with the argument that PPV is highly dependent on prevalence, and thus needs to be normalized to this in cases where the prevalence of the target condition may be changing (*). Other frequently described metrics included error rates or its opposite (agreement rates, diagnostic accuracy), the Brier score, including its unidimensional version Mean Squared Error and confusion matrices. One source proposed the use of the drift detection method or the early drift detection method, which monitor changes in error rates and time between errors, respectively. One source reported monitoring Kappa scores and another described monitoring the number needed to treat, while 2 studies quantified the error sizes associated with each output in terms of difference in number of lymph nodes and Gamma passing rates, respectively. In medical image segmentation, Dice index (equivalent to F1-score) and surface Dice index were described. De Kerf et al. presented the metric local Dice index, which preferentially measures agreement in the most important regions. De Kerf et al. argue that it, therefore, better captures clinically relevant differences compared with the ordinary Dice index, which gives equal weight to disagreement in clinically less relevant areas (*).
Discrimination
Eleven sources described measures of discrimination. In all cases, area under the receiver operating characteristics curve (AUROC) was mentioned, while 3 sources also mentioned area under the precision-recall curve (AUPRC).
Calibration
Six sources described monitoring of calibration measures. Two sources described using the observed-to-expected ratio (average calibration), while 5 sources described using measures based on calibration curves, either for visual inspection or evaluated through average distance of the calibration curve from the ideal calibration curve. Rahmani et al. noted that average calibration is considered a “weak calibration value,” but that stronger calibration measures are more computationally expensive (*). For statistical processing of the calibration metrics, using exponentially weighted moving averages (EWMA), risk-adjusted EWMA, or a method based on so-called adaptive windowing (ADWIN) was suggested. ADWIN is a sliding window technique, where the window size is not fixed, but determined based on the rate of change of data within the window. Specifically, regarding the ADWIN-based method, Davis et al. underlined the advantages of the method in that it can support different metrics, handle streaming data (as opposed to analyzing in batch), and informs which data might be suitable for use when updating the AI model (*).
Proxy or downstream outcomes
Four sources included a description of the monitoring of proxy or downstream outcomes. Wang et al. described monitoring the number of critical, time-sensitive cases an AI discovers per day as an indicator of the clinical contribution of the model. De Kerf et al. described having monitored an image segmentation model by monitoring the downstream changes in radiation dose calculations and to what extent the final model outcome achieved predetermined clinical goals. Claessens et al. suggested monitoring results of the Turing test, which tests if humans are capable of distinguishing results from an AI model from results generated by a human. To address the challenges in evaluating models where the ground truth is delayed relative to the time of prediction, Feng et al. suggested using 5-day mortality as a proxy indicator of performance for a hypothetical 30-day mortality prediction model (*).
Fairness
Fairness metrics were reported by 3 sources. Bedoya et al. suggested monitoring sensitivity in diverse subgroups, while Corbin et al. suggested tracking a variety of metrics (accuracy, sensitivity, specificity, precision, and AUROC) over patient subgroups, and Smeden et al. suggested monitoring PPV per subgroup.
Performance in general
For performance metrics in general (not further specified), Davis et al. suggested the use of EWMA or risk-adjusted EWMA, while Sahiner et al. suggested ADWIN-based techniques.
Methods for detecting risk of performance change
Types of methods for predicting or detecting risk of changing performance are summarized in Table 2 and each method is described in further detail, including arguments regarding its use in the sections below. Arguments are emphasized using the following symbol (*) in the text.
Table 2
Types of monitoring for detecting/predicting risk of deteriorating performance described in the 39 included sources of the scoping review of methods for monitoring clinical artificial intelligence
| First author, year | Input monitoring | Output monitoring | Feature importance monitoring | Target variable monitoring | Conditional probability monitoring | Intermediate product monitoring | Uncertainty monitoring | Metadata monitoring |
|---|---|---|---|---|---|---|---|---|
| Allen, 2021 | ||||||||
| Aguilar, 2023 | x | |||||||
| American College of Radiology, n.d., Allen, 2019, 2022 | ||||||||
| Andreychenko, 2022 | ||||||||
| Bartels, 2022 | x | x | ||||||
| Bedoya, 2022 | • | |||||||
| Bhaskhar, 2023 | x | |||||||
| Chetverikov, 2023 | ||||||||
| Claessens, 2022 | ||||||||
| Corbin, 2023 | ||||||||
| Davis, 2020 | ||||||||
| Davis, 2022 | ||||||||
| DeKerf, 2023 | ||||||||
| DiMartino, 2023 | x | |||||||
| Duckworth, 2021 | x | x | x | |||||
| Elguindi, 2022 | ||||||||
| Feng, 2022 | x | x | x | |||||
| George, 2023 | x | x | ||||||
| Juluru, 2021 | ||||||||
| Levy, 2022 | ||||||||
| Lundberg, 2020 | x | |||||||
| Magrabi, 2019 | ||||||||
| Mahadevaiah, 2020 | x | |||||||
| Merkow,,a] 2023 | xa | xa | xa | |||||
| Nakatsugawa, 2019 | ||||||||
| Pruski, 2023 | ||||||||
| Rahmani, 2023 | x | x | ||||||
| Rotalinti, 2023 | x | x | ||||||
| Sahiner, 2023 | x | |||||||
| Schelb, 2021 | ||||||||
| Schinkel, 2023 | x | x | ||||||
| Smeden, 2023 | ||||||||
| Stacke, 2021 | x | |||||||
| Wang, 2019 | ||||||||
| Wong, 2023 | ||||||||
| Yang, 2021 | ||||||||
| Zinchenko, 2022 |
For a brief explanation of metrics and statistical methods mentioned, see Appendix IV.
Input monitoring
The most often described methods for monitoring the risk of performance change involved input monitoring methods. Several authors discuss the utilization of statistical process control charts (SPC) for monitoring the input variables. Both Schinkel et al. and Feng et al. describe Shewhart control charts, while Feng et al. also list multiple other statistical process control methods including cumulative sum (CUSUM) and EWMA control charts for individual input variables, and multivariate CUSUM and EWMA and Hotelling’s T2 for monitoring relations between multiple input variables. Pre-processing steps (including dimensionality reduction) to avoid excessive false alarm rates in case of many input variables were likewise discussed in the paper. In addition, distribution distance measures (Wasserstein distance, kernel based measures, and f-divergence) were mentioned. Rahmani et al., while specifying no particular methods, argue that relying solely on single variable input monitoring may be insufficient as this will not detect shifts in the joint distribution of input variables (*).
Bartels et al. report monitoring the fraction of valid requests made to the model, as opposed to fraction of cases with no prediction due to missing data (specified in private correspondence by the authors upon request for details). George et al. suggests monitoring all input variables using the population stability index (PSI). Duckworth et al. describe the graphical representation of levels of input variables on a weekly basis combined with Kolmogorov-Smirnov testing or adversarial validation to test whether the distribution has changed.
Rotalinti et al. describe the use of “data slices,” where certain regions of feature space are defined as “weak slices” (the model is known to have a higher-than-average error rate). Monitoring the proportion of new, unlabeled samples falling within these slices serves as an alert for potential performance degradation.
Bhaskhar et al. designed a “mistrust scoring system” named TRUST-LAPSE, where input variables of a data sample are mapped into latent space and compared with a reference dataset using a combination of 2 different similarity measures. The mistrust scores are then continuously monitored graphically or using a sliding window and significance testing (eg, probability, odds ratio, Kolmogorov-Smirnov-, Wilcoxon- and Mann-Whitney-test) to detect significant changes.
Merkow et al. similarly developed a method named CheXtray for detecting data drifts in x-ray images. This method embeds input data in latent space but also uses image metadata and model output data. These data are then compared with reference data using the Kolmogorov-Smirnov test and χ2 goodness-of-fit test, and a unified metric is calculated combining the obtained similarity measures into 1 single value. This metric is continuously calculated using a sliding window and graphically represented. The authors list several advantages to the metric, namely that it is open-source based, does not require ground truth data, and provides a single value summarizing multiple aspects of the patient data (*). This combined metric by Merkov et al. is the only method identified in the review, which uses monitoring of metadata that is not part of the AI model itself.
Output monitoring
Six sources report output monitoring. One source compared the distribution of risk scores provided by a cancer prediction model with a reference distribution, utilizing Pearson correlation for histograms, χ2 goodness-of-fit test, and Wasserstein distance. One source monitored model firing rates, while another monitored the risk score percentiles per day, and yet another monitored the number of outputs produced and the average predicted risk per week. Bartels et al. monitored the fraction of time where each possible output was predicted (active sleep, quiet sleep, awake). Merkow et al. integrated output monitoring as part of the similarity metric described in the input monitoring section.
Feature importance monitoring
Four sources report on using feature importance monitoring. Two sources monitored Shapley values (SHAP values), while 1 source used SHAP values normalized per input case across all features to avoid drifts in SHAP values due to population drifts. Duckworth et al argue that SHAP values have the advantage of offering guarantees of consistency, with the local SHAP values adding up to the total predicted probability outputted by the model (*). Another source described continuous graphical monitoring of “SHAP loss values,” which models each input’s contribution to the error of the output rather than to the output itself, which thus requires knowledge of ground truth.
Target variable monitoring
Four sources detail monitored the target variable distribution. Duckworth et al. described tracking the target variable distribution (admission rates) in weekly bins and testing for significant changes using Kolmogorov-Smirnov or adversarial testing. Feng et al. suggested tracking summary statistics like mean, variance, or rate of missingness of the target variable or alternatively tracking the residuals from expected values in case of known variations (eg, seasonal variation). The summary statistics would be tracked using the EWMA, CUSUM or Shewharts control charts. Rahmani et al. and Schinkel et al. also suggested tracking the target variable distribution (prevalence of septic patients and blood culture positivity rates respectively).
Conditional probability monitoring
Two sources described monitoring the conditional probability between input and target variables. Rotalinti et al. propose retraining a model repetitively as new data becomes available, calculating the Euclidean distance between the new and the original weight vectors and comparing the difference to a reference distribution based on 100 models on random subsamples of the original dataset. Feng et al. further specify how changes in model weights upon refitting may be evaluated through the Shiryaev-Roberts procedure or the generalized likelihood ratio test.
Intermediate product monitoring
Stacke et al. describe having developed a so-called “representation shift metric,” which measures the distribution shift in high-level features (intermediate products of the model) within the model using Wasserstein distance, Kullback-Leibler divergence, or Kolmogorov-Smirnov statistic. The authors state that the metric robustly detects possible performance drops without requiring labeled data (*).
Uncertainty monitoring
Sahiner et al. suggested using ADWIN to detect changes in uncertainty measures, although they did not specify any particular uncertainty measure.
Discussion
In this scoping review, we provide an overview of specific methods, in terms of metrics and statistical processing, for monitoring the performance of clinical AI. Additionally, we present the rationales behind choosing these methods. We find that monitoring clinical AI has gained increasing attention over the past 5 years; however, the existing evidence remains limited, predominantly comprised of narrative reviews and simulations rather than clinical trials and implementation studies. Of the monitoring methods described, there is a clear emphasis on monitoring well-known clinical performance metrics, with little argumentation provided for this choice. However, varieties of other methods have also been described, including metrics and methods specifically designed for monitoring AI in health care.
Sparsity of evidence
Several observations from this review highlight a relative lack of evidence in this research domain. Notably, the most frequently reported metrics were traditional clinical performance metrics such as AUROC, PPV, NPV, sensitivity, and specificity—methods that rely on access to unbiased ground truth data, which, as outlined in the introduction, is often not readily available. The limited amount of justification given in the included sources for selecting these particular metrics suggests a reliance on tradition rather than deliberations or evidence on the most suitable metric for the specific task.
Some sources reported metrics or statistical methods specifically tailored for monitoring AI in health care, including measures for detecting risk of deteriorating performance. However, these methods were reported only once each and, therefore, lacked external validation. Moreover, most of these methods had not undergone testing or implementation in clinical practice.
In general, there was a relative abundance of opinion papers (33%) and simulation studies (33%) and a relatively low number of (shadow) implementation studies (23%) among the included sources. Again, this suggests a research field in its early developmental stages.
A particular area in which little evidence was uncovered was the ongoing monitoring of AI model fairness, with only 3 studies addressing this aspect and just 1 source reported having implemented a fairness monitoring method. This underscores the need for focus on this area in future research and implementation efforts. Overall, these observations point towards a relative sparsity of evidence and immaturity of the research field.
Little practical guidance
In this review, only 1 official guideline dealing with specific methods for monitoring clinical AI was discovered and this guideline provided only limited advice regarding specific metrics or statistical methods. It seemed to assume unencumbered access to ground truth data, thus not addressing situations where this might not be the case. In conjunction with the overall scarcity of evidence in general, there is thus little guidance available regarding practical implementation of performance monitoring for clinical AI. This leaves health care institutions to determine monitoring strategy for themselves, with the potential for implementation of widely differing systems at different institutions.
As outlined in the introduction, the choice of monitoring strategy should encompass a variety of considerations, balancing both the practical and the ethical aspects affected by the choice. There is not only a need for additional research that rigorously tests, explains, and compares monitoring methods across diverse clinical contexts, but also a need for more holistic guidance on how, in practice, to balance competing considerations when choosing a monitoring strategy. This guidance should preferably come from trusted entities, such as governing bodies, but seems for now to be lacking.
This scoping review found an continual increase of sources dealing with monitoring of clinical AI since 2019. In addition, an abundance of sources mentioning performance monitoring of clinical AI without providing any methodological details was identified. Given this increasing interest from researchers and adding the requirements for real-world performance monitoring issued by governing bodies worldwide, it is clear that this is an emerging field of study. As such, the current scarcity of evidence and guidance on this topic is likely to improve in the coming years.
Strengths and limitations
Although the search strategy for this review was intended to be comprehensive, including both forward and backward citation searches, sources in all languages and geographic locations and including any type of sources, there are indications that the search may have been less than optimal. Specifically, 9 out of 39 sources were identified through the citation searches, indicating potential limitations in the initial search strategy. The dynamic nature of the field and the lack of a standardized nomenclature may have contributed to this challenge. Additionally, the inclusion of studies solely focusing on monitoring clinical AI might have overlooked relevant evidence from studies addressing validation or implementation without explicit mention of monitoring in titles or abstracts.
The review was intended to include all types of evidence, yet the search strategy will have favored scientific articles and governmental documents.
Conclusion
Monitoring performance of clinical AI is an emerging field of study, which will likely gain increased relevance as AI takes on a larger role in health care. This review provides a comprehensive summary of methods described for monitoring performance of AI in health care, revealing a scarcity of evidence, argumentation, and guidance for specific practical implementation. There is a need for further research, discussion, and guidance regarding the specifics of implementing performance monitoring for clinical AI.
Acknowledgments
The authors would like to thank the librarians at the University Library of Southern Denmark for competent assistance with developing the search strategy. Dana Larsen for valuable help with Russian translation.
This review will contribute to a PhD thesis for ESA.
Funding
Preparation of this review was funded by the Region of Southern Denmark and the Faculty of Health Sciences at the University of Southern Denmark. The funding organizations had no involvement in the development, conduct, or conclusion of this review.
Author contributions
ESA contributed to the conceptualization, methodology, data curation, title and abstract screening, full-text screening, data extraction, translation, formal analysis, visualization, and writing of the original draft. JBBK contributed to the methodology, title and abstract screening, full-text screening, data extraction, review and editing of the manuscript. RSH contributed to the title and abstract screening, review, and editing of the manuscript. LHF contributed to the title and abstract screening, full-text screening, review and editing of the manuscript. RR contributed to the methodology, translation, review and editing of the manuscript. DMCA contributed to the translations, review and editing of the manuscript. CLB contributed to the methodology, review and editing of the manuscript. IB and JSM contributed to the methodology, review and editing of the manuscript.
Appendix I: Search strategy
The searches were conducted September 5, 2023 (Embase, MEDLINE, Scopus) and November 12 (ProQuest) and updated November 21, 2023. Animal studies filters for MEDLINE and Embase from McGill University Health Centre Libraries were used, and modified for Scopus (https://www.muhclibraries.ca/training-and-guides/excluding-animal-studies/).
Embase (Ovid)
| Search | Records retrieved | |
|---|---|---|
| #1 | ((machine learning or artificial intelligence or AI or neural net* or deep learning or decision tree* or computational intelligence or machine intelligence or “naïve bayes” or naive bayes or nearest neighbo* or random forrest* or support vector machine* or Xgboost or adaboost or gradient boosting or stepwise regression or regression model or prediction model or prognostic model or diagnostic model or classif* model or baye* model or heuristic model or Markov model or feature detection model or algorit*) adj3 (monitor* or surveil* or updat* or temporal quality or quality assurance or quality assessment or quality management or quality control or stability)).mp. | 6085 |
| #2 | (animal or animals or canine* or dog or dogs or feline or hamster* or lamb or lambs or mice or monkey or monkeys or mouse or murine or pig or pigs or piglet* or porcine or primate* or rabbit* or rats or rat or rodent* or sheep* or veterinar*).ti,kw,dq,jx. not (human* or patient*).mp. | 2,575,625 |
| #3 | (exp animal/ or exp juvenile animal/ or adult animal/ or animal cell/ or animal tissue/ or nonhuman/ or animal experiment/ or animal model/) not human/ | 8,254,361 |
| #4 | limit 1 to (conference abstract or conference paper or “conference review”) | 1364 |
| #5 | 4 not 2 | 1356 |
| #6 | 1 not 4 | 4721 |
| #7 | 6 not (2 or 3) | 4430 |
| #8 | 5 or 7 | 5786 |
MEDLINE (Ovid)
| Search | Records retrieved | |
|---|---|---|
| #1 | ((machine learning or artificial intelligence or AI or neural net* or deep learning or decision tree* or computational intelligence or machine intelligence or “naïve bayes” or naive bayes or nearest neighbo* or random forrest* or support vector machine* or Xgboost or adaboost or gradient boosting or stepwise regression or regression model or prediction model or prognostic model or diagnostic model or classif* model or baye* model or heuristic model or Markov model or feature detection model or algorit*) adj3 (monitor* or surveil* or temporal quality or updat* or quality assurance or quality assessment or quality management or quality control or stability)).mp. | 4769 |
| #2 | (Animals/ or Models, Animal/ or Disease Models, Animal/) not Humans/ | 5,135,647 |
| #3 | ((animal or animals or canine* or dog or dogs or feline or hamster* or lamb or lambs or mice or monkey or monkeys or mouse or murine or pig or pigs or piglet* or porcine or primate* or rabbit* or rats or rat or rodent* or sheep* or veterinar*) not (human* or patient*)).ti,kf,jw. | 2,570,548 |
| #4 | 2 or 3 | 5,620,682 |
| #5 | 1 not 4 | 4541 |
Scopus
| Search | Records retrieved | |
|---|---|---|
| #1 | TITLE-ABS-KEY ( ( “machine learning” OR “artificial intelligence” OR ai OR “neural net*“ OR “deep learning” OR “decision tree*“ OR “computational intelligence” OR “machine intelligence” OR “naive bayes” OR “nearest neighbo*“ OR “random forrest*“ OR “support vector machine*“ OR xgboost OR adaboost OR “gradient boosting” OR “stepwise regression” OR “regression model” OR “prediction model” OR “prognostic model” OR “diagnostic model” OR “classif* model” OR “baye* model” OR “heuristic model” OR “markov model” OR “feature detection model” OR algorit* ) W/3 ( monitor* OR surveil* OR “temporal quality” OR updat* OR “quality assurance” OR “quality assessment” OR “quality management” OR “quality control” OR stability ) ) | 61,211 |
| #2 | TITLE-ABS-KEY( patient OR healthcare OR clinical OR medicine ) OR SUBJAREA ( medi OR nurs OR dent ) | 32,985,621 |
| #3 | TITLE-ABS-KEY (( animal OR animals OR canine* OR dog OR dogs OR feline OR hamster* OR lamb OR lambs OR mice OR monkey OR monkeys OR mouse OR murine OR pig OR pigs OR piglet* OR porcine OR primate* OR rabbit* OR rats OR rat OR rodent* OR sheep* OR veterinar* ) AND NOT ( human* OR patient* )) | 5,985,621 |
| #4 | 1 AND 2 AND NOT 3 | 6637 |
ProQuest Dissertations and Theses Global
| Search | Results retrieved | |
|---|---|---|
| #1 | noft( ( “machine learning” OR “artificial intelligence” OR ai OR (“neural net” OR “neural nets” OR “neural network” OR “neural networks”) OR “deep learning” OR (“decision tree” OR “decision trees”) OR “computational intelligence” OR “machine intelligence” OR “naive bayes” OR (“nearest neighbor” OR “nearest neighboring” OR “nearest neighbors” OR “nearest neighbour” OR “nearest neighbouring” OR “nearest neighbours”) OR “random forrest*“ OR “support vector machine*“ OR xgboost OR adaboost OR “gradient boosting” OR “stepwise regression” OR “regression model” OR “prediction model” OR “prognostic model” OR “diagnostic model” OR “classif* model” OR “baye* model” OR “heuristic model” OR “markov model” OR “feature detection model” OR algorit* ) N/3 ( monitor* OR surveil* OR “temporal quality” OR updat* OR “quality assurance” OR “quality assessment” OR “quality management” OR “quality control” OR stability ) ) | 4176 |
| #2 | noft(healthcare) or if(healthcare) | 39,182 |
| #3 | [S1] AND [S2] | 35 |
Appendix II: Gray literature search queries
European Union
Searched via https://european-union.europa.eu/index_en Date of search: 01.11.2023
Search terms: “artificial intelligence” AND healthcare AND monitor AND performance
Search settings: source: Europa, date: all, language: English, file formats: all
Hits: 585
Full text screened: 21
European parliament (think tank)
Searched via https://www.europarl.europa.eu/thinktank/en/research/advanced-search
Date of search: 02.11.2023
Search terms: Does not work with AND. Search term therefore: “artificial intelligence in healthcare”
Hits: 7
Full text screened: 4
ISO standards
Date of search: 30.10.2023
Search terms: machine learning monitoring healthcare
Search settings: retracted items excluded
Hits: 174
Full text screened: 6
U.S. Food and Drug Administration
Date of search: 27.10.2023
Search terms: artificial intelligence monitoring medical
Hits: 185
Full text screened: 23
The National Institute for Health and Care Excellence
Search #1
Date of search: 26.10.2023
Search terms: monitor quality artificial
Hits: 21
Full text screened: 21
Search #2
Date of search: 26.10.2023
Search terms: artificial intelligence quality assurance
Hits: 13
Full text screened: 6
Search #3
Date of search: 26.10.2023
Search terms: artificial intelligence quality control
Hits: 14
Full text screened: 3
Appendix III: Data extraction instrument
| Item | Example | Explanation/elaboration |
|---|---|---|
| Part 1: Basic information | ||
| Study ID | Davis 2019 | (Automatically filled in by Covidence) |
| Title | Validation and monitoring of a decision tree model for predicting risk of nose bleeding within 24 hours | (Automatically filled in by Covidence) |
| Country of origin (checkboxes, including free-text option) | Canada | Select all relevant options, based on author affiliations |
| Is monitoring clinical AI the primary aim of the study? (multiple choice: yes, no) | Yes | |
| Study design/article type (multiple choice, including free text “other” option) | Opinion paper | |
| Part 2: Monitoring methods | ||
| Methods for monitoring clinical AI described (free text) | Method 1: Multivariate exponentially weighted moving average (no specific type) Method 2: Phase portraits (feature importance) Method 3: AUC of ROC, every 100 samples (discrimination) | If multiple methods, please number; describe metric, statistical processing, and interval as available; categorize each method by type in parentheses |
| Does the article describe actual implementation of the method in a clinical setting? (multiple choice: yes, no) | No | Implementation implies that the results can potentially affect patients. Shadow implementation is not considered implementation. |
| Does the article describe clinical testing of the method? (multiple choice: yes, no) | Yes | Clinical testing implies that the results can potentially affect patients. Shadow implementation is not considered clinical testing. |
| Part 2: Rationales | ||
| Rationales for monitoring choice | 1: General: 1-year interval yield enough data for statistical significance. 2: General: consequences of misclassification limited; therefore, 1-year interval is acceptable. 3: General: Chosen one of each of input variable monitoring, feature importance monitoring and direct performance monitoring, to have diverse monitoring portfolio. 4: Regarding input variable monitoring: easily accessible data. | If multiple, please number. Describe what the argument is related to (eg, a specific type of monitoring or “general”) and state the argument. |
| Part 4: Funding and conflict of interests | ||
| Funding sources (free text) | National institutes of health (NIH) | |
| Funding type (check boxes: public, private, no funding) | Public | Check one or more options |
| Possible conflicts of interest (free text) | As stated in the conflicts of interest statement of the article. If no COI statement: “not reported” | |
| Notes (free text) | Any observation or note that does not fit above can be entered here | |
Appendix IV: Characteristics of included studies
| First author, year | Country of origin | AI monitoring part of aim | Study design/source type | Funding type | Potential conflicts of interests |
|---|---|---|---|---|---|
| Aguilar, 2023 | France | Yes | Simulation on patient cohort | Private (for profit) | Yes |
| Allen, 2019 | USA | Yes | Opinion paper/narrative review | Not reported | Not reported |
| Allen, 2021 | USA | Yes | Opinion paper/narrative review | Not reported | Yes |
| Allen, 2022 | USA | Yes | Opinion paper/narrative review | None | No |
| American College of Radiology, n.d. | USA | Yes | Web application | Private (non-profit) | Not reported |
| Andreychenko, 2022 | Russia | Yes | Implementation study | Not reported | Not reported |
| Bartels, 2022 | The Netherlands | Yes | Opinion paper/narrative review | Not reported | Not reported |
| Bedoya, 2022 | USA | Yes | Opinion paper/narrative review | Not reported | No |
| Bhaskhar, 2023 | USA | Yes | Simulation on patient cohort | Not reported | Not reported |
| Chetverikov, 2023 | Russia | Yes | Sample size calculations | Public | No |
| Claessens, 2022 | USA; The Netherlands; Belgium | Yes | Opinion paper/narrative review | Private (non-profit) | No |
| Corbin, 2023 | USA | Yes | shadow implementation (study also includes a simulation on a patient cohort) | Public; Private (non-profit) | Yes |
| Davis, 2020 | USA | Yes | Simulation on patient cohort | Public | No |
| Davis, 2022 | USA | Yes | Simulation on patient cohort | Public; Private (non-profit) | No |
| DeKerf, 2023 | Belgium | Yes | Implementation study | Not reported | No |
| DiMartino, 2023 | Italy | No | Systematic review | Public | No |
| Duckworth, 2021 | UK | Yes | Simulation on patient cohort | Public | No |
| Elguindi, 2022 | USA | Yes | Implementation study | Not reported | Not reported |
| Feng, 2022 | USA | Yes | Opinion paper/narrative review | Private (non-profit) | Yes |
| George, 2023 | USA | Yes | Shadow implementation | Private (for profit) | Yes |
| Juluru, 2021 | USA | No | Implementation study | Public | Yes |
| Levy, 2022 | USA | Yes | Simulation on patient cohort | Public; Private (non-profit) | No |
| Lundberg, 2020 | USA | Yes | Simulation on patient cohort | Public; Private (non-profit) | No |
| Magrabi, 2019 | Australia; The Netherlands; Austria, Denmark, Finland, UK, Japan | Yes | Opinion paper/narrative review | Not reported | Not reported |
| Mahadevaiah, 2020 | Canada; The Netherlands; India | Yes | Opinion paper/narrative review | Public | No |
| Merkow, 2023 | USA | Yes | Simulation on patient cohort | Private (non-profit) | Not reported |
| Nakatsugawa, 2019 | USA; Japan | No | Simulation on patient cohort | Private (for profit) | No |
| Pruski, 2023 | UK | Yes | Opinion paper/narrative review | Public | No |
| Rahmani, 2023 | USA | Yes | Simulation on patient cohort | Public | Yes |
| Rotalinti, 2023 | UK | Yes | Simulation on synthetic data | Public | Not reported |
| Sahiner, 2023 | USA | Yes | Opinion paper/narrative review | Not reported | No |
| Schelb, 2021 | China; Germany | Yes | Simulation on patient cohort | Public | Yes |
| Schinkel, 2023 | The Netherlands | Yes | Shadow implementation | None | No |
| Smeden, 2023 | The Netherlands | Yes | Guideline | Public | Not reported |
| Stacke, 2021 | Sweden | Yes | Simulation on patient cohort | Public | Yes |
| Wang, 2019 | China | Yes | Opinion paper/narrative review | Public | No |
| Wong, 2023 | USA | No | Implementation study | None | No |
| Yang, 2021 | USA; China | Yes | Implementation study | Public | No |
| Zinchenko, 2022 | Russia | Yes | Opinion paper/narrative review | Public | No |
Appendix V: Explanation of metrics and statistical methods identified in the review
| Name | Explanation |
|---|---|
| Adversarial validation | Tests if 2 datasets come from indistinguishable distributions. A model is trained to predict if a given sample is from one or the other dataset. If the model obtains an AUROC >0.5, signifying that it can, in fact, distinguish data from the 2 sets, this suggests that the datasets are not from the same distribution |
| ADWIN | Adaptive windowing; sliding window technique. The window size is determined by rate of change within the window |
| Agreement rates (diagnostic accuracy) | Number of correct predictions relative to total number of results |
| AUPRC | Area under the precision-recall curve (precision = PPV, recall = sensitivity) |
| AUROC | Area under the receiver operating characteristics curve. ROC = sensitivity plotted against 1-specificity. The probability that given a set of a random positive and a random negative sample, the positive sample will have the highest predicted probability of being positive |
| Brier score | Mean squared error for probabilistic functions |
| Calibration curve | Plot of actual probability vs predicted probability |
| χ2 goodness-of-fit test | Non-parametric test, determining if a sample is likely to come from a specific distribution |
| Confusion matrix | 2×2 matrix of true positives, true negatives, false positives and false negatives. Can be used for calculating specific metric such as PPV, specificity etc |
| CUSUM | Cumulative sum. Metric that cumulates the difference between the observed values and the expected process average over time, thus drifting if the deviations observed are systematically above (or below) the average, even if the deviations are small (also exists in multivariate version) |
| Data slices/weak slices | Certain regions of feature space are defined as “weak slices” where a model is known to have a higher-than-average error rate |
| Dice index | Measures the overlap/similarity of 2 samples. 2x common elements/elements in set 1 + elements in set 2. Often used in image segmentation |
| Drift detection method | Monitoring changes in error rates, detecting significant changes using parametric method |
| Drift detection method, early | As drift detection method, but monitoring time between errors |
| Error rates | Number of errors relative to total number of results |
| Euclidean distance | Length of a line segment between 2 points in space |
| EWMA | Exponentially weighted moving average. Metric (that can be used in a control chart) that tracks the moving average of all previous samples, giving more weight to the latest samples (also exists in multivariate version) |
| f-divergence | A metric of difference between probability distributions |
| Generalized likelihood ratio test | Test for significant difference in the goodness of fit of a model and a similar model, with constraints imposed |
| Hotelling’s T | Multivariate version of student’s t |
| Kappa score | Agreement rate that accounts for chance of agreement happening by chance. K=0 if agreement is no larger than would be expected by chance |
| Kernel based measures | Methods where a kernel function is utilized |
| Kolmogorov-Smirnov testing | Non-parametric test statistic, testing if 2 samples came from the same distribution or if a sample came from a given distribution |
| Kullback-Leibler divergence | A measure of difference between probability distributions; based on difference in entropy |
| Lift | PPV normalized to prevalence |
| Mann-Whitney test | Non-parametric test comparing independent samples |
| Negative predictive value (NPV) | Chance of being a true negative if the test is negative. True negatives/(true negatives + false negatives) |
| Number needed to treat | Number of patients needed to treat to prevent one patient from having an undesired outcome |
| Observed-to-expected ratio | Observed event rate/expected (predicted) event rate |
| Odds ratio | Ratio of odds between 2 exposure groups |
| Pearson correlation | Measure of linear correlation between 2 variables |
| Population stability index (PSI) | A metric of difference between probability distributions |
| Positive predictive value (precision, PPV) | Chance of being a true positive if the test is positive. True positives/(true positives + false positives) |
| Sensitivity | Ability to detect positives. True positives/(true positives+ false negatives) |
| SHAP loss values | Importance of a given variable for the final error of the model |
| SHAP values | Importance of a given variable for the final output of the model. Calculated by comparing model prediction with or without knowledge of the variable |
| Shewhart control chart | Graphical representation of SPC. New observations are plotted on the chart as they become available. The chart includes control limits defined statistically |
| Shiryaev-Roberts procedure | A change point detection method tuned to reduce false alarm rate |
| SPC | Statistical process control. Using statistical methods for monitoring quality of production. Includes a variety of methods including control charts |
| Specificity | Ability to detect negatives. True negatives/(true negatives + false positives) |
| Surface Dice index | As Dice score, but takes into account only the surface, but not the volume inside the surface |
| Turing test | Test the ability of a machine to mimic a human. A human evaluator tries to determine if an output was generated by a machine or another human |
| Wasserstein distance | A metric of distance between 2 probability distributions. Measures the minimum cost of changing from one distribution to the other; “earth mover’s distance.” |
| Wilcoxon-test | Wilcoxon signed-rank test. Non-parametric test for comparing paired samples |
References
1
U.S. Food and Drug Administration. Artificial intelligence and machine learning (AI/ML)-enabled medical devices [internet]. FDA; 2023 [cited 2023 Dec 31]. Available from: https://www.fda.gov/medical-devices/software-medical-device-samd/artificial-intelligence-and-machine-learning-aiml-enabled-medical-devices?2
Fleuren LM, Klausch TLT, Zwager CL, Schoonmade LJ, Guo T, Roggeveen LF, et al. Machine learning for the prediction of sepsis: a systematic review and meta-analysis of diagnostic test accuracy. Intens Care Med 2020;46(3):383–400.3
Cha Y, Kim JT, Park CH, Kim JW, Lee SY, Yoo JI. Artificial intelligence and machine learning on diagnosis and classification of hip fracture: systematic review. J Orthop Surg Res 2022;17(1):520.4
Eriksen Alexander V, Möller S, Ryg J. Use of GPT-4 to diagnose complex clinical cases. NEJM AI 2023;1(1):AIp2300031.5
McKinney SM, Sieniek M, Godbole V, Godwin J, Antropova N, Ashrafian H, et al. International evaluation of an AI system for breast cancer screening. Nature 2020;577(7788):89–94.6
Feng J, Phillips RV, Malenica I, Bishara A, Hubbard AE, Celi LA, et al. Clinical artificial intelligence quality improvement: towards continual monitoring and updating of AI algorithms in healthcare. NPJ Dig Med 2022;5(1):66.7
Vela D, Sharp A, Zhang R, Nguyen T, Hoang A, Pianykh OS. Temporal quality degradation in AI models. Sci Rep 2022;12(1):11654.8
Davis SE, Lasko TA, Chen G, Siew ED, Matheny ME. Calibration drift in regression and machine learning models for acute kidney injury. J Am Med Inform Assoc 2017;24(6):1052–1061.9
Guo LL, Pfohl SR, Fries J, Posada J, Fleming SL, Aftandilian C, et al. Systematic review of approaches to preserve machine learning performance in the presence of temporal dataset shift in clinical medicine. Appl Clin Inform 2021;12(4):808–815.10
Lenert MC, Matheny ME, Walsh CG. Prognostic models will be victims of their own success, unless…. J Am Med Inform Assoc 2019;26(12):1645–1650.11
U.S. Food and Drug Administration and Health Canada and United Kingdom’s Medicines and Healthcare products Regulatory Agency. Good machine learning practice for medical device development: guiding principles [internet]. FDA; 2021 [cited 2024 Sep 16]. Available from: https://www.fda.gov/medical-devices/software-medical-device-samd/good-machine-learning-practice-medical-device-development-guiding-principles.12
Panel for the Future of Science and Technology - European parliamentary Research Service. Artificial intelligence in healthcare: applications, risks, end ethical and societal impacts [internet]. Think Tank European Parliament, 2022 [cited 2024 Sep 16]. Available from: https://www.europarl.europa.eu/thinktank/en/document/EPRS_STU(2022)729512.13
U.K. Medicines and Healthcare Products Regulatory Agency. Software and AI as a medical device change programme - roadmap [internet]. UK Government; 2023 [cited 2024 Sep 16]. Available from: https://www.gov.uk/government/publications/software-and-ai-as-a-medical-device-change-programme/software-and-ai-as-a-medical-device-change-programme-roadmap.14
Zinchenko VV, Arzamasov KM, Chetverikov SF, Maltsev AV, Novik VP, Akhmad ES, et al. Methodology for conducting post-marketing surveillance of software as a medical device based on artificial intelligence technologies. Sovrem Tekhnologii Med 2022;14(5):15–23.15
van Smeden M, Moons C, Hooft L, Kant I, van Os H, Chavannes N Guideline for high-quality diagnostic and prognostic applications of ai in healthcare [internet]. Duch Ministry of Health, Welfare and Sport; 2023 [cited 2024 Sep 16]. Available from: https://aph-qualityhandbook.org/media/hyglawul/guideline-for-high-quality-ai-in-healthcare_en.pdf.16
Minne L, Eslami S, de Keizer N, de Jonge E, de Rooij SE, Abu-Hanna A. Statistical process control for monitoring standardized mortality ratios of a classification tree model. Methods Inf Med 2012;51(4):353–358.17
Davis SE, Greevy RA, Lasko TA, Walsh CG, Matheny ME. Comparison of prediction model performance updating protocols: using a data-driven testing procedure to guide updating. AMIA Annu Symp Proc 2019;2019:1002–1010.18
Allen B, Dreyer K, Stibolt R Jr, Agarwal S, Coombs L, Treml C, et al. Evaluation and real-world performance monitoring of artificial intelligence models in clinical practice: try it, buy it, check It. J Am Coll Radiol 2021;18(11):1489–1496.19
Andersen ES, Birk-Korch JB, Röttger R, Brasen CL, Brandslund I, Madsen JS. Monitoring performance of clinical artificial intelligence: a scoping review protocol. JBI Evid Synth 2024;22(3):453–460.20
Peters MD, Godfrey CM, Khalil H, McInerney P, Parker D, Soares CB. Guidance for conducting systematic scoping reviews. Int J Evid Based Healthc 2015;13(3):141–146.21
Peters MD, Godfrey C, McInerney P, Munn Z, Tricco AC, Khalil H Scoping Reviews. In: Aromataris E, Munn Z, editors. JBI Manual for Evidence Synthesis [internet]. JBI; 2020 [cited 2023 May 1]. Available from: https://synthesismanual.jbi.global.22
Tricco AC, Lillie E, Zarin W, O’Brien KK, Colquhoun H, Levac D, et al. PRISMA extension for Scoping Reviews (PRISMA-ScR): checklist and explanation. Ann Intern Med 2018;169(7):467–473.23
Lundberg SM, Erion G, Chen H, DeGrave A, Prutkin JM, Nair B, et al. From local explanations to global understanding with explainable AI for trees. Nature Machine Intell 2020;2(1):56–67.24
Andreychenko AE, Logunova TA, Gombolevskiy VA, Nikolaev AE, Vladzymyrskyy AV, Sinitsyn VE, et al. A methodology for selection and quality control of the radiological computer vision deployment at the megalopolis scale [internet]. medRxiv; 2022 [cited 2023 Dec 5]. Available from: https://www.medrxiv.org/content/10.1101/2022.02.12.22270663v1.full.25
Lundström C, Lindvall M. Mapping the landscape of care providers’ quality assurance approaches for AI in diagnostic imaging. J Dig Imag 2023;36(2):379–387.26
Page MJ, McKenzie JE, Bossuyt PM, Boutron I, Hoffmann TC, Mulrow CD, et al. The PRISMA 2020 statement: an updated guideline for reporting systematic reviews. BMJ 2021;372:n71.27
Bedoya AD, Economou-Zavlanos NJ, Goldstein BA, Young A, Jelovsek JE, O’Brien C, et al. A framework for the oversight and local deployment of safe and high-quality prediction models. JAMIA 2022;29(9):1631–1636.28
Kuriki PEA, Kitamura FC. Artificial intelligence in radiology: a private practice perspective from a large health system in Latin America. Semin Roentgenol 2023;58(2):203–207.29
Vasilev YA, Vladzymyrskyy AV, Omelyanskaya OV, Arzamasov KM, Chetverikov SF, Rumyantsev DA, et al. Methodology for testing and monitoring artificial intelligence-based software for medical diagnostics. Dig Diagnost 2023;4(3):252–267.30
Bartels R, Dudink J, Haitjema S, Oberski D, van ‘t Veen, A. A perspective on a quality management system for AI/ML-based clinical decision support in hospital care. Front Dig Health 2022;4:942588.31
Aguilar C, Pacile S, Weber N, Fillard P. Monitoring methodology for an AI tool for breast cancer screening deployed in clinical centers. Life (Basel, Switzerland) 2023;13(2):440.32
American College of Ragiology AI-LAB ASSESS; [internet]. n.d. [cited 2023 Dec 25]. Available from: https://ailab.acr.org/Assess/Index.33
Allen B, Dreyer K. The role of the ACR Data Science Institute in advancing health equity in radiology. J Am Coll Radiol 2019;16(4 Pt B):644–648.34
Allen B, Dreyer K, Wald C. Selecting, evaluating and monitoring artificial intelligence models for clinical use. Insight Imag 2022;14(Supplement 4):395.35
Bhaskhar N, Rubin DL, Lee-Messer C. An explainable and actionable mistrust scoring framework for model monitoring. IEEE Trans Artif Intell 2023;5(4):1473–1485.36
Chetverikov SF, Arzamasov KM, Andreichenko AE, Novik VP, Bobrovskaya TM, Vladzimirsky AV. Approaches to sampling for quality control of artificial intelligence in biomedical research. Sovrem Tekhnologii Medits 2023;15(2):19–25.37
Claessens M, Oria CS, Brouwer CL, Ziemer BP, Scholey JE, Lin H, et al. Quality assurance for AI-based applications in radiation therapy. Semin Radiat Oncol 2022;32(4):421–431.38
Corbin CK, Maclay R, Acharya A, Mony S, Punnathanam S, Thapa R, et al. DEPLOYR: a technical framework for deploying custom real-time machine learning models into the electronic medical record. J Am Med Inform Assoc 2023;30(9):1532–1542.39
Davis SE, Greevy RA, Lasko TA, Walsh CG, Matheny ME. Detection of calibration drift in clinical prediction models to inform model updating. J Biomed Inform 2020;112:103611.40
Davis SE, Walsh CG, Matheny ME. Open questions and research gaps for monitoring and updating AI-enabled tools in clinical settings. Front Digit Health 2022;4:958284.41
De Kerf G, Claessens M, Raouassi F, Mercier C, Stas D, Ost P, et al. A geometry and dose-volume based performance monitoring of artificial intelligence models in radiotherapy treatment planning for prostate cancer. Phys Imaging Radiat Oncol 2023;28:100494.42
Di Martino F, Delmastro F. Explainable AI for clinical and remote health applications: a survey on tabular and time series data. Artif Intell Rev 2023;56(6):5261–5315.43
Duckworth C, Chmiel FP, Burns DK, Zlatev ZD, White NM, Daniels TWV, et al. Using explainable machine learning to characterise data drift and detect emergent health risks for emergency department admissions during COVID-19. Sci Rep 2021;11(1):23017.44
Elguindi S, Li A, Zhu M, Cervino L, Veeraraghavan H, Jiang J, et al. Automated contour edit tracking to improve AI auto-segmentation. Med Phys 2022;49(6):e133.45
George R, Ellis B, West A, Graff A, Weaver S, Abramowski M, et al. Ensuring fair, safe, and interpretable artificial intelligence-based prediction tools in a real-world oncological setting. Comm Med 2023;3(1):88.46
Juluru K, Shih H-H, Keshava Murthy KN, Elnajjar P, El-Rowmeim A, Roth C, et al. Integrating Al algorithms into the clinical workflow. Radiol Artific intell 2021;3(6):e210013.47
Levy TJ, Coppa K, Cang J, Barnaby DP, Paradis MD, Cohen SL, et al. Development and validation of self-monitoring auto-updating prognostic models of survival for hospitalized COVID-19 patients. Nature Comm 2022;13(1):6812.48
Magrabi F, Ammenwerth E, McNair JB, De Keizer NF, Hypponen H, Nykanen P, et al. Artificial intelligence in clinical decision support: challenges for evaluating AI and practical implications. Yearbook Med Inform 2019;28(1):128–134.49
Mahadevaiah G, Prasad RV, Bermejo I, Jaffray D, Dekker A, Wee L. Artificial intelligence-based clinical decision support in modern medical physics: selection, acceptance, commissioning, and quality assurance. Med Phys 2020;47(5):e228–e235.50
Merkow J, Soin A, Long J, Cohen JP, Saligrama S, Bridge C, et al. CheXstray: a real-time multi-modal monitoring workflow for medical imaging AI. Lecture Notes Comp Sci 2023;14222LNCS:326–336.51
Nakatsugawa M, Cheng Z, Kiess A, Choflet A, Bowers M, Utsunomiya K, et al. The needs and benefits of continuous model updates on the accuracy of RT-induced toxicity prediction models within a learning health system. Int J Radiat Oncol Biol Phys 2019;103(2):460–467.52
Pruski M. Ethics framework for predictive clinical AI model updating. Ethics Inform Technol 2023;25(3.53
Rahmani K, Thapa R, Tsou P, Casie Chetty S, Barnes G, Lam C, et al. Assessing the effects of data drift on the performance of machine learning models used in clinical sepsis prediction. Int J Med Inform 2023;173:104930.54
Rotalinti Y, Tucker A, Lonergan M, Myles P, Branson R, Koprinska I, et al. Detecting drift in healthcare AI models based on data availability. Comm Comp Inform Sci 2023;1753 CCIS:243–258.55
Sahiner B, Chen W, Samala RK, Petrick N. Data drift in medical machine learning: implications and potential remedies. Br J Radiol 2023;96(1150):20220878.56
Schelb P, Wang X, Radtke JP, Wiesenfarth M, Kickingereder P, Stenzinger A, et al. Simulated clinical deployment of fully automatic deep learning for clinical prostate MRI assessment. Eur Radiol 2021;31(1):302–313.57
Schinkel M, Boerman AW, Paranjape K, Wiersinga WJ, Nanayakkara PWB. Detecting changes in the performance of a clinical machine learning tool over time. EBioMedicine 2023;97:104823.58
Stacke K, Eilertsen G, Unger J, Lundström C. Measuring domain shift for deep learning in histopathology. IEEE J Biomed Health Inform 2021;25(2):325–336.59
Wang H, Xiao Y, Meng X, Ren H, Liu S. Quality control of artificial intelligence for medical imaging during clinical use. Chinese J Radiol 2019;53(9):723–727.60
Wong K-P, Homer SY, Wei SH, Yaghmai N, Estrada Paz OA, Young TJ, et al. Integration and evaluation of chest X-ray artificial intelligence in clinical practice. J Med Imaging (Bellingham, Wash) 2023;10(5):051805.61
Yang R, Yang X, Wang L, Li D, Guo Y, Li Y, et al. Commissioning and clinical implementation of an autoencoder based classification-regression model for VMAT patient-specific QA in a multi-institution scenario. Radiother Oncol 2021;161:230–240.