1. Introduction
Adalimumab [ADA] is an effective subcutaneous anti-tumour necrosis factor [TNF] agent for induction and maintenance of steroid-free remission in Crohn’s disease [CD]. CD is associated with disease complications, surgery, extra-intestinal manifestations and fatigue, all impacting quality of life., Hence, adequate therapy aiming to reduce inflammation and to prevent complications is important. Recommended ADA dosing is 160 mg at baseline and 80 mg at week 2 for induction, followed by 40 mg every 2 weeks during maintenance., While effective, biologics lead to increasing healthcare costs for inflammatory bowel disease [IBD] worldwide, in turn increasing the financial burden on healthcare systems.
Withdrawing ADA in patients with quiescent CD could reduce medication costs, especially in patients who remain in stable remission. However, 38% of patients who withdraw ADA experience CD recurrence within 1 year, and 52% within 2 years of follow-up., Increasing the dose interval is an alternative strategy to strike a balance between cost reduction and maintaining remission and quality of life. This strategy was shown to be cost-effective in other immune-mediated inflammatory diseases such as rheumatoid arthritis and psoriasis.,
We investigated non-inferiority and safety of increasing ADA dose intervals in a randomized controlled trial [RCT] in patients with CD. We found that increasing ADA dose intervals was non-inferior for persistent flares and that 80% of patients were on an extended dose interval after 48 weeks. Moreover, healthcare costs were lower in the intervention group. However, patients in the intervention group were less likely to be in clinical remission and used more escape medication. Whether the reduction in healthcare costs adequately compensates for the impact of slightly increased disease activity on quality of life and other societal costs in the intervention group is an unanswered question. In this study, we aimed to assess the cost-effectiveness of increasing the ADA dose interval compared to the conventional dose interval in patients with CD in clinical remission based on data from the aforementioned multi-centre RCT.
2. Materials and Methods
2.1. Trial design
The LADI trial was initiated by the Radboud University Medical Centre in Nijmegen and the Erasmus University Medical Centre in Rotterdam, The Netherlands, and patients were included in 20 centres in The Netherlands between May 2017 and July 2020. Trial design and clinical outcomes of this pragmatic and investigator-initiated, open-label, multi-centre, non-inferiority RCT were previously reported., In summary, adult patients with CD who were in steroid-free clinical remission on ADA maintenance therapy [40 mg every other week, ≥9 months] were eligible for inclusion. These patients were randomized [2:1], stratified on concomitant immunosuppressant use, to the intervention and control group, respectively [Figure 1]. Patients in the intervention group increased the ADA dose interval first to 3 and subsequently to 4 weeks while patients in the control group continued the conventional 2-weekly dose interval. Patients were followed-up for 48 weeks. The sample size of 174 patients was determined based on non-inferiority with regard to the primary outcome, which was the cumulative incidence of persistent flares.
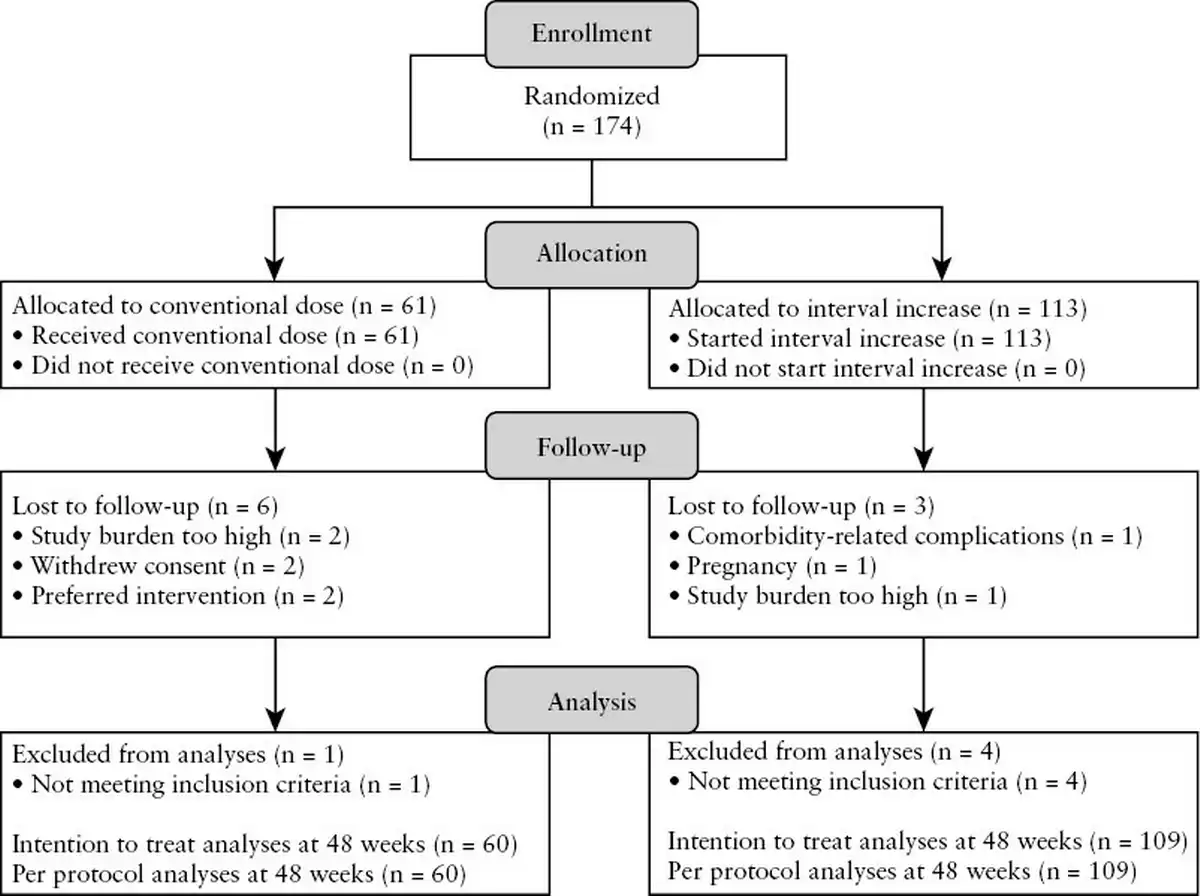
Figure 1
CONSORT flow diagram. Adapted with permission from van Linschoten et al., copyright Elsevier [2023].
2.2. Primary and secondary outcomes
Outcome measures of the economic evaluation were health-related quality of life and societal costs. Health-related quality of life was measured at baseline and weeks 24 and 48 using the EQ-5D-5L. These were transformed into utility scores using standard Dutch tariffs. Utility scores represent quality of life as based on preferences of the Dutch population, which can range between −0.446 [worst] and 1 [perfect health]. Utility during the study period was estimated as the area under the curve between the three measurements, assuming that changes in the EQ-5D-5L over time were linear. As the study period was less than 52 weeks, utility scores and costs were not discounted.
We considered healthcare costs [medication and other healthcare costs], productivity costs and patient costs. Healthcare use in the preceding 12 weeks was assessed with the institute of Medical Technology Assessment [iMTA] Medical Consumption Questionnaire [iMCQ] every 12 weeks during the 48-week follow-up, supplemented with information on CD-related medication use, outpatient clinic visits and diagnostics extracted from medical charts. Patient costs consisted of informal care and were measured using the iMTA MCQ. Healthcare and patient costs were valued according to the Dutch guideline., If no unit prices were available in the guideline, insurance tariffs were used. All costs were adjusted to 2022 euros using the consumer price index from January 2022. For costs per resource unit, see Supplementary Table S1.
Productivity losses were estimated with the iMTA Productivity Cost Questionnaire [iPCQ] every 12 weeks. Productivity losses consisted of absenteeism [sick leave], presenteeism [reduced effectiveness at work] and loss of unpaid work. Measured productivity losses were extrapolated from 4 to 12 weeks, and valued according to the friction cost method with a single wage rate and a friction period of 85 days., Costs of labour were adjusted to 2022 euros using the indexed price of labour [Supplementary Table S1].
2.3. Statistical methods
Prior to the start of the trial we specified both per-protocol analyses as well as intention-to-treat analyses for both clinical outcomes and the cost–utility analyses. As all patients met the per-protocol criteria for their respective group, the per-protocol and intention-to-treat analyses overlapped perfectly. Multiple imputation was used to handle missing data. Bootstrapping was used to account for uncertainty and construct confidence intervals [CIs]. For more details on the method of imputation, see the Supplementary Methods.
Utility and costs are presented per group, and differences between groups are reported as mean differences from both the observed and the bootstrapped datasets and the corresponding 95% bias-corrected accelerated CI [95% BCa CI]. A decremental cost-effectiveness ratio [DCER] was calculated, which is the monetary gain for each quality-adjusted life year [QALY] lost when adopting the intervention. Uncertainty around the DCER from the bootstrapped data is shown in a cost-effectiveness plane. The incremental net monetary benefit [iNMB] of adopting the intervention was calculated at relevant willingness-to-accept [WTA] levels and plotted in a cost-effectiveness acceptability curve [CEAC].
WTA is a way to value quality of life in monetary terms. This can be used to measure both the effect of an intervention on quality of life and costs in a single number, called the iNMB. WTA is the minimum compensation required to accept the loss of one QALY. Higher values for WTA mean that more compensation is necessary for the loss of a QALY. In the Netherlands, common thresholds for a QALY are €20 000, €50 000 and €80 000 respectively for low, medium and severe disease burden, while in the UK a range between £20 000 and £30 000 per QALY is used.,
The iNMB of an intervention is the societal benefit of adopting an intervention as opposed to the control. The iNMB combines the gain or loss in quality of life and costs using WTA thresholds. First, the loss in QALYs due to the intervention as compared to the control is valued with the WTA threshold. This is added to the difference in costs between the two groups. The resulting number is the iNMB of the intervention, which indicates the monetary benefit [or loss] of the intervention as compared to the control, taking into account both quality of life and costs. A positive iNMB indicates that adopting the intervention is preferable over the conventional dose interval at the given WTA threshold. A CEAC shows the probability that the intervention is cost-effective at different WTA levels.
Most cost-effectiveness studies calculate an incremental cost-effectiveness ratio [ICER], as opposed to a DCER, and use willingness to pay [WTP] thresholds, instead of WTA thresholds. An ICER is the monetary costs for each QALY gained when adopting the intervention, while WTP is the money society is willing to pay for the gain of one QALY. In a cost-effectiveness plane, an ICER would be in the upper right quadrant of the plot, while a DCER would be in the lower left quadrant. We use DCER and WTA thresholds because our intervention leads to a reduction in both QALYs and costs. Our analysis presented here is carried out to answer the question: what reduction in costs would adequately compensate for the loss in QALYs?
2.4. Sensitivity analyses
To assess the robustness of the results under different assumptions, we performed four sensitivity analyses. In the first sensitivity analysis, productivity losses were valued according to the human capital approach [HCA]. In the second sensitivity analysis, a healthcare perspective was selected, in which only healthcare costs were included on the cost side. In the third sensitivity analysis, we investigated the effect of different ADA prices on the iNMB of the intervention. ADA prices are relatively low in the Netherlands due to the widespread use of biosimilars. Moreover, actual ADA prices may be lower than list prices due to confidential discounts. This type of sensitivity analysis provides information on how the intervention would translate to a setting with lower or higher prices for biologics. In the last sensitivity analysis, we investigated the cost-effectiveness of the intervention with persistent flares as the outcome, which was the primary outcome of the RCT. A persistent flare was defined as the presence of at least two of the following criteria for 8 weeks or longer: HBI score ≥5, C-reactive protein ≥10 mg/L, faecal calprotectin >250 µg/g, and a concomitant decrease in the ADA dose interval or start of escape medication.
2.5. Patient and public involvement
The Dutch Crohn’s and colitis patient organization [Crohn & Colitis NL] was involved in the design of the study. Results from a biological focus group organized by Crohn & Colitis NL were used to optimize patient participation in the study. For more details on the study protocol see Smits et al.
3. Results
3.1. Patients
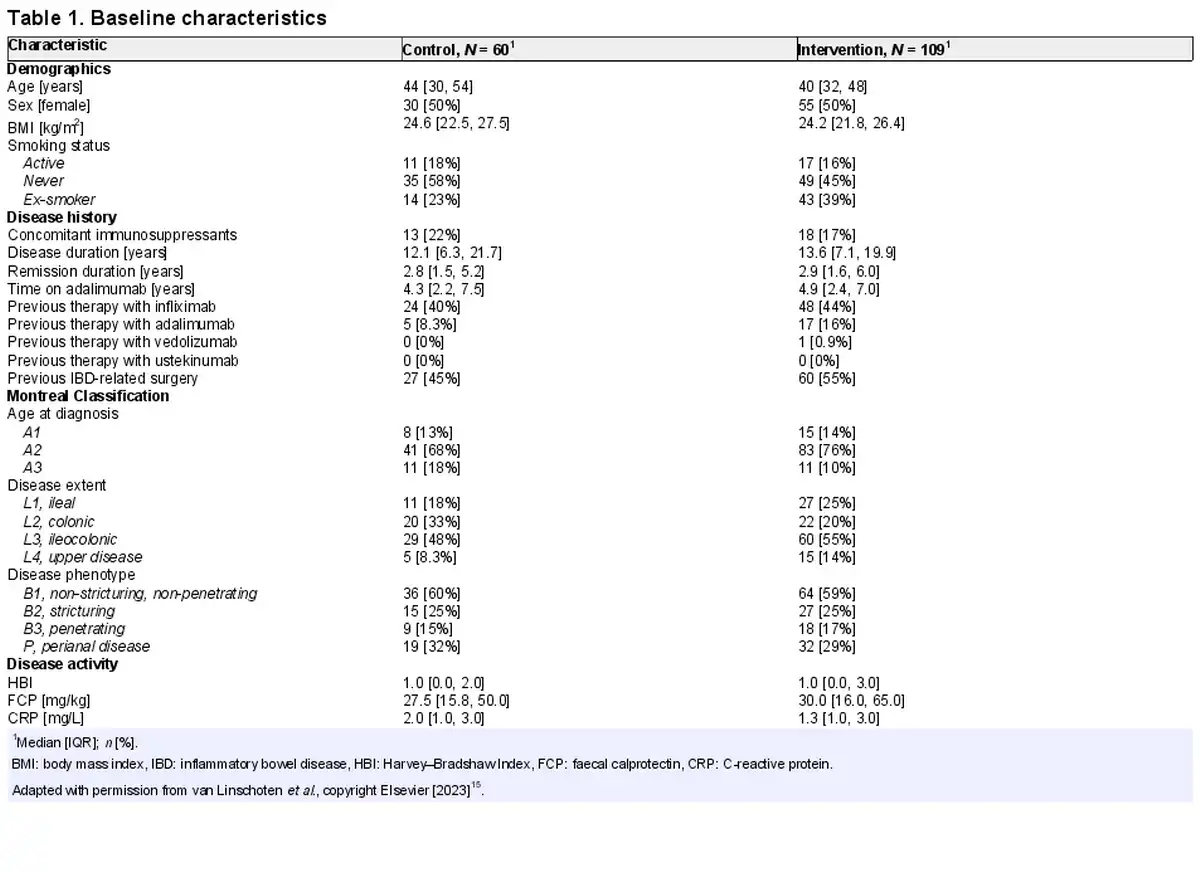
We enrolled 174 patients with CD in the RCT, 61 patients in the control group and 113 patients in the intervention group. At the end of follow-up, 60 patients were eligible for analysis in the control group and 109 in the intervention group. Five patients were excluded from the analyses for not meeting the inclusion criteria [ Figure 1]. Baseline characteristics were previously described. In summary, most patients had ileocolonic, non-stricturing non-penetrating disease and were in sustained steroid-free clinical remission on ADA for a median of 3 years with a median faecal calprotectin of 29 mg/kg at baseline. In total, 18% of patients used concomitant immunosuppressants and 43% were previously treated with infliximab [Table 1].
3.2. Utility and costs
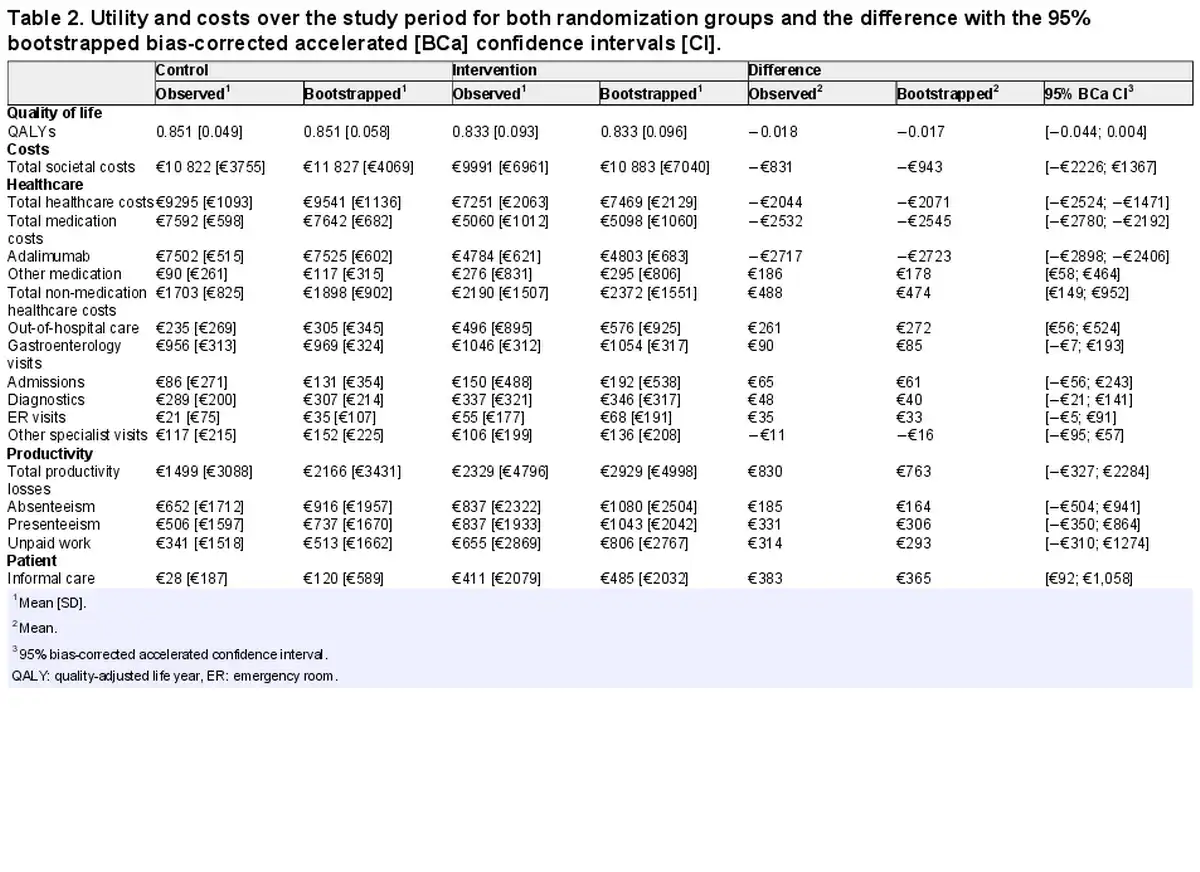
Mean utility (−0.017, 95% BCa CI [−0.044; 0.004]) and mean total costs (−€943, [−€2226; €1367]) were comparable over the 48-week study period between the two groups. Medication costs per patient were lower (−€2545, 95% BCa CI [−€2780; −€2192]) in the intervention group, while non-medication healthcare (+€474, [€149; €952]) and patient costs (+€365, [€92; €1058]) were higher [ Table 2].
3.3. Cost–utility analysis
The DCER of the intervention was €45 065, meaning that for every QALY lost, there was a reduction of €45 065 in costs. There was considerable uncertainty about the DCER, as bootstrap replications showed situations where the intervention was the dominant option [both higher utility and lower costs as compared to the control group, 7.3% of replications; lower right quadrant of Figure 2] and situations where the conventional dose interval was dominant [12.9%; upper left quadrant of Figure 2]. Most bootstrap replications [80%; lower left quadrant of Figure 2] showed that there was a small loss of utility in the intervention group, with a reduction in total costs.
Figure 2
Scatterplot of incremental costs and effectiveness of increasing the adalimumab dose interval as compared to the conventional dose interval.
Increasing the ADA dose interval was likely to be cost-effective as compared to the conventional dose interval at WTA levels below €53 960 per QALY [Figure 3]. Above this threshold, the conventional dose interval was more likely to be cost-effective. iNMB was €594 (95% BCa CI [−€2099; €2050]), €69 [–€2908; €1965] and −€455 [−€4096; €1984] at respective WTA levels of €20 000, €50 000 and €80 000 [Table 3].
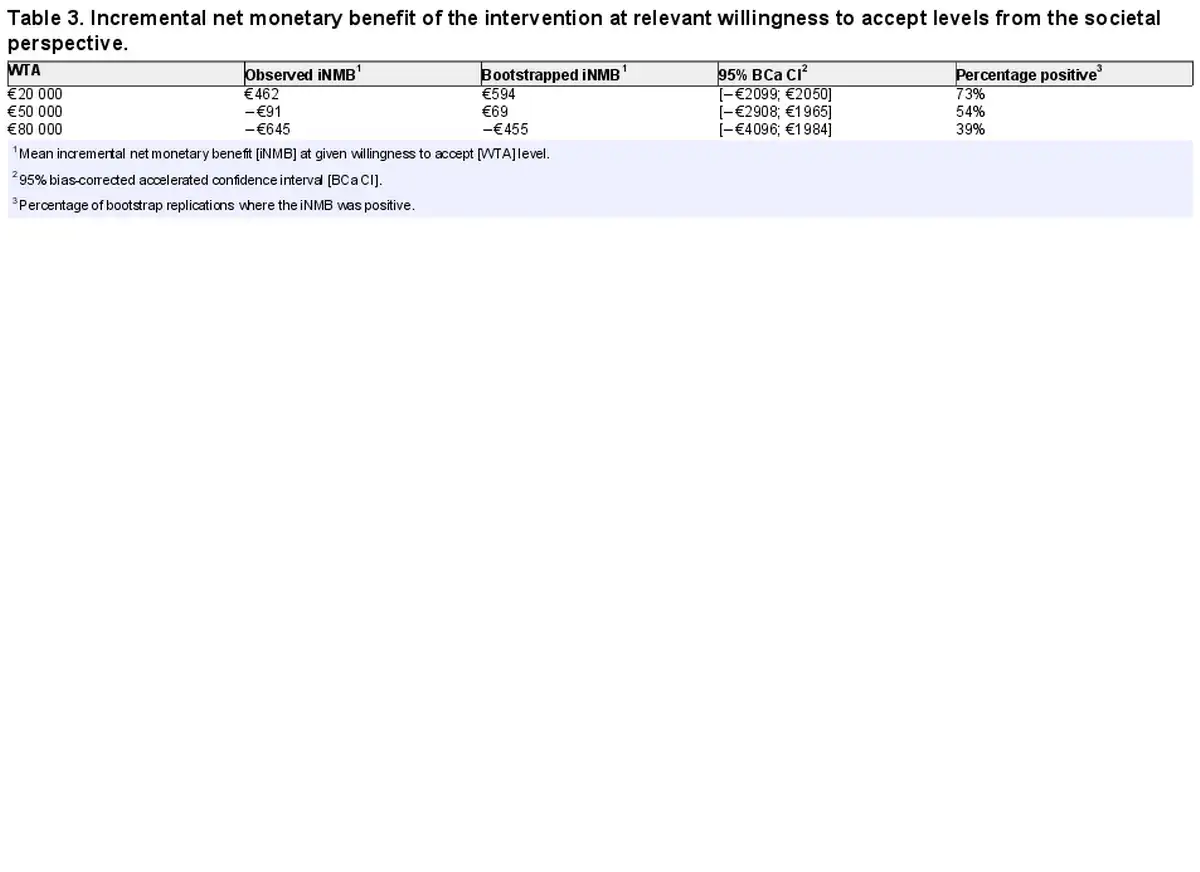
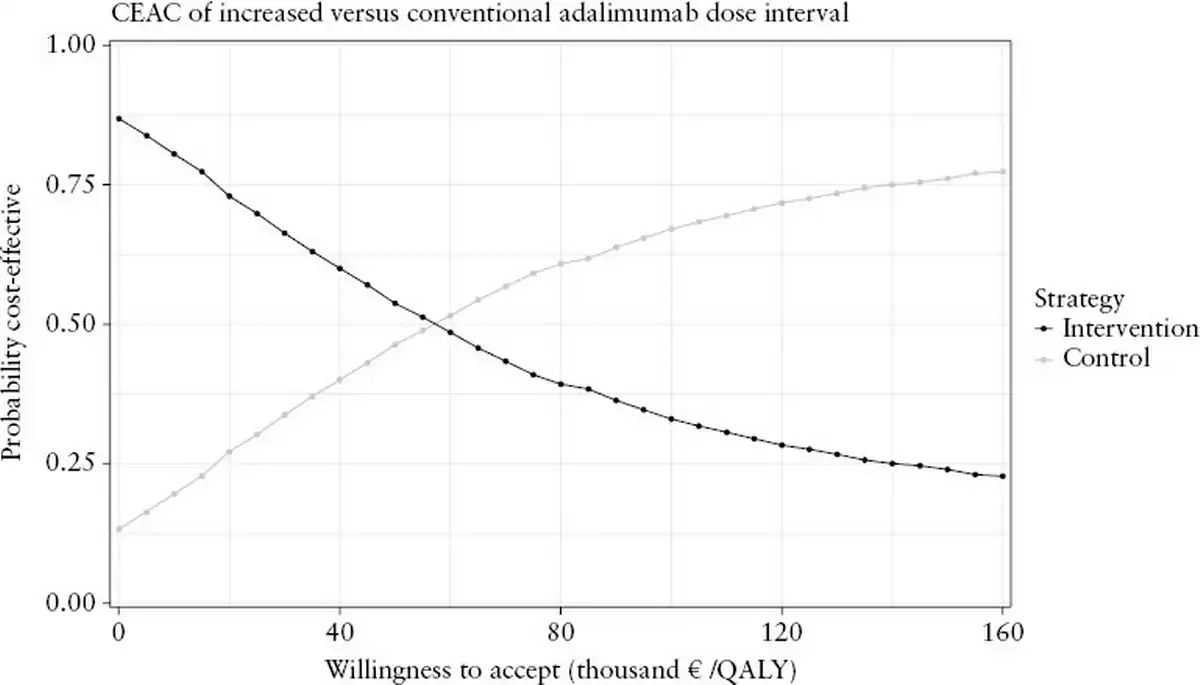
Figure 3
Cost-effectiveness acceptability curve of increasing the adalimumab dose interval as compared to the conventional dose interval.
CEAC: cost-effectiveness acceptability curve; QALY: quality-adjusted life year.
3.4. Sensitivity analyses
When we valued productivity losses according to the human capital approach, DCER of the intervention was €29 942. Compared to the friction cost method, the conventional dose interval was more frequently the dominant option [23.4% of replications, Supplementary Figure S1]. Increasing the ADA dose interval was cost-effective at WTA levels below €37 503 [Supplementary Figure S2]. iNMB was €306 (95% BCa CI [−€3058; €1956]], −€218 [−€3884; €1873] and −€743 [−€4754; €1926] at respective WTA levels of €20 000, €50 000 and €80 000 [Supplementary Table S2].
From the healthcare perspective, DCER of the intervention was €110 789. Compared to the societal perspective, the intervention always led to cost savings and was never dominated by the conventional dose interval [Supplementary Figure S3]. Increasing the ADA dose interval was cost-effective from the healthcare perspective at WTA levels below €118 483 [Supplementary Figure S4]. iNMB was €1722 (95% BCa CI [€804; €2413]), €1197 [−€465; €2462] and €673 [−€1878; €2505] at respective WTA levels of €20 000, €50 000 and €80 000 [Supplementary Table S3].
When assessing the effect of ADA prices, we found that if ADA prices increased by 25% [from €322.33 to €402.91 per dose] the intervention was likely to be cost-effective over the entire threshold of WTA levels considered. In agreement, this effect was evidently more pronounced when ADA prices increased further. However, with ADA prices 25% lower, the conventional dose interval was likely to be cost-effective over the entire threshold of WTA levels [Figure 4].
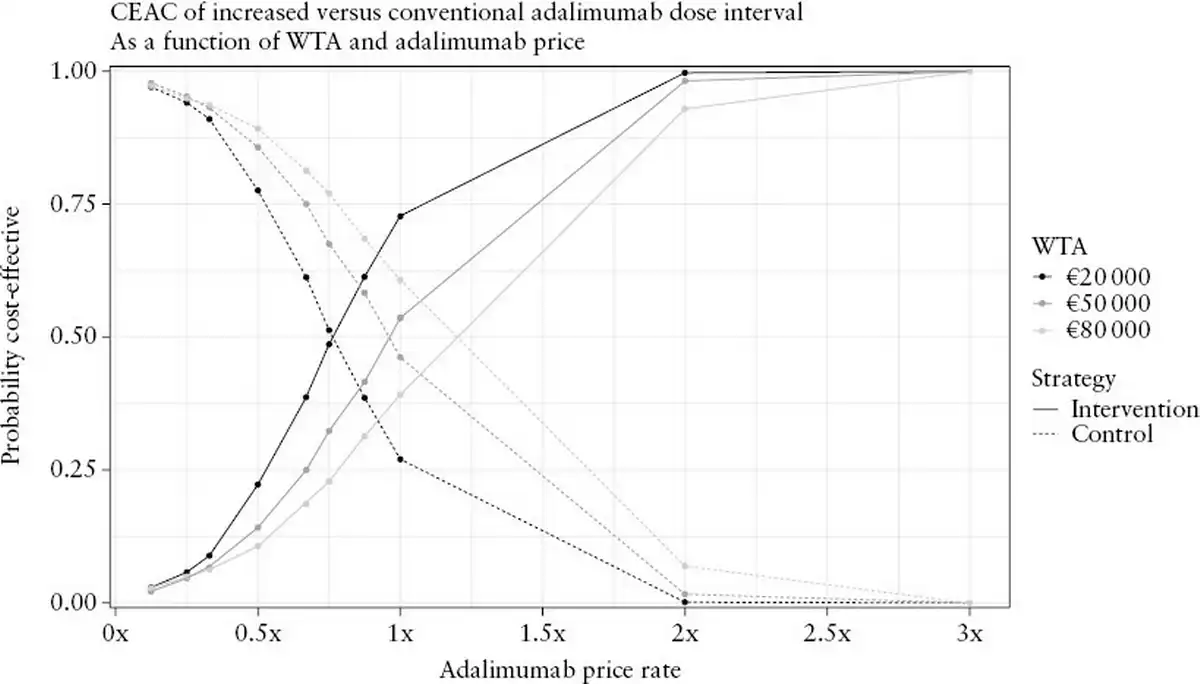
Figure 4
Cost-effectiveness acceptability curve of increasing the adalimumab [ADA] dose interval as compared to the conventional dose interval with different ADA costs per dose.
CEAC: cost-effectiveness acceptability curve; WTA: willingness to accept, in euros per quality-adjusted life year.
With persistent flares as the outcome, the intervention was always less effective than the conventional dose interval, as three persistent flares were observed in the intervention group and none in the control group. The DCER was €30 208, meaning that for each flare in the intervention group, costs were reduced by €30 208. From the bootstrapped data we found that in 13.2% of the cases, the conventional dose interval was dominant, while the intervention led to cost savings in the other 86.8% of cases [Supplementary Figure S5].
4. Discussion
Our multi-centre RCT investigated the outcomes of increasing ADA dose intervals in patients with CD in stable clinical and biochemical remission and this paper presents the economic evaluation. Increasing ADA dose intervals reduced societal costs with only a limited loss in quality of life. When converting the loss in quality of life to a monetary scale and weighing against the cost reduction, the intervention was likely to be cost-effective when a QALY was valued at less than €53 960. At the relevant thresholds of €50 000 in the Netherlands and €30 000 in the UK, increasing ADA dose intervals is beneficial compared to continuing the conventional dose interval.
Average quality of life was slightly lower in the intervention group, with a CI between −0.044 and 0.004. However, the difference in QALYs between groups is small and does not seem to be clinically relevant based on the instrument-defined minimally important differences of 0.05., The main benefit of the increased dose interval was the reduction in medication costs, which were about 33% lower in the intervention group. While this is a considerable decrease, the introduction of ADA biosimilars in the Netherlands reduced the unit costs of ADA, while in other countries the ADA prices are higher. This may have reduced the possible benefit of the intervention., This observation was also supported by the sensitivity analyses, which were consistent with a clear benefit of the intervention over the entire range of WTA levels when ADA prices were increased.
The reduction in medication costs in the intervention group was in part counteracted by increased costs for out-of-hospital care, productivity and informal care. While costs for in-hospital care such as gastroenterologist visits, admissions and diagnostics were also slightly higher in the intervention group, these differences were small as compared to differences in medication, productivity and patient costs. The increase in these costs was probably related to lower rates of clinical remission in the intervention group, which did not seem to warrant in-hospital care, but limited patients in their work and calls upon primary care practitioners and informal care providers.
These findings were also reflected in the sensitivity analyses. When productivity costs were valued according to the human capital approach and long-term sick leave is incorporated in the cost-effectiveness analysis, the effect of the intervention on costs was lower. From the healthcare perspective (removing productivity and patient costs from the equation), the intervention always led to cost savings and was cost-effective below a WTA level of €118 483. We conclude that while increasing ADA dose intervals leads to a reduction in costs, there is also a substantial shift in costs from medication to primary care, productivity and patient costs. We performed an additional sensitivity analysis with persistent flares as the outcome. This showed a cost reduction of €30 208 per persistent flare. However, this is relatively hard to interpret, as this does not take all consequences of the intervention on quality of life into account and no WTA thresholds for persistent flares exist.
WTP or WTA levels are important factors for the decision on whether an intervention should be adopted. In the Netherlands, thresholds for WTP are set at €20 000, €50 000 and €80 000 for low, medium and severe disease burden, respectively, while in the UK a threshold range between £20 000 and £30 000 is used., While there is uncertainty in applying the Dutch WTP thresholds, examples are a threshold of €50 000 for a new heart failure treatment and a threshold of either €50 000 or €80 000 for a new treatment for chronic lymphocytic leukaemia. An important caveat is that WTA levels often exceed WTP levels for healthcare consumers, meaning that patients want to be compensated more for a loss than they would pay for the same gain. As there are no formal WTA thresholds, we used the WTP thresholds to interpret cost-effectiveness of the intervention. Under almost all WTP thresholds increasing ADA dose intervals would be cost-effective. Only at an WTP of €80 000 would the conventional dose interval be more likely to be cost-effective, yet disease burden is unlikely to be severe in this population of patients with CD in stable clinical and biochemical remission. Based on our results and the aforementioned thresholds, increasing ADA dose intervals is a cost-effective strategy.
There are no studies available that have investigated cost-effectiveness of increasing ADA dose intervals in patients with CD, but similar studies have been conducted in rheumatoid arthritis and psoriasis., Results across all three immune-mediated inflammatory diseases were similar, reporting both a small decrease in QALYs in the intervention group as well as a reduction in total costs. The reduction in costs and subsequently cost-effectiveness in our study was smaller, largely driven by the reduction in medication costs for ADA over time after the introduction of biosimilars.
The main strength of this study was the pragmatic randomized controlled multi-centre design. Randomization strengthened the internal validity of the study. The pragmatic design that reflects clinical practice and broad inclusion criteria improve the generalizability of the study outcomes. Several limitations should be noted as well. First, some patients dropped out of the study or stopped filling out surveys, the impact of which was minimized by multiply imputing missing data. However, there remained the possibility that data were missing not at random which could bias imputed estimates. Second, resource utilization was valued using Dutch cost-prices according to the guideline. Different prices between healthcare systems may limit the generalizability of cost-effectiveness. An example is North America, where ADA list prices are almost ten times higher than the unit cost used in this study. We have performed sensitivity analyses, which showed that in these settings, the intervention was likely to be cost-effective. However, in situations with ADA prices 25% lower than used in this study, the conventional dose interval is probably more cost-effective. Third, while the intervention was cost-effective over the study period, a tight control setting is needed when increasing ADA dose intervals, while increased dose intervals may lead to higher loss of response rates and complications in the long term, as indicated by reduced clinical and biochemical remission rates at week 48. This might reflect mild disease activity, which in the long term might lead to uncontrolled inflammation and in turn potential hospitalization, surgery, increased costs and reduced quality of life. Our study group is currently conducting an extension study to evaluate the effect of increased dose intervals on long-term outcomes after 3 years. However, accumulation of bowel damage due to mild disease activity might only manifest after a longer follow-up period. Fourth, inflammatory parameters were very low at baseline due to the inclusion criteria. It is likely that these patients represent a very stable cohort, which is important to keep in mind when implementing the strategy of increased ADA dose intervals in clinical practice.
In conclusion, in our pragmatic multi-centre RCT, increasing ADA dose intervals resulted in lower medication costs and a small reduction in utility for patients with CD in clinical and biochemical remission. When valuing the loss of a QALY below €53 960, increasing the ADA dose interval is a cost-effective strategy in patients with CD in stable remission. Overall, increasing ADA dose intervals in patients with CD in stable remission is a cost-effective treatment strategy while clinical outcomes, risk preferences and the patient’s perspective on medication remain important factors that should be considered as well.
References
- 1. Colombel JF, Sandborn WJ, Rutgeerts P, et al. Adalimumab for maintenance of clinical response and remission in patients with Crohn’s disease: the charm trial. Gastroenterology2007;132:52–65.
- 2. Abbass M, Cepek J, Parker CE, et al. Adalimumab for induction of remission in Crohn’s disease. Cochrane Database Syst Rev2019;2019. doi:10.1002/14651858.CD012878.pub2.
- 3. Sandborn WJ, Hanauer SB, Rutgeerts P, et al. Adalimumab for maintenance treatment of Crohn’s disease: results of the classic ii trial. Gut2007;56:1232–9.
- 4. Brandse JF, Vos LM, Jansen J, et al. Serum concentration of anti-TNF antibodies, adverse effects and quality of life in patients with inflammatory bowel disease in remission on maintenance treatment. J Crohns Colitis2015;9:973–81.
- 5. Knowles SR, Graff LA, Wilding H, Hewitt C, Keefer L, Mikocka-Walus A. Quality of life in inflammatory bowel disease: a systematic review and meta-analyses-part I. Inflamm Bowel Dis2018;24:742–51.
- 6. Knowles SR, Keefer L, Wilding H, Hewitt C, Graff LA, Mikocka-Walus A. Quality of life in inflammatory bowel disease: a systematic review and meta-analyses-part II. Inflamm Bowel Dis2018;24:966–76.
- 7. Turner D, Ricciuto A, Lewis A, et al; International Organization for the Study of IBD. Stride-II: an update on the selecting therapeutic targets in inflammatory bowel disease (STRIDE) initiative of the International Organization for the Study of IBD (IOIBD): determining therapeutic goals for treat-to-target strategies in IBD. Gastroenterology2021;160:1570–1583.
- 8. Pouillon L, Lamoureux A, Pineton de Chambrun G, et al. Dose de-escalation to adalimumab 40 mg every three weeks in patients with inflammatory bowel disease—a multicenter, retrospective, observational study. Dig Liver Dis2019;51:236–41.
- 9. Pouillon L, Bossuyt P, Peyrin-Biroulet L. Considerations, challenges and future of anti-TNF therapy in treating inflammatory bowel disease. Expert Opin Biol Ther2016;16:1277–90.
- 10. van Linschoten RCA, Visser E, Niehot CD, et al. Systematic review: societal cost of illness of inflammatory bowel disease is increasing due to biologics and varies between continents. Aliment Pharmacol Ther2021;54:234–48.
- 11. Pauwels RWM, van der Woude CJ, Nieboer D, et al. Prediction of relapse after anti-tumor necrosis factor cessation in Crohn’s disease: individual participant data meta-analysis of 1317 patients from 14 studies. Clin Gastroenterol Hepatol2021.
- 12. Pariente B, Laharie D. Review article: why, when and how to de-escalate therapy in inflammatory bowel diseases. Aliment Pharmacol Ther2014;40:338–53.
- 13. Kievit W, van Herwaarden N, van den Hoogen FH, et al. Disease activity-guided dose optimisation of adalimumab and etanercept is a cost-effective strategy compared with non-tapering tight control rheumatoid arthritis care: analyses of the dress study. Ann Rheum Dis2016;75:1939–44.
- 14. Atalay S, van den Reek J, Otero ME, et al. Health economic consequences of a tightly controlled dose reduction strategy for adalimumab, etanercept and ustekinumab compared with standard psoriasis care: a cost-utility analysis of the condor study. Acta Derm Venereol2020;100:adv00340.
- 15. van Linschoten RCA, Jansen FM, Pauwels RWM, et al; Dutch Initiative on Crohn and Colitis. Increased versus conventional adalimumab dose interval for patients with Crohn’s disease in stable remission (LADI): a pragmatic, open-label, non-inferiority, randomised controlled trial. Lancet Gastroenterol Hepatol2023.
- 16. Smits LJT, Pauwels RWM, Kievit W, et al; LADI study group. Lengthening adalimumab dosing interval in quiescent Crohn’s disease patients: protocol for the pragmatic randomised non-inferiority LADI study. BMJ Open2020;10:e035326.
- 17. Versteegh MM, Vermeulen KM, Evers SMAA, de Wit GA, Prenger R, Stolk EA. Dutch tariff for the five-level version of EQ-5D. Value Health2016;19:343–52.
- 18. iMTA Productivity and Health Research Group. Handling IMTA medical cost questionnaire (IMCQ)http://www.imta.nl. 2018.
- 19. Hakkaart-van Roijen L, Van der Linden N, Bouwmans C, Kanters T, Tan SS. Kostenhandleiding. Methodologie van kostenonderzoek en referentieprijzen voor economische evaluaties in de gezondheidszorg. Zorginstituut Nederland, 2015.
- 20. National Health Care Institute. Medicijnkosten. https://www.medicijnkosten.nl/ Accessed June 18, 2019.
- 21. CZ. Tarieven medisch specialistische zorg per 1 januari 2022. https://www.cz.nl/-/media/2022/voorwaarden/gemiddeld-ongewogen-gecontracteerde-tarieven-msz.pdf?revid=c01bd1eb-8f58-484c-a1ad-17b384e1e0dd Accessed October 4, 2022.
- 22. Centraal Bureau voor Statistiek. Consumentenprijzen; prijsindex 2015=100. https://opendata.cbs.nl/statline#/CBS/nl/dataset/83131NED/table?ts=1649249699079 Accessed April 20, 2022.
- 23. Bouwmans C, Krol M, Severens H, Koopmanschap M, Brouwer W, Hakkaart-van Roijen L. The IMTA productivity cost questionnaire: a standardized instrument for measuring and valuing health-related productivity losses. Value Health2015;18:753–8.
- 24. Koopmanschap MA, Rutten FF, van Ineveld BM, Van Roijen L. The friction cost method for measuring indirect costs of disease. J Health Econ1995;14:171–89.
- 25. Centraal Bureau voor Statistiek. Prijs van arbeid; index 2015=100; nationale rekeningen. https://opendata.cbs.nl/#/CBS/nl/dataset/84183NED/table Accessed April 20, 2022.
- 26. Efron B, Narasimhan B. The automatic construction of bootstrap confidence intervals. J Comput Graph Stat2020;29:608–19.
- 27. Drummond MF, Sculpher MJ, Claxton K, Stoddart GL, Torrance GW. Methods for the Economic Evaluation of Health Care Programmes. Oxford: Oxford University Press; 2015.
- 28. Zorginstituut Nederland. Ziektelast in de praktijk. De theorie en praktijk van het berekenen van ziektelast bij pakketbeoordelingen. 2018.
- 29. McCabe C, Claxton K, Culyer AJ. The nice cost-effectiveness threshold: What it is and what that means. PharmacoEcon2008;26:733–44.
- 30. Krol M, Brouwer W, Rutten F. Productivity costs in economic evaluations: past, present, future. PharmacoEcon2013;31:537–49.
- 31. Byford S, Raftery J. Perspectives in economic evaluation. BMJ1998;316:1529–30.
- 32. Moorkens E, Godman B, Huys I, et al. The expiry of HumiraR market exclusivity and the entry of adalimumab biosimilars in Rurope: an overview of pricing and national policy measures. Front Pharmacol2020;11:591134.
- 33. Henry EB, Barry LE, Hobbins AP, McClure NS, O’Neill C. Estimation of an instrument-defined minimally important difference in EQ-5D-5L index scores based on scoring algorithms derived using the EQ-VT version 2 valuation protocols. Value Health2020;23:936–44.
- 34. McClure NS, Sayah FA, Xie F, Luo N, Johnson JA. Instrument-defined estimates of the minimally important difference for EQ-5D-5L index scores. Value Health2017;20:644–50.
- 35. van der Valk ME, Mangen M-JJ, Leenders M, et al; COIN study group and the Dutch Initiative on Crohn and Colitis. Healthcare costs of inflammatory bowel disease have shifted from hospitalisation and surgery towards anti-TNFα therapy: results from the COIN study. Gut2014;63:72–9.
- 36. Zorginstituut Nederland. Medicijnkosten: Imraldi 40 injvlst 50mg/ml pen 0,8ml. https://www.medicijnkosten.nl/medicijn?artikel=IMRALDI±40±INJVLST±50MG%2FML±PEN±0%2C8ML&id=613f895692646a9cf795f98dfb9f8488 Accessed May 3, 2022.
- 37. Versteegh MM, Ramos IC, Buyukkaramikli NC, Ansaripour A, Reckers-Droog VT, Brouwer WBF. Severity-adjusted probability of being cost effective. PharmacoEcon2019;37:1155–63.
- 38. Martin-Fernandez J, Lopez-Nicolas A, Oliva-Moreno J, Medina-Palomino H, Polentinos-Castro E, Ariza-Cardiel G. Risk aversion, trust in institutions and contingent valuation of healthcare services: trying to explain the WTA-WTP gap in the Dutch population. Cost Eff Resour Alloc2021;19:27.
- 39. Drugs.com. Humira prices, coupons and patient assistance programs. https://www.drugs.com/price-guide/humiraAccessed August 24, 2022.