Arterial hypertension can be regarded as a global epidemic with an estimated worldwide prevalence varying from 25% to 50%, according to the region, population age, and definition criteria used (). Being one of the major cardiovascular risk factors, adequate management and control are relevant to reduce cardiovascular complications and related deaths. However, even though disease awareness has risen and distinct treatment options exist, the global control rate of arterial hypertension is still not satisfactory (). To improve this situation, individualized approaches are required to target therapeutic strategies and to identify potential curative forms of hypertension to avoid the necessity of a lifetime treatment.
Among secondary forms of hypertension, those caused by hormonal diseases are among the most challenging to diagnose and require specific expertise. The prevalence of endocrine forms of hypertension (EHT), with a focus on primary hyperaldosteronism (PA), hormonally active pheochromocytoma/paraganglioma (PPGL), and Cushing syndrome (CS), is difficult to estimate. The most common form of EHT is PA, with prevalence varying between 3.2% and 21.9% of screened populations while the other causes (PPGL, CS) are rarer with prevalence <1% (). Even though the combined prevalence indicates a relatively common condition, screening for EHT is not routinely performed in primary care. As exemplified by PA, EHT remains largely unrecognized, even though the timely diagnosis and treatment have been proven to be cost-effective and of benefit for patients (, ).
In addition to the lack of awareness for EHT, another reason that hampers the implementation of widespread screening approaches is based on the lack of resources. Considering the current recommendations, 50% of patients with arterial hypertension would be eligible for screening (, ), a number of patients that widely exceeds the available number of experts in this field. Therefore, it is important to focus on new strategies of preselecting patients for further referral to experts, for example by developing new prescreening tools and methods.
In the current study, we aimed to investigate the potential use of targeted metabolomics in discriminating primary hypertension (PHT) from EHT. Metabolomic profiling is a relatively new strategy for the parallel and high-throughput identification and quantification of dozens to hundreds of low molecular weight molecules (metabolites). By definition, a targeted metabolomics approach is restricted to a lower number of previously identified metabolites with known chemical structures (). Advantages of targeted metabolomics include the better interlaboratory reproducibility of assays and, thus, the potential swift application in diagnostic algorithms (). In fact, targeted metabolomics have been successfully used to investigate numerous disorders, and have provided promising results in profiling distinct cardiovascular diseases (), as well as endocrine conditions associated with secondary hypertension including CS and PPGL (, ). Therefore, we hypothesize that metabolite profiles of PHT and EHT might be useful tools in discriminating the 2 clinical entities and help in preselecting patients for further analysis.
Materials and Methods
Patient selection
Patient data and suitable plasma specimens following overnight fasting were available from patients from 11 centers of the ENSAT-HT consortium (http://www.ensat-ht.eu). All centers followed a standardized operating procedure for blood withdrawal usage of heparinized (lithium) tubes and plasma storing at –80°C prior shipment and analysis. Patients aged 18 to 75 years were included if diagnosed with PHT or EHT, in specific PA (including aldosterone-producing adenoma and bilateral adrenal hyperplasia), hormonally active PPGL, and CS (adrenal and pituitary). The diagnosis (PHT, PA, PPGL) was made according to the current guidelines for screening and management of the specific diseases (, , ). The diagnosis of PHT also required the exclusion of EHT and other secondary causes (renal disease, pharmacological cause, and obstructive sleep apnea syndrome) as well as the exclusion of patients with low-renin hypertension. Patients with unclear diagnosis, pregnancy, severe comorbidities (eg, heart failure, chronic kidney disease, active malignancy) were also excluded from the study. All patients provided written consent to participate in the study according to the protocol approved by the ethics committee of each participating center.
Targeted metabolomics
The targeted metabolomics approach was based on liquid chromatography-electrospray ionization-tandem mass spectrometry (LC-ESI-MS/MS) and flow injection analysis–electrospray ionization–tandem mass spectrometry (FIA-ESI-MS/MS) measurements by using the AbsoluteIDQTM p180 Kit (BIOCRATES Life Sciences AG, Innsbruck, Austria). The assay allows simultaneous quantification of 188 metabolites in 10 µL of plasma. Details on accessible metabolites are given elsewhere (Table 1 ()). The assay procedures of the AbsoluteIDQTM p180 Kit, as well as the metabolite nomenclature, have been described in detail previously (, ). The method of AbsoluteIDQTM p180 Kit has been proven to conform to the European Medicines Agency (EMEA) guideline “Guideline on bioanalytical method validation” (July 21, 2011) (), which implies proof of reproducibility within a given error range. Sample handling was performed by a Hamilton Microlab STAR™ robot (Hamilton Bonaduz AG, Bonaduz, Switzerland) and an Ultravap nitrogen evaporator (Porvair Sciences, Leatherhead, UK), and standard laboratory equipment. Mass spectrometric analyses were done on an API 4000 triple quadrupole system (Sciex Deutschland GmbH, Darmstadt, Germany) equipped with a 1200 Series HPLC (Agilent Technologies Deutschland GmbH, Böblingen, Germany) and an HTC PAL autosampler (CTC Analytics, Zwingen, Switzerland) controlled by Analyst 1.6.2 software. Data evaluation for quantification of metabolite concentrations and quality assessment was performed with the MultiQuant 3.0.1 (Sciex) and the MetIDQ™ software package. Metabolite concentrations were calculated using internal standards and reported in µM. We included all metabolite measurements with peaks above the limit of detection, defined as 3 times the values of the 0 samples, as well as those below this threshold if the metabolite peak concentration was clearly detectable visually by the technician. To ensure the comparability of received data between batches, each metabolite value was normalized by measurement of 5 aliquots of a pooled reference plasma (RP) with each batch as previously described (, ).
Data analysis
Metabolite data selection, missing data estimation, outlier detection
Metabolites for which measurement values were valid in less than 3 of 5 RP were excluded from normalization and further statistical analysis. We further excluded metabolites for which the coefficient of variance of RP was >25% within and between batches (exceptions included 8 metabolites for which only the variance between batches, but not within, were only slightly above the predetermined cutoff prior normalization) and those metabolites for which values were not detectable in >40% of samples. From 188 metabolites, 155 passed these selection criteria. In addition to the 155 eligible metabolites, 18 predefined metabolite sums and ratios were eligible for further analyses. The complete list of metabolites is provided in ().
The missing values of the metabolites with <40% of undetectable data were estimated using the k-nearest neighbors (KNN) method (), considering each subgroup of clinical conditions separately. Using the heatmap analysis method we identified potential outliers among the studied patients, and those patients were excluded from the statistical analysis. The missing data estimation and outlier detection were performed using the MetaboAnalyst platform ().
Patient characteristics
For baseline characteristics, a comparison was performed with the Pearson chi-squared test for categorical variables and the t-test for normally and Mann–Whitney U test and Kruskal–Wallis test for non-normally distributed numerical variables, according to the Kolomogorov–Smirnov and Shapiro–Wilk tests (age in the PPGL subgroup was non-normally distributed). The homogeneity of variances of the metabolites between analyzed groups was tested using Levene’s test. Analyses were performed using SPSS® Statistics v25.0 (IBM).
Metabolite differences between groups and their discrimination ability
We followed 2 separate approaches to identify relevant metabolites discriminating the different groups of patients according to their clinical diagnosis and tested their ability to predict EHT (Fig. 1). These were phrased as the “classical approach” (CA) and the “machine-learning approach” (MLA). By separately performing distinct techniques we aim to evaluate the best prominent discriminating features.
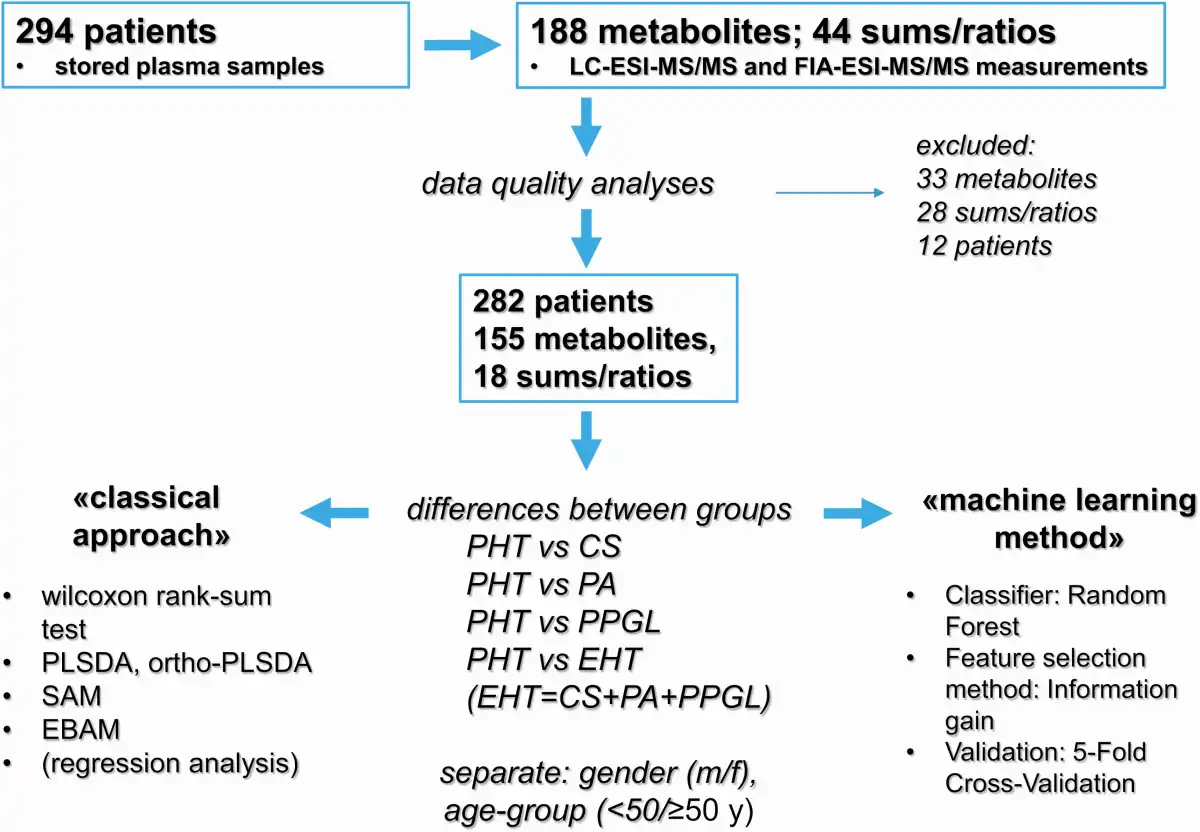
Figure 1
Schematic workflow of the study design.
Classical approach
In a first step, we investigated differences between PHT and each subtype of EHT (CS, PA, PPGL) separately and in a second step between PHT and EHT as a common group. We arbitrarily defined “metabolites of interest” as those metabolites, which were found to be significantly different in at least 2 of the applied statistical analyses as described previously (). Prior to the analyses, metabolites values were transformed using the generalized logarithm method (). To test the difference between groups we performed a series of univariate (Wilcoxon rank-sum test) and multivariate (partial least square discriminant analysis [PLSDA] and orthogonal [ortho] PLSDA, significant analysis of microarray/metabolites, empirical Bayesian analysis of microarray/metabolites) analyses, using the MetaboAnalyst platform (). The metabolite difference was defined as statistically significant if P ≤ .05 after correction for multiple testing, according to the method specific for the test (ie, false discovery rate method for Wilcoxon rank-sum test and empirical Bayesian analysis of microarray/metabolites and q-value for significant analysis of microarray/metabolites). The results of PLSDA and orthoPLSDA were only considered if having good prediction results after internal model validation (10-fold cross-validation for PLSDA and permutation for orthoPLSDA); in that case, the significant metabolites were selected according to the variable importance in projection score for PLSDA and S-plot (in particular covariance value) for orthoPLS-DA after visual interpretation of the plot. We performed all these analyses considering all patients, as well as considering separately male and female patients and patients with age <50 and ≥50 years, due to the known difference of studied metabolites between sexes and age groups (, ). Considering the unequal distribution of the patients according to sex and age within the different groups, we subsequently performed a regression analysis for each identified “metabolite of interest” including sex (female versus male) and age (<50 years versus ≥50 years).
In addition, we performed the same analysis approach separately for selected metabolite ratios and metabolite sums as provided by the MetIDQ™ RatioExplorer. (BIOCRATES Life Sciences®).
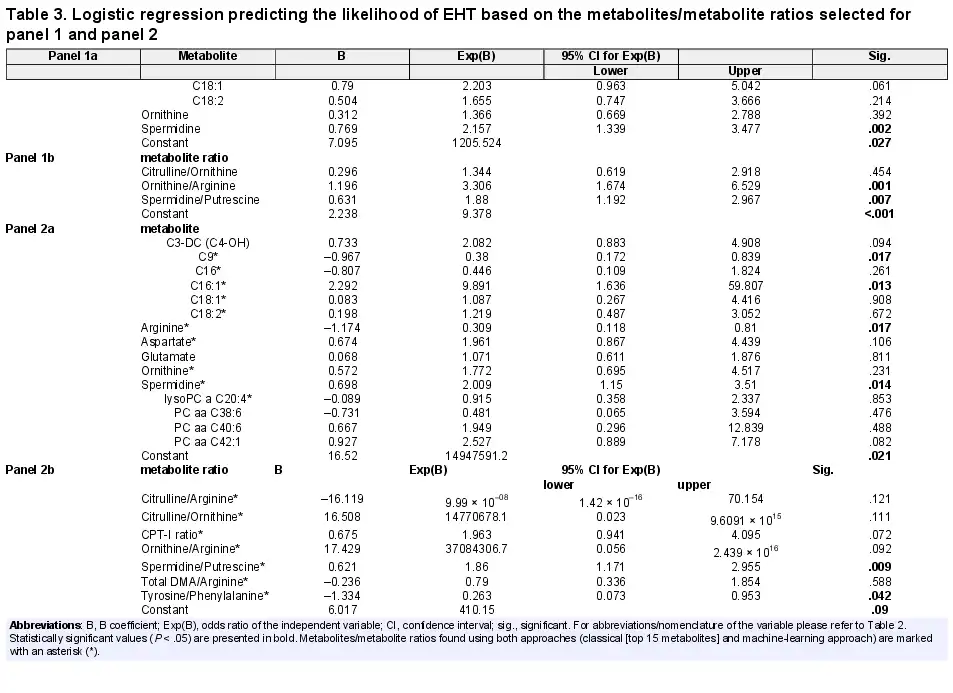
To test the ability to predict EHT, we selected the common “metabolites of interest” and “metabolite ratios of interest”, which were identified in the comparison of CS, PA, and PPGL from PHT, respectively (panel 1), as well as the “metabolites/metabolite ratios of interest” identified from the EHT–PHT comparison (panel 2). For the latter, we selected the top 15 metabolites, according to the strength of their relation to the clinical entity from the regression analysis (see above). Using the selected metabolites we performed an additional binomial logistic regression analysis. For both panels, probabilities for the presence of EHT were calculated for each patient and the discriminating performance of both panel was evaluated by building a receiver operating characteristic (ROC) curve (). The analysis was performed using the SPSS® Statistics v25.0 software.
Machine learning approach
The metabolites and metabolite ratios datasets were used separately for classification of different disease combinations, namely PA-PHT, PPGL-PHT, CS-PHT, and EHT-PHT. A feature selection method, Information Gain (), was used to identify the most significant features for a given phenotypic classification. It is an entropy-based filter method which ranks the features with high information in decreasing order (in the context of a target variable). The top features were empirically selected and employed for supervised model training. The same process was repeated for the metabolite ratios dataset. The feature selection and classification were performed for distinct subgroups such as using all samples, only male samples, only female samples, patient age ≥50 vs <50 years age samples to find the most discriminating metabolites and metabolite ratios (see above).
A random forest classifier was used for classification (). The algorithm used 5-fold cross-validation where the original dataset was randomly partitioned into 5 subsets and a single subset was retained as the validation data for testing the model, and the remaining 4 subsets were used as training data. The cross-validation process was repeated 5 times with each of the 5 subsets used exactly once as the validation data. The results from the validation folds were then averaged to produce a single estimation (). The classification results were analyzed for accuracy, area under ROC curve (AUC), F1 score, precision, recall (sensitivity), specificity, and confusion matrix. The classification was implemented using the Orange software ().
Results
Patient characteristics
In total, 294 patients were included in the study. After the exclusion of outliers, 282 patients were available for further analysis. Their demographic and clinical data are summarized in Table 1 and Fig. 2. Considering the different clinical entities there was a significant difference in the distribution of patients according to sex, with a particular predominance of female patients with CS (P < .001) and male patients with PHT (P = .001). The mean age of the patients was 49 years (95% CI 47.5-50.6 years), with no significant difference between female (mean 49.8 years, 95% CI 47.8-51.9 years) and male (mean 48.1 years, 95% CI 45.8-50.4 years) patients (P = .66). However, the medians of age were significantly different across the clinical subgroups, even if considering EHT as a common group (P = .009). Considering the distribution of the patients according to age cut-off of 50 years, there was no significant difference between the PHT and EHT group.
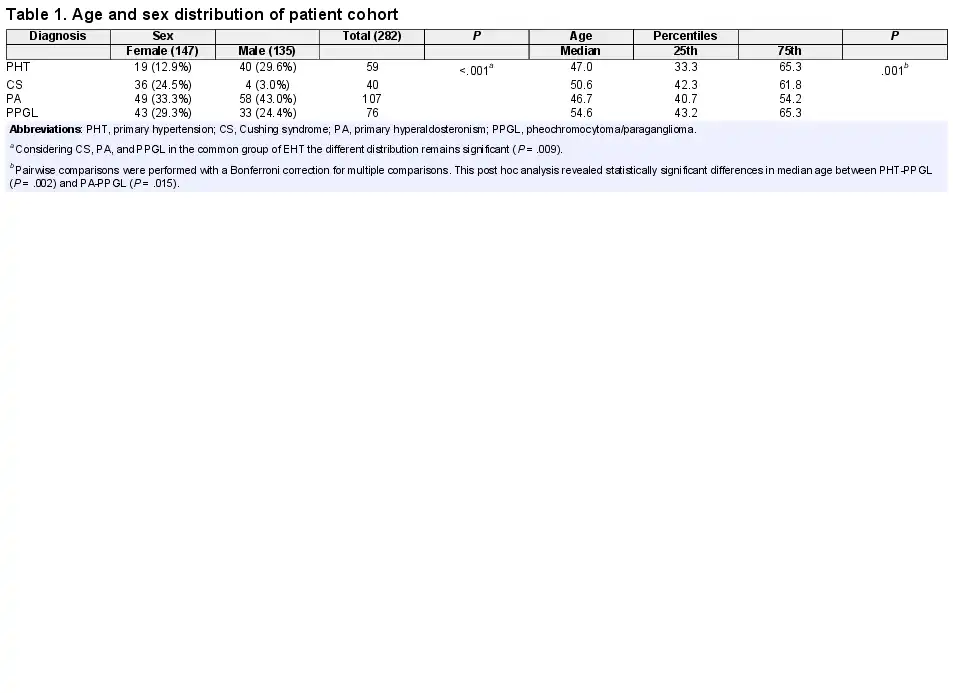
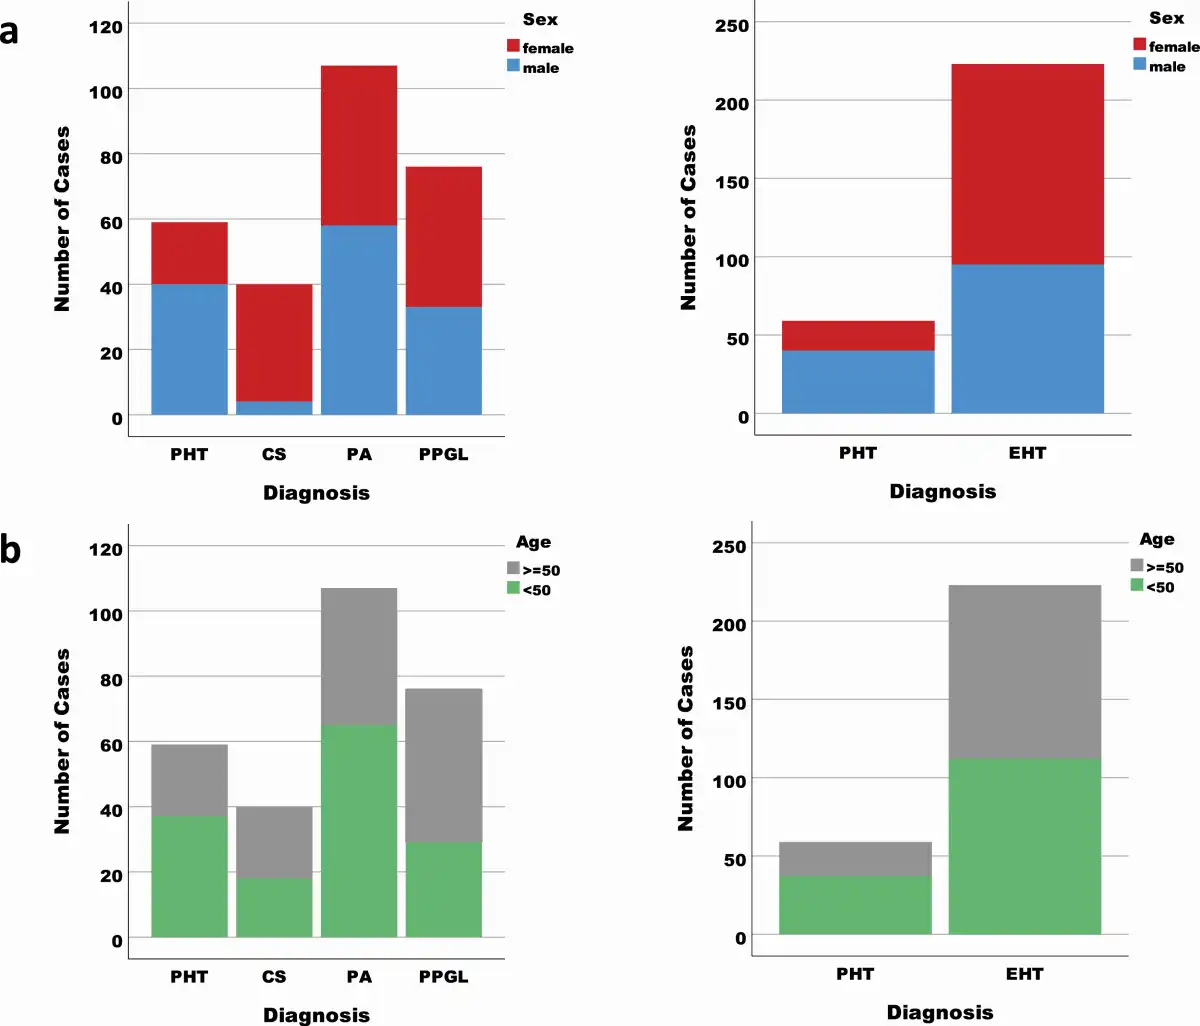
Figure 2
Distribution of patients according to the clinical diagnosis and sex (A) and age group <50 versus ≥50 years (B). On the left are represented all clinical subgroups separately (PHT, CS, PA, PPGL) and on the right the endocrine forms (CS, PA, PPGL) as a common group of endocrine hypertension (EHT).
Metabolite differences between groups—classical approach
For each comparison performed, all the results of the single statistical tests performed are represented in elsewhere (Table 2.1 ()).
By comparing patients with PHT and CS, a total of 40 metabolites and 6 metabolite ratios of interest (ie, with a significant difference in at least 2 statistical tests performed) could be identified (summarized in Table 2.2 ()). After considering sex and age group (<50/≥50 years) in a regression model only 24 metabolites and 4 metabolite ratios of interest continued to have a significant association with the clinical diagnosis (Table 2 and Table 2.2 ()). For the comparison between PHT and PA, 37 metabolites and 10 metabolite ratios of interest were identified, of which 35 metabolites and 7 metabolite ratios had a significant association with the clinical diagnosis after controlling for sex and age group (Table 2 and Table 2.3 ()). Between PHT and PPGL, 29 metabolites and 9 metabolite ratios of interest were found, and 25 metabolites and 8 metabolite ratios of interest had a persistent significant association with the clinical diagnosis after considering sex and age group (Table 2 and Table 2.4 ()).
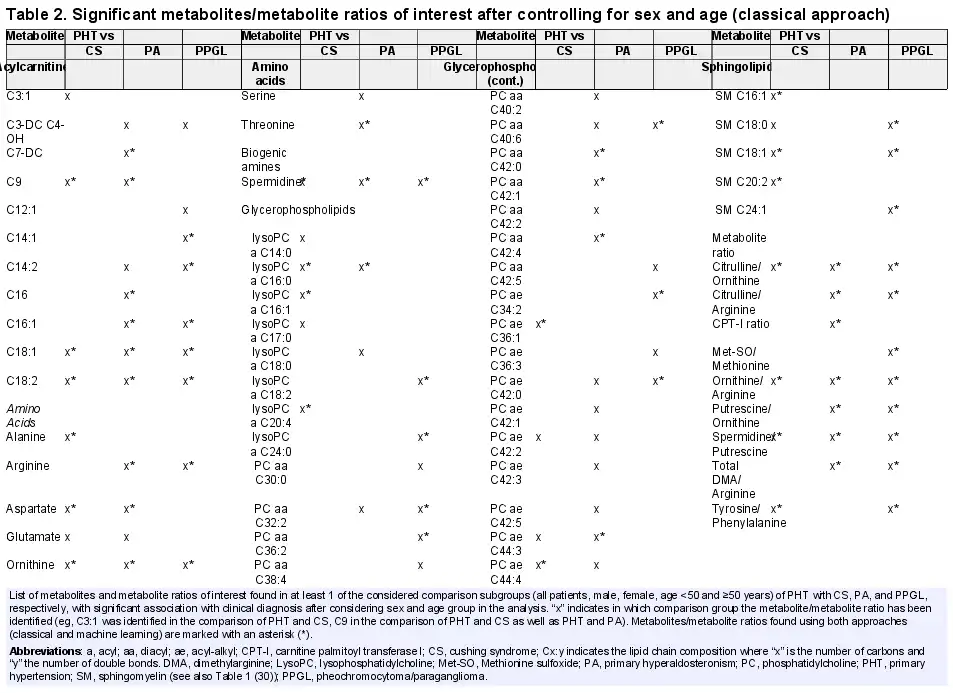
Considering the results of the comparison of PHT with each EHT subgroup separately, 4 metabolites of interest (C18:1, C18:2, spermidine and ornithine) and 3 metabolite ratios of interest (citrulline/ornithine, ornithine/arginine, and spermidine/putrescine) were common in discriminating between PHT and CS, PA and PPGL, respectively (Fig. 3).
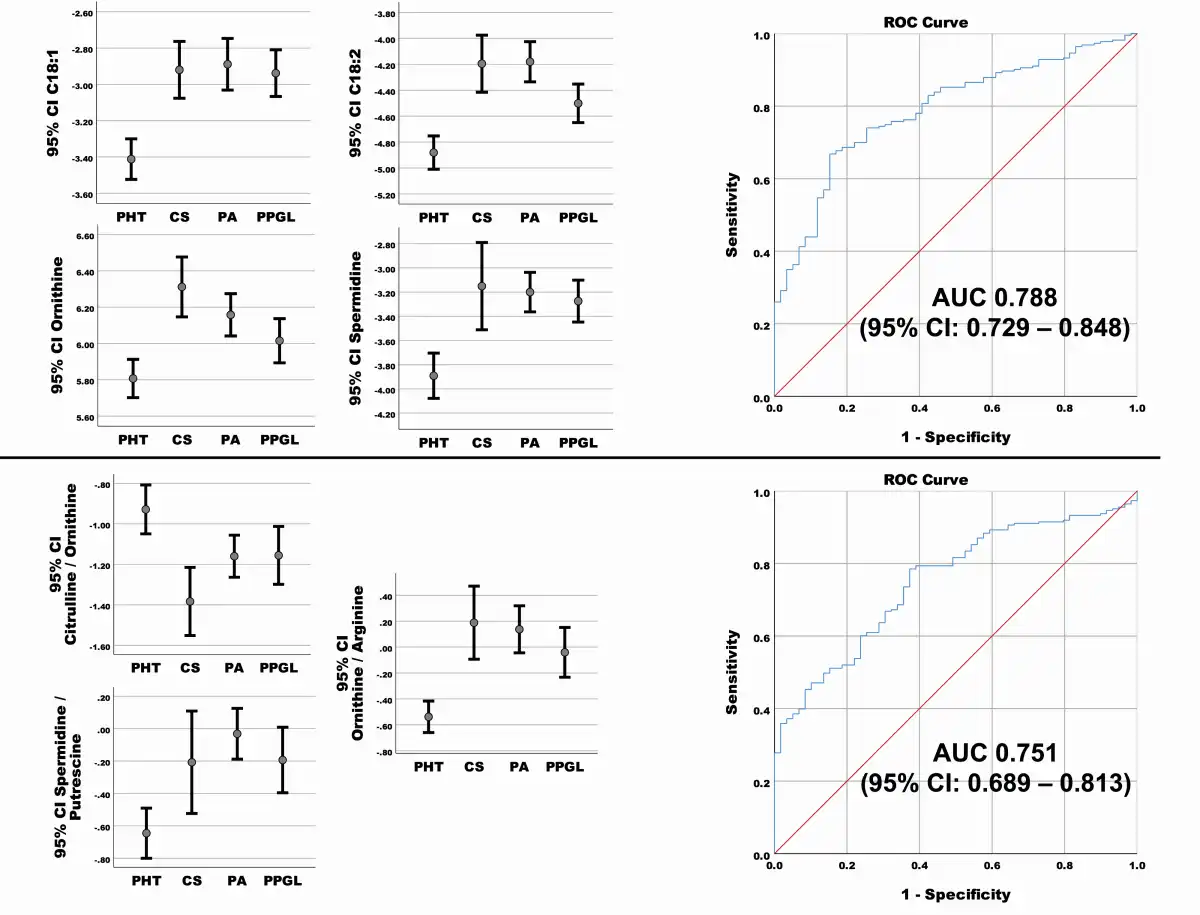
Figure 3
On the left side concentrations (after generalized logarithmic transformation) of the significant common metabolites of interest (above) and metabolite ratios (below) found in the comparison of PHT with CS, PA and PPGL respectively, after controlling for sex and age group. Medium value with 95% CI of the after generalized logarithmic transformation is represented for each clinical diagnosis group. Except for Citrulline/Ornithine ratio, the values were lower in the PHT patients. On the right side respective ROC Curve for discrimination between PHT and EHT for panel 1 (metabolites [above] and metabolite ratio [below]) are depicted. The sensitivity (y-axis) and 1-Specificity (x-axis) for different cut-offs for the predicted probabilities of having EHT are represented. The area under the curve (AUC) with the 95% confidence interval (CI) is represented for each ROC curve.
After performing the statistical analysis considering all endocrine hypertension diagnosis (CS, PA, PPGL) as a common group (EHT) in comparison with PHT, 38 metabolites of interest and 9 metabolite ratios of interest were identified. After including sex and age group in the regression model, 31 metabolites and 7 metabolite ratio of interest had a significant association with the clinical diagnosis (Table 2.5 and Fig. 4.1–4.2 ()). Arbitrarily, we selected the top 15 metabolites for analysis of the diagnostic performance, according to the strength of their relation to the clinical diagnosis (Fig. 4).
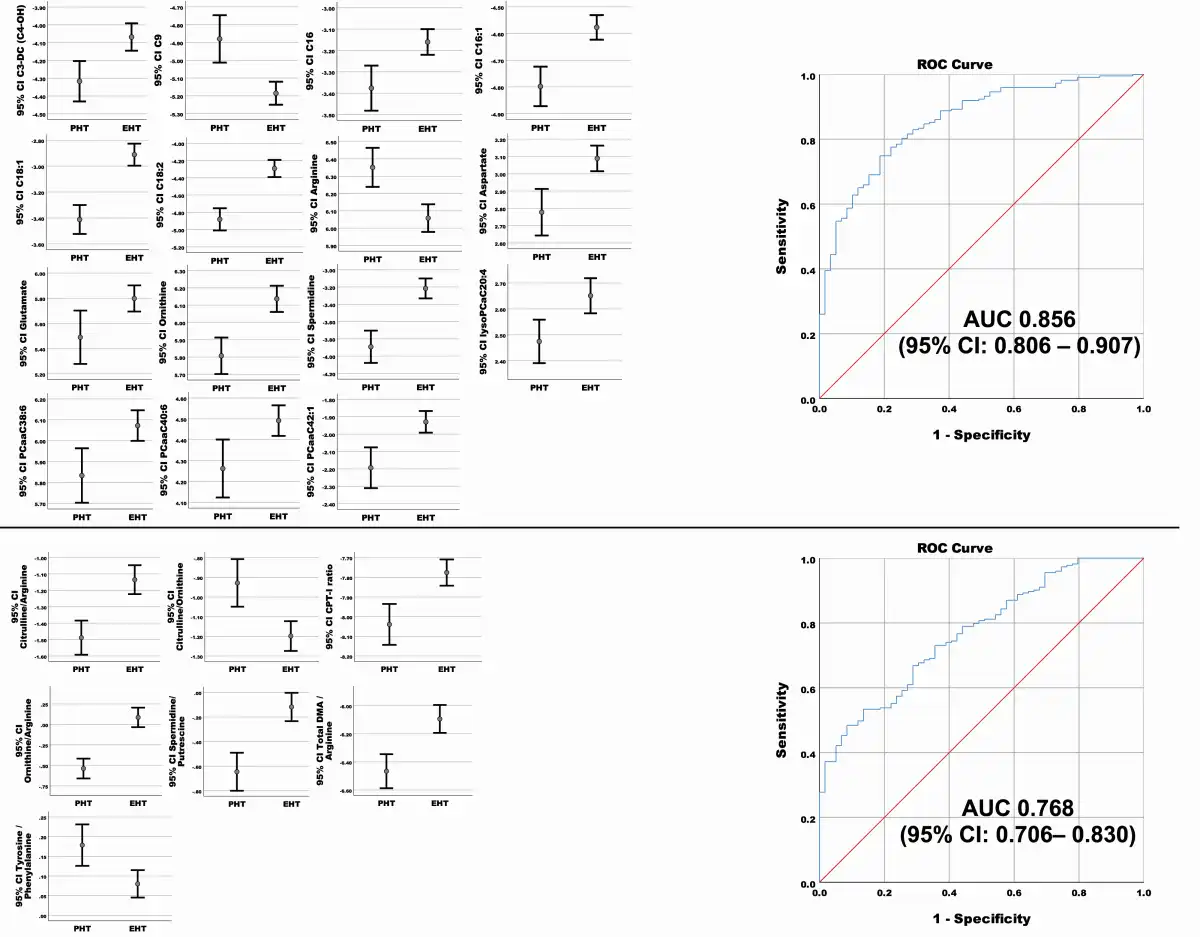
Figure 4
On the left side concentrations (after generalized logarithmic transformation) of the top 15 significant common metabolites (above) and metabolite ratios (below) of interest found in the comparison of PHT with EHT as common group, after controlling for sex and age group. Medium value with 95% CI of the metabolites (A) and metabolite ratio (B) concentration (after generalized logarithmic transformation) is represented for both groups. On the right side ROC Curve for discrimination between PHT and EHT for panel 2 (metabolites [upper panel] and metabolite ratio [lower panel]) are depicted. The sensitivity (y-axis) and 1-Specificity (x-axis) for different cut-offs for the predicted probabilities of having EHT are represented. The area under the curve (AUC) with the 95% CI is represented for each ROC curve.
Discrimination ability of the identified metabolites of interest
We tested the diagnostic performance of the 4 common metabolites of interest (Table 3, panel 1a) and 3 metabolite ratios (Table 3, panel 1b) identified from the comparison between PHT with CS, PA, and PPGL. Likewise, we investigated the performance of the top 15 metabolites (Table 3, panel 2a) and 7 metabolite ratios (Table 3, panel 2b) from the comparison of PHT and EHT for discriminating between PHT and EHT (Table 3 and Fig. 3 [panel 1] and Fig. 4 [panel 2]). All performed regression analyses were found to be statistically significant (P < .001). Considering the ROC curve results, for each of the 2 panels, the performance was better for the single metabolites (Figs. 3 and 4 top) than for the metabolite ratios (Figs. 3 and 4 bottom). The best performance was achieved by the metabolites from panel 2 (AUC 0.856, 95% CI 0.806-0.907).
Metabolite differences between groups—machine-learning approach
A list of metabolites and metabolite ratios were found as important for identifying different forms of endocrine hypertension (CS, PA, PPGL) from PHT (Table 4). A total of 28 metabolites and 10 metabolite ratios distinguished PHT from CS. For PHT-PA, again 28 metabolites and 12 ratios were seen as key identifiers and 36 metabolites and 15 ratios were seen important in identifying PHT-PPGL. It was observed that 9 metabolites (C9, C18:1, C18:2, aspartate, ornithine, spermidine, lysoPC a C20:4, lysoPC a C24:0, SMC18:1) and 7 ratios (citrulline/arginine, citrulline/ornithine, ornithine/arginine, putrescine/ornithine, spermidine/putrescine, total DMA/arginine, tyrosine/phenylalanine) were common in classification of CS, PA, and PPGL from PHT.
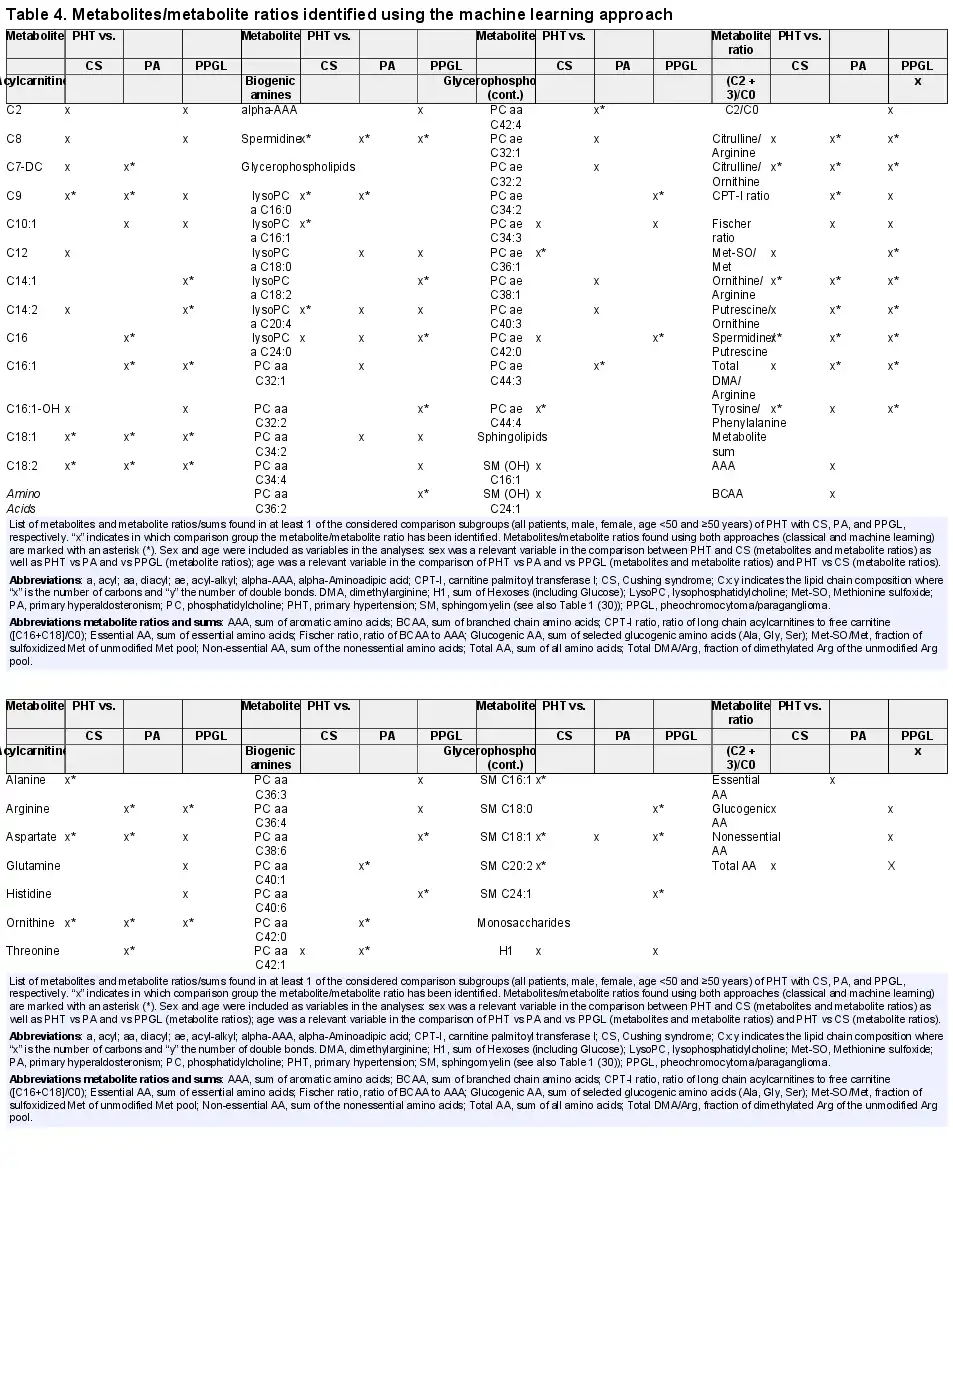
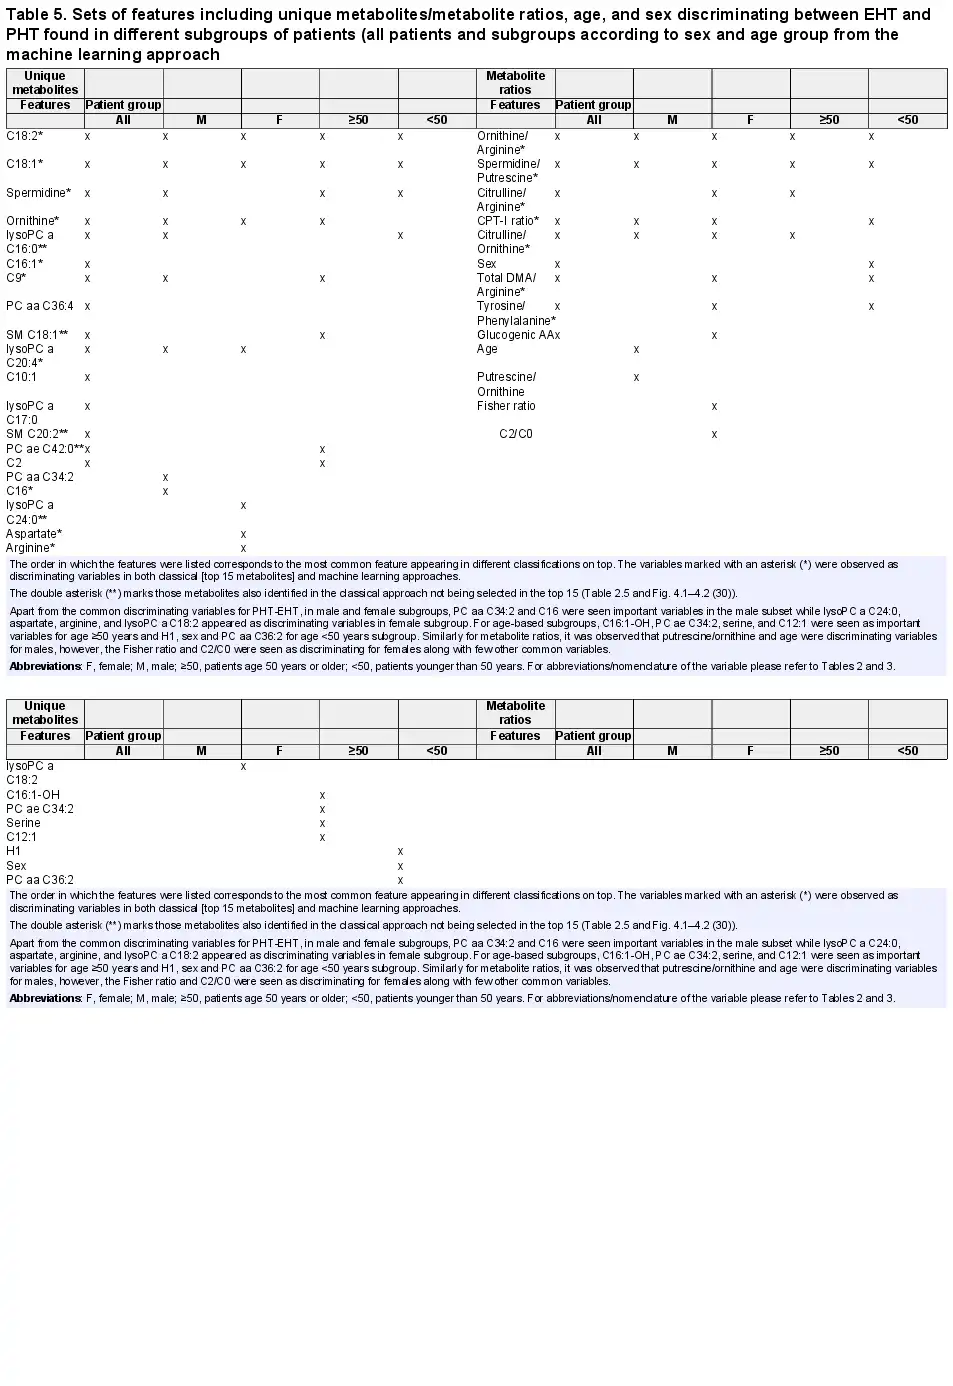
A further set of variables were used for classifying different subgroups of patients for PHT-EHT classification (Table 5 and Figs. 4.1 and 4.2 ()). From the most common classification variables it was found that C18:2 and C18:1 were most prominently used metabolites while ornithine/arginine and spermidine/putrescine were seen as the most prominent metabolite ratios for classifying different patient groups, such as using all patients, male subset, female subset, age ≥50 and <50 years.
The diagnostic performance for PHT-EHT disease classification for metabolites and metabolite ratios was calculated using the confusion matrices (Fig. 5). Following this approach, a total of 208 EHT and 19 PHT patients were correctly classified, while 15 EHT were incorrectly classified as PHT and 40 PHT were misclassified as EHT when metabolites were used for classification (Fig. 5 left). Similarly, in the right panel of Fig. 5, 205 EHT and 13 PHT were correctly classified while 18 EHT and 46 PHT were misclassified when only metabolite ratios were used for classification. The percentage AUC was 83, recall (sensitivity) 80, and specificity 45 for metabolites, and 74, 77, and 37 for metabolite ratios, respectively. The random forest classification accuracy when using metabolites and metabolite ratios were 80% and 77%, respectively. The other subgroup analyses results are available elsewhere (Fig. 3.3a–d ()).
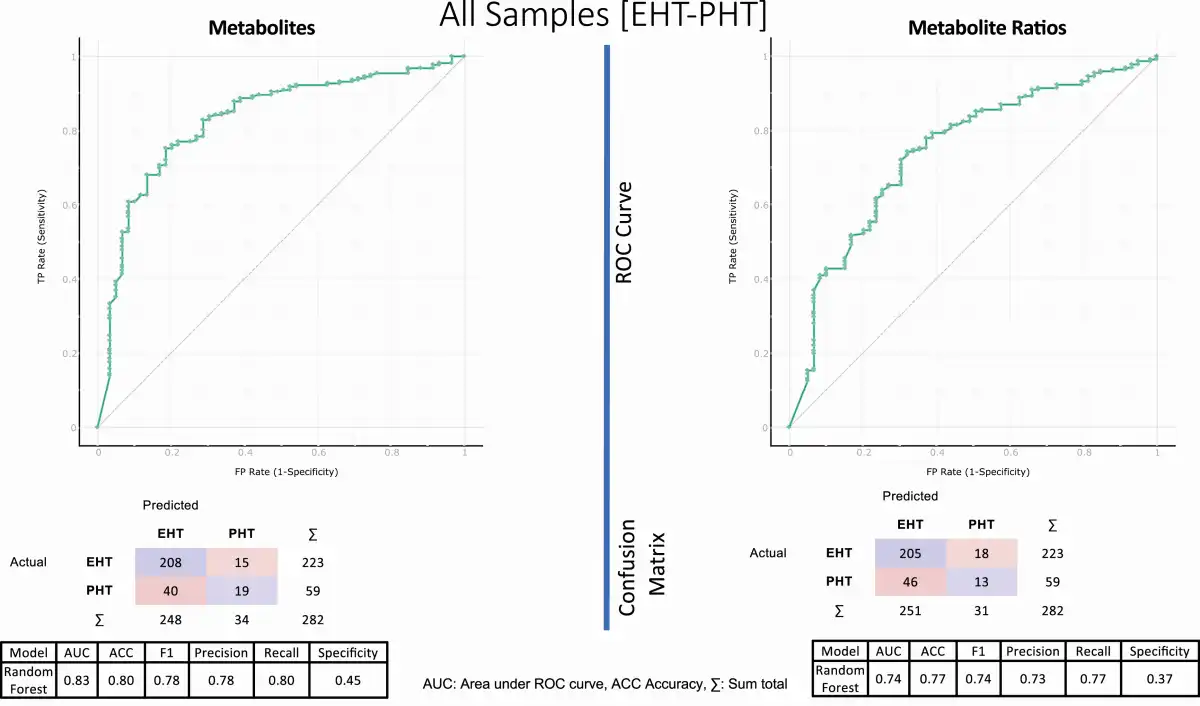
Figure 5
Discriminating potential of the features (metabolites on the left and metabolite sums/ratio on the right) identified by machine learning approach and their diagnostic performance. On the top, the ROC curve is represented, and in the middle the confusion matrices showing actual and predicted number of samples as result of classification using metabolites and metabolites sums/ratios for PHT-EHT disease combination using all samples. On the bottom, the performances are represented (for details see “Results”). The confusion matrices show the actual and predicted number of patients after 5-cross-validation classification.
Common discriminators identified by the 2 approaches
From the comparison between PHT and CS, 15 metabolites (C9, C18:1, C18:2, alanine, aspartate, ornithine, spermidine, lysoPC a C16:0, lysoPC a C16:1, lysoPC a C20:4, PC ae C36:1, PC ae C44:4, SM C16:1, SM C18:1, SM C20:2) were found in both approaches, representing 62.5% of metabolites identified by CA and 53.6% of metabolites identified by the MLA. Similarly, 17 metabolites (48.6% of identified metabolites from CA and 60.7% of metabolites identified by MLA) from the PHT-PA (C7-DC, C9, C16, C16:1, C18:1, C18:2, arginine, aspartate, ornithine, threonine, spermidine, lysoPC a C16:0, PC aa C40:1, PC aa C42:0, PC aa C42:1, PC aa C42:4, PC ae C44:3), as well as 19 metabolites (79% and 52.8% of the metabolites identified by CA and MLA, respectively) from PHT-PPGL comparison (C14:1, C14:2, C16:1, C18:1, C18:2, arginine, ornithine, spermidine, lysoPC a C18:2, lysoPC a C24:0, PC aa C32:2, PC aa C36:2, PC aa C38:6, PC aa C40:6, PC ae C34:2, PC ae C42:0, SM C18:0, SM C18:1, SM C24:1) could be identified using both approaches independently (Tables 2 and 4). In the comparison of PHT with each singular EHT (CS, PA, PPGL) 4 metabolites were repeatedly identified by CA (C18:1, C18:2, ornithine, spermidine), as well as by MLA. Using MLA in addition to these 4 metabolites another 4 metabolites (C9, aspartate, lysoPC a C24:0, SM C18:1) were repeatedly identified in each singular comparison (Tables 2 and 4).
Considering all subgroup analyses, 16 metabolites (C9, C16, C16:1, C18:1, C18:2, arginine, aspartate, glutamate, ornithine, spermidine, lysoPC a C16:0, lysoPC a C20:4, lysoPC a C24:0, PC ae C42:0, SM C18:1, SM C20:2) were discriminating between PHT and EHT using both approaches, representing 66.7% of the top 15 metabolites from CA and 55.6% of the metabolites identified by MLA (Tables 3 and 5, and Table 2.5 ()).
Discussion
In the present study, we provide evidence that targeted metabolomics could aid in the discrimination between PHT and EHT with promising sensitivity and specificity. Identified differences in metabolomic profiles remained significantly independent of the applied statistical approaches including machine learning algorithms. This finding indicates that the analytical method of targeted metabolomics can provide phenotypic patterns of underlying disorders that translates into potential diagnostic utility.
Of all patients with secondary hypertension, endocrine disorders are the most prevalent causes that furthermore carry a high cardiovascular risk burden in comparison with essential hypertension (). The availability of targeted and personalized therapies that also include approaches that can result in complete cure of hypertension is contrasted by the low penetration of screening approaches in larger patient cohorts. Among the reasons for this lack of widespread implementation is that screening procedures often require specialized skills in performance and interpretation of test results. A prescreening tool as part of a diagnostic algorithm could be utilized before further endocrine testing for improved patient identification and contribute towards better disease outcomes. Based on the applied diagnostic and statistical analyses we found a good diagnostic performance with the area under curves of 0.86 and 0.83, respectively. Since the diagnostic performance of the currently recommended selection criteria for EHT screening—such as young age at diagnosis or high grade or resistant hypertension (, , )—is not available, a direct comparison with current approaches is not possible. However, considering only the prevalence of PA, as the most common EHT of up to 23% in patients with uncontrolled hypertension, our preselection approach might be more selective in identifying EHT cases, with a specificity of up to 45% while maintaining a reasonably high sensitivity of 80% (Fig. 5). Considering the prevalence of arterial hypertension of 30% in the general population () and estimating that 10% of arterial hypertension patients are EHT cases (see the introductory section) the positive and negative predictive value of our approach would be 4.3% and 98.6%, respectively. If confirmed in further studies using prospective cohorts and focused on the diagnostic performance and validation of the developed machine learning algorithms, targeted metabolomics could be suitable as a very good rule-out test for EHT. Therefore, by implementing the proposed algorithm in the routine work-up of patients with arterial hypertension, a single fasting blood sampling would allow to restrict further cumbersome tests (such as 24 hour urine collection, midnight cortisol measurements, functional testing) to those with a high probability of EHT. However, because of its design, this approach cannot exclude the presence of other secondary causes of arterial hypertension, such as renovascular disease.
Even though it was not the primary goal of this study, distinct metabolomic patterns in the comparison of PHT with the single entities of EHT (CS, PA, PPGL) were evident. Based on these data, it will be interesting in future studies to test the ability of metabolomics as diagnostic tool to identify a specific EHT entity that would target further baseline or functional tests towards a specific disease. Ideally, this would also decrease the likelihood of pitfalls of undirected diagnostic approaches that are based on comorbidities or medication (, , ).
Beyond diagnostic usage, metabolic approaches can also provide insights into disease-related mechanisms. Distinct metabolic profiles between PHT and individual or combined EHT subgroups could be identified including differences in acylcarnitines, amino acids/biogenic amines, and glycerophospholipids levels. In particular, higher levels of long-chain acylcarnitines (C16, C16:1, C18:1, C18:2) were a consistent finding distinguishing PHT and EHT. This is of particular interest considering the association of these metabolites with cardiovascular complications. In fact, in vitro studies have indicated deleterious effects of higher levels of long-chain acylcarnitines on cardiac tissue, influencing the cardiac electrophysiology and cell contractility (). Similarly, in patient cohort studies, higher levels of long-chain acylcarnitines were found to be associated with heart failure (most pronounced in patients with preserved ejection fraction) and were identified as independent risk factors for cardiovascular mortality in patients with end-stage renal disease starting hemodialysis (, ). Since patients with endocrine forms of hypertension have an increased risk of cardiovascular complications compared to matched PHT controls (), it is tempting to speculate that those metabolic changes might relate to these clinical observations. Furthermore, higher levels of acylcarnitines have been described in patients with insulin resistance and diabetes mellitus (, ), the latter being also related to all 3 EHT forms considered in our study (, , ). Considering the results of our ratio analyses, the CPT-I enzyme activity might play a relevant role in this context.
Other observations common to the different statistical approaches were the distinct profiles of some amino acids/biogenic amines being higher (aspartate, glutamate, ornithine, spermidine) and lower (arginine) in the EHT patients. Arginine is the precursor of biogenic amines like spermidine and its low level with concomitant higher levels of ornithine, a precursor in spermidine synthesis, and spermidine itself points toward activation of the biogenic amine synthesis in patients with EHT (). Higher levels of biogenic amines have been associated with carcinogenesis, inflammation and heart failure (), and in vitro studies describe its deleterious effect in ischemic cardiac cells (). Furthermore, nitric oxide synthesis relies on arginine availability and therefore low arginine levels might cause reduced nitric oxide levels (), which is associated with endothelial dysfunction, considered as an early step in the pathogenesis of atherosclerosis (). These findings might contribute as well to the spectrum of the metabolic changes related to increased cardiovascular risk in patients with EHT (). Besides, the higher levels of aspartate and glutamate might reflect the described effect of hypercortisolism (, ), hyperaldosteronism (, ), and catecholamine excess () on skeletal muscle, with increased protein turnover and degradation. It is of interest that higher glutamate levels have been associated with neuropsychological disorders such as major depression () being one of the hallmarks of patients with CS, but also commonly observed in patients with PA (, ). Higher levels of lysophosphatidylcholins (lysoPC a C16:0, lysoPC a C20:4, lyspPC a 24:0) and sphingomyelin (SM C18:1) were observed in patients with EHT compared with PHT. Both lysophosphatydilcholin (, ) and sphingomyelin () are associated with increased cardiovascular risk, pointing out another metabolic pattern possibly explaining the higher incidence of cardiovascular complication in this group of hypertensive patients. However, it remains unclear whether all these findings are associated with a common pathogenic mechanism or are related to EHT.
The strength of the current investigation bases on the relatively high number of cases with EHT studied, which was only possible thanks to a concerted multi-centric approach. Furthermore, by using identical predetermined diagnostic criteria, very well characterized and uniformly investigated patient cohorts had been established for comparison. Another strength of this study is the well-defined and standardized process of sample collection and storage, which minimized the influence of various external factors such as food intake on metabolite levels and thus on the study results.
Nevertheless, we are aware that the large number of investigated metabolites in relation to the number of patients, as well as the different distribution of patients according to age and sex and the retrospective study design, might have impacted on the results. It is further possible, that patient characteristics beyond age and sex as well as extrinsic factors such as smoking might have affected analytes and thereby the overall test performance. In addition, with the exception of an overnight fasting, the study protocol did not include other specific dietary restrictions. Notably, the targeted analytic approach and the strict selection criteria for relevant metabolites achieved similar results following different statistical approaches. While this should lend the study more robustness, it might have resulted in the oversight of other relevant metabolic changes. Furthermore, the main goal of this study was to identify common discriminating features while using different approaches and not to compare the 2 distinct analysis approaches (CA and MLA). Future studies will focus on further improving the MLA performance by exploring more algorithms and classifiers to enhance the performance ability of the MLA for targeted metabolomics, which could be implemented in the clinical routine. In addition, as described in “Materials and Methods” we had to deal with distinct distributions between clinical categories according to sex and age, as well as participating center (data not shown). Therefore, it was not possible for us to perform further internal validation analyses considering each possible scenario.
The main goal of our study was to identify metabolomic differences, which might be used in future diagnostics. However, before implementation in diagnostic, routine confirmation of our results as well as optimization of the machine learning algorithms are necessary, taking also into account the problem of outliers (technical or biological) in “omic”-analyses, as has been outlined in the literature (). The prospective studies (currently under way) will allow further refinement of the models before translating them into clinical practice.
Furthermore, we appreciate obstacles in the implementation of the utilized mass spectrometry based analysis in the diagnostic routine. While liquid chromatography mass spectrometry platforms are not widely available, they have been increasingly introduced into clinical routine and are likely to find further distribution in the future ().
Another challenging aspect concerns the physician’s exemption from the interpretation of the single measured value (metabolite) and the need to entrust the decision to a complex mathematical algorithm. A potential place of the proposed screening assay would be in a nonspecialized general physician setting, where conventional endocrine diagnostics are avoided because of uncertainty in the interpretation of test results. In this setting, endocrine expertise would remain to be required with confirmation or ruling out of endocrine hypertension in prescreened patients.
In conclusion, we provide evidence that targeted metabolomics is a promising tool in discriminating patients with PHT and EHT to be used as a preselection tool for those individuals who would benefit from further referral for endocrine workup. Confirmation in a prospective cohort and analyses of the benefits in terms of morbidity and mortality as well as the cost-effectiveness of the procedure should be evaluated.
Acknowledgments
We thank all participating centers from the ENSAT-HT consortium contributing to the patient recruitment. We thank Julia Scarpa, Werner Römisch-Margl, and Silke Becker for metabolomics measurements performed at the Helmholtz Zentrum München, Genome Analysis Center, Metabolomics Core Facility.
Financial Support: This project has received funding from the European Union’s Horizon 2020 research and innovation program under grant agreement no. 633983 (ENSAT-HT to all authors, except M.D.), by the Clinical Research Priority Program of the University of Zurich for the CRPP HYRENE (to F.B.), and the Deutsche Forschungsgemeinschaft project number 314061271 (CRC/Transregio 205/1 “The Adrenal: Central relay of health and disease” to G.E., M.K., M.R., F.B.).
AUC: area under the curve
CA: classical approach
CS: Cushing syndrome
EHT: endocrine forms of hypertension
MLA: machine learning approach
orthoPLSDA: orthogonal partial least square discriminant analysis
PA: primary aldosteronism
PHT: primary hypertension
PLSDA: partial least square discriminant analysis
PPGL: pheochromocytoma/paraganglioma
ROC: receiver operating characteristic
RP: reference plasma
TM: targeted metabolomics
References
- 1. Kearney PM, Whelton M, Reynolds K, Muntner P, Whelton PK, He J. Global burden of hypertension: analysis of worldwide data. Lancet.2005;365(9455):217–223.
- 2. Mills KT, Bundy JD, Kelly TN, et al Global disparities of hypertension prevalence and control: a systematic analysis of population-based studies from 90 countries. Circulation.2016;134(6):441–450.
- 3. Muntner P, Carey RM, Gidding S, et al Potential US population impact of the 2017 ACC/AHA high blood pressure guideline. Circulation.2018;137(2):109–118.
- 4. Wang JG, Liu L. Global impact of 2017 American College of Cardiology/American Heart Association hypertension guidelines: a perspective from China. Circulation.2018;137:546–548.
- 5. Egan BM, Zhao Y, Axon RN. US trends in prevalence, awareness, treatment, and control of hypertension, 1988–2008. JAMA.2010;303:2043–2050.
- 6. Borghi C, Tubach F, De Backer G, et al Lack of control of hypertension in primary cardiovascular disease prevention in Europe: results from the EURIKA study. Int J Cardiol.2016;218:83–88.
- 7. Wolf-Maier K, Cooper RS, Kramer H, et al Hypertension treatment and control in five European countries, Canada, and the United States. Hypertension.2004;43(1):10–17.
- 8. Omura M, Saito J, Yamaguchi K, Kakuta Y, Nishikawa T. Prospective study on the prevalence of secondary hypertension among hypertensive patients visiting a general outpatient clinic in Japan. Hypertens Res.2004;27(3):193–202.
- 9. Wang L, Li N, Yao X, et al Detection of secondary causes and coexisting diseases in hypertensive patients: OSA and PA are the common causes associated with hypertension. Biomed Res Int.2017;2017:8295010.
- 10. Monticone S, Burrello J, Tizzani D, et al Prevalence and clinical manifestations of primary aldosteronism encountered in primary care practice. J Am Coll Cardiol.2017;69(14):1811–1820.
- 11. Brown JM, Siddiqui M, Calhoun DA, et al The unrecognized prevalence of primary aldosteronism: a cross-sectional study. Ann Intern Med.2020;173(1):10–20.
- 12. Williams TA, Lenders JWM, Mulatero P, et al; Primary Aldosteronism Surgery Outcome (PASO) investigators. Outcomes after adrenalectomy for unilateral primary aldosteronism: an international consensus on outcome measures and analysis of remission rates in an international cohort. Lancet Diabetes Endocrinol.2017;5(9):689–699.
- 13. Sato M, Morimoto R, Seiji K, et al Cost-effectiveness analysis of the diagnosis and treatment of primary aldosteronism in Japan. Horm Metab Res.2015;47(11):826–832.
- 14. Funder JW, Carey RM, Mantero F, et al The management of primary aldosteronism: case detection, diagnosis, and treatment: an Endocrine Society Clinical Practice Guideline. J Clin Endocrinol Metab.2016;101(5):1889–1916.
- 15. Mulatero P, Monticone S, Deinum J, et al Genetics, prevalence, screening and confirmation of primary aldosteronism: a position statement and consensus of the Working Group on Endocrine Hypertension of the European Society of Hypertension. J Hypertens.2020.
- 16. Roberts LD, Souza AL, Gerszten RE, Clish CB. Targeted metabolomics. Curr Protoc Mol Biol.2012;Chapter 30:Unit 30.32 31-24.
- 17. Siskos AP, Jain P, Römisch-Margl W, et al Interlaboratory reproducibility of a targeted metabolomics platform for analysis of human serum and plasma. Anal Chem.2017;89(1):656–665.
- 18. Watanabe M, Suliman ME, Qureshi AR, et al Consequences of low plasma histidine in chronic kidney disease patients: associations with inflammation, oxidative stress, and mortality. Am J Clin Nutr.2008;87(6):1860–1866.
- 19. Niu YC, Feng RN, Hou Y, et al Histidine and arginine are associated with inflammation and oxidative stress in obese women. Br J Nutr.2012;108(1):57–61.
- 20. Ussher JR, Elmariah S, Gerszten RE, Dyck JR. The emerging role of metabolomics in the diagnosis and prognosis of cardiovascular disease. J Am Coll Cardiol.2016;68(25):2850–2870.
- 21. Floegel A, Stefan N, Yu Z, et al Identification of serum metabolites associated with risk of type 2 diabetes using a targeted metabolomic approach. Diabetes.2013;62(2):639–648.
- 22. Then C, Wahl S, Kirchhofer A, et al Plasma metabolomics reveal alterations of sphingo- and glycerophospholipid levels in non-diabetic carriers of the transcription factor 7-like 2 polymorphism rs7903146. PLoS One.2013;8(10):e78430.
- 23. Mihalik SJ, Michaliszyn SF, de las Heras J, et al Metabolomic profiling of fatty acid and amino acid metabolism in youth with obesity and type 2 diabetes: evidence for enhanced mitochondrial oxidation. Diabetes Care.2012;35(3):605–611.
- 24. Muniandy M, Velagapudi V, Hakkarainen A, et al Plasma metabolites reveal distinct profiles associating with different metabolic risk factors in monozygotic twin pairs. Int J Obes (Lond).2019;43(3):487–502.
- 25. Di Dalmazi G, Quinkler M, Deutschbein T, et al Cortisol-related metabolic alterations assessed by mass spectrometry assay in patients with Cushing’s syndrome. Eur J Endocrinol.2017;177(2):227–237.
- 26. Erlic Z, Kurlbaum M, Deutschbein T, et al Metabolic impact of pheochromocytoma/paraganglioma: targeted metabolomics in patients before and after tumor removal. Eur J Endocrinol.2019;181(6):647–657.
- 27. Lenders JW, Duh QY, Eisenhofer G, et al; Endocrine Society. Pheochromocytoma and paraganglioma: an endocrine society clinical practice guideline. J Clin Endocrinol Metab.2014;99(6):1915–1942.
- 28. Saanchez MA, Basilio EG, Ezquerra EA, et al Comments on the 2013 ESH/ESC guidelines for the management of arterial hypertension. a report of the task force of the clinical practice guidelines committee of the Spanish Society of Cardiology. Rev Esp Cardiol.2013;66:842–847.
- 29. Lenders JWM, Kerstens MN, Amar L, et al Genetics, diagnosis, management and future directions of research of phaeochromocytoma and paraganglioma: a position statement and consensus of the Working Group on Endocrine Hypertension of the European Society of Hypertension. J Hypertens.2020;38(8):1443–1456.
- 30.
- 31. Romisch-Margl W, Prehn C, Bogumil R, Rohring C, Suhre K, Adamski J. Procedure for tissue sample preparation and metabolite extraction for high-throughput targeted metabolomics. Metabolomics.2012;8:133–142.
- 32. Zukunft S, Sorgenfrei M, Prehn C, Moller G, Adamski J. Targeted metabolomics of dried blood spot extracts. Chromatographia.2013;76:1295–1305.
- 33.
- 34. Troyanskaya O, Cantor M, Sherlock G, et al Missing value estimation methods for DNA microarrays. Bioinformatics.2001;17(6):520–525.
- 35. Xia J, Wishart DS. Using MetaboAnalyst 3.0 for comprehensive metabolomics data analysis. Curr Protoc Bioinformatics.2016;55:14.10.11–14.10.91.
- 36. Durbin BP, Hardin JS, Hawkins DM, Rocke DM. A variance-stabilizing transformation for gene-expression microarray data. Bioinformatics.2002;18(Suppl 1):S105–S110.
- 37. Trabado S, Al-Salameh A, Croixmarie V, et al The human plasma-metabolome: reference values in 800 French healthy volunteers; impact of cholesterol, gender and age. PLoS One.2017;12(3):e0173615.
- 38. Mittelstrass K, Ried JS, Yu Z, et al Discovery of sexual dimorphisms in metabolic and genetic biomarkers. PLoS Genet.2011;7(8):e1002215.
- 39.
- 40. Zhu L, Wang G, Zou X. Improved information gain feature selection method for Chinese text classification based on word embedding. Paper presented at: 6th International Conference on Software and Computer Applications (ICSCA), Bangkok, Thailand, February, 2017.
- 41. Breiman L. Random forests. Mach Learn.2001;45:5–32.
- 42. Arlot A, Celisse A. A survey of cross-validation procedures for model selection. Statistics Surveys.2010;4(1):40–79.
- 43. Demsar J, Curk T, Erjavec A, et al Orange: data mining toolbox in Python. J Mach Learn Res.2013;14:2349–2353.
- 44. Milliez P, Girerd X, Plouin PF, Blacher J, Safar ME, Mourad JJ. Evidence for an increased rate of cardiovascular events in patients with primary aldosteronism. J Am Coll Cardiol.2005;45(8):1243–1248.
- 45. Monticone S, D’Ascenzo F, Moretti C, et al Cardiovascular events and target organ damage in primary aldosteronism compared with essential hypertension: a systematic review and meta-analysis. Lancet Diabetes Endocrinol.2018;6(1):41–50.
- 46. Zelinka T, Petrák O, Turková H, et al High incidence of cardiovascular complications in pheochromocytoma. Horm Metab Res.2012;44(5):379–384.
- 47. Stolk RF, Bakx C, Mulder J, Timmers HJ, Lenders JW. Is the excess cardiovascular morbidity in pheochromocytoma related to blood pressure or to catecholamines?J Clin Endocrinol Metab.2013;98(3):1100–1106.
- 48. Mills KT, Stefanescu A, He J. The global epidemiology of hypertension. Nat Rev Nephrol.2020;16(4):223–237.
- 49. Bansal V, El Asmar N, Selman WR, Arafah BM. Pitfalls in the diagnosis and management of Cushing’s syndrome. Neurosurg Focus.2015;38(2):E4.
- 50. McCoin CS, Knotts TA, Adams SH. Acylcarnitines–old actors auditioning for new roles in metabolic physiology. Nat Rev Endocrinol.2015;11(10):617–625.
- 51. Zordoky BN, Sung MM, Ezekowitz J, et al; Alberta HEART. Metabolomic fingerprint of heart failure with preserved ejection fraction. PLoS One.2015;10(5):e0124844.
- 52. Kalim S, Clish CB, Wenger J, et al A plasma long-chain acylcarnitine predicts cardiovascular mortality in incident dialysis patients. J Am Heart Assoc.2013;2(6):e000542.
- 53. Schooneman MG, Vaz FM, Houten SM, Soeters MR. Acylcarnitines: reflecting or inflicting insulin resistance?Diabetes.2013;62(1):1–8.
- 54. Erlic Z, Beuschlein F. Metabolic alterations in patients with pheochromocytoma. Exp Clin Endocrinol Diabetes.2019;127(2-03):129–136.
- 55. Akehi Y, Yanase T, Motonaga R, et al; Japan Primary Aldosteronism Study Group. High prevalence of diabetes in patients with primary Aldosteronism (PA) associated with subclinical hypercortisolism and prediabetes more prevalent in bilateral than unilateral PA: a large, multicenter cohort study in Japan. Diabetes Care.2019;42(5):938–945.
- 56. Wallace HM, Fraser AV, Hughes A. A perspective of polyamine metabolism. Biochem J.2003;376(Pt 1):1–14.
- 57. Bjelaković G, Stojanović I, Jevtović Stoimenov T, et al Metabolic correlations of glucocorticoids and polyamines in inflammation and apoptosis. Amino Acids.2010;39(1):29–43.
- 58. Cheng ML, Wang CH, Shiao MS, et al Metabolic disturbances identified in plasma are associated with outcomes in patients with heart failure: diagnostic and prognostic value of metabolomics. J Am Coll Cardiol.2015;65(15):1509–1520.
- 59. Tantini B, Fiumana E, Cetrullo S, et al Involvement of polyamines in apoptosis of cardiac myoblasts in a model of simulated ischemia. J Mol Cell Cardiol.2006;40(6):775–782.
- 60. Rochette L, Lorin J, Zeller M, et al Nitric oxide synthase inhibition and oxidative stress in cardiovascular diseases: possible therapeutic targets? Pharmacol Ther. 2013;140(3):239–257.
- 61. Jamwal S, Sharma S. Vascular endothelium dysfunction: a conservative target in metabolic disorders. Inflamm Res.2018;67(5):391–405.
- 62. Brillon DJ, Zheng B, Campbell RG, Matthews DE. Effect of cortisol on energy expenditure and amino acid metabolism in humans. Am J Physiol.1995;268(3 Pt 1):E501–E513.
- 63. Ntali G, Grossman A, Karavitaki N. Clinical and biochemical manifestations of Cushing’s. Pituitary.2015;18(2):181–187.
- 64. Burton LA, McMurdo ME, Struthers AD. Mineralocorticoid antagonism: a novel way to treat sarcopenia and physical impairment in older people?Clin Endocrinol (Oxf).2011;75(6):725–729.
- 65. Kwak MK, Lee SE, Cho YY, et al The differential effect of excess aldosterone on skeletal muscle mass by sex. Front Endocrinol (Lausanne).2019;10:195.
- 66. Lee SH, Kwak MK, Ahn SH, et al Change of skeletal muscle mass in patients with pheochromocytoma. J Bone Miner Metab.2019;37(4):694–702.
- 67. Inoshita M, Umehara H, Watanabe SY, et al Elevated peripheral blood glutamate levels in major depressive disorder. Neuropsychiatr Dis Treat.2018;14:945–953.
- 68. Künzel HE. Psychopathological symptoms in patients with primary hyperaldosteronism–possible pathways. Horm Metab Res.2012;44(3):202–207.
- 69. Matsumoto T, Kobayashi T, Kamata K. Role of lysophosphatidylcholine (LPC) in atherosclerosis. Curr Med Chem.2007;14(30):3209–3220.
- 70. Liu P, Zhu W, Chen C, et al The mechanisms of lysophosphatidylcholine in the development of diseases. Life Sci.2020;247:117443.
- 71. Hornemann T, Worgall TS. Sphingolipids and atherosclerosis. Atherosclerosis.2013;226(1):16–28.
- 72. Lopes MB, Veríssimo A, Carrasquinha E, Casimiro S, Beerenwinkel N, Vinga S. Ensemble outlier detection and gene selection in triple-negative breast cancer data. BMC Bioinformatics.2018;19(1):168.
- 73. Seger C, Salzmann L. After another decade: LC-MS/MS became routine in clinical diagnostics. Clin Biochem.2020;82:2–11.