Molecular aberrations preceding cancer development have been documented in multiple tissues, even before the first clinically detectable lesions are apparent. Field cancerization refers to the replacement of normal cells with a cancer-prone population that has undergone some but not all of the necessary modifications for malignancy (). Understanding the occurrence of field cancerization within a specific cancer type is critical to accurately determine the risk of developing a malignancy and, therefore, contribute to cancer prevention.
In colorectal cancer (CRC), field cancerization is of particular interest due to the considerable number of sporadic cases and the limitations of current screening methods such as colonoscopy (,). Indeed, a high number of colonoscopies is required for CRC prevention, and one cannot exclude potential complications and post-colonoscopy cancer occurrence (). Thus, better risk assessment through understanding polyp initiation and progression is essential to improve the effectiveness of screening and post-polypectomy surveillance.
Previous studies found evidence of field cancerization in the colon’s normal mucosa during CRC development, mainly reporting DNA methylation changes (,). Yet, genome-wide characterization of field defects in pre-neoplastic colon lesions is lacking. Here, we focus on adenomatous polyps (AP), the primary precursor in CRC development, constituting more than 80% of polyps (,). As evidenced by studies of other organs, characterizing field defects associated with pre-neoplastic lesions requires large sample sizes to capture potentially weak and stochastic signals (,).
In this work, we take advantage of the biobank of the clinically well-characterized Swiss Epigenetic Colorectal Cancer Study (SWEPIC) cohort (), the most extensive normal mucosa study comprising more than 1100 individuals whose normal mucosa of the colon was profiled using the Illumina DNA methylation EPIC array, to investigate field cancerization in the colon of cancer-free individuals.
Methods
Methods are described in full detail in online-only Supplementary Methods (available online).
Data acquisition and selection
We collected and analyzed tissue samples from 1111 patients who underwent colonoscopy as part of the SWEPIC prospective study (), divided into 3 batches: SWEPIC1, SWEPIC2, and SWEPIC3. We focused on samples from the cecum and stratified patients based on the presence of adenomatous polyps (AP) in the right colon (from the cecum to the splenic flexure). We quantified DNA methylation beta-values for 282 321 shared probes after rigorous quality controls. Additionally, we downloaded external datasets [GSE132804 (), GSE48684 (), and GSE199057 ()] from the Gene Expression Omnibus (GEO) database and processed them similarly.
Selection criteria for discovering aDVMCs in the SWEPIC cohort
We adapted the iEVORA algorithm to identify differentially variable (False Discovery Rate [FDR]-corrected q <0.05) and differentially methylated (uncorrected P <.05) CpGs (DVMCs) (,,). We focused on probes characterized as DVMCs in at least 2 SWEPIC cohorts, resulting in the selection of adenoma-related differentially variable and differentially methylated CpG sites (aDVMCs). Each patient was assigned a measure of DNA methylation dysregulation, referred to as the fraction of DNA methylation outliers (), and we computed the Cancer Outlier Profile Analysis (COPA) value for each aDVMC (), considering a CpG site an outlier if its absolute COPA value exceeded 4. The fraction of DNA methylation outliers was calculated as the proportion of aDVMCs classified as outliers for each patient. We compared the performance of a classifier based on aDVMC scores for DNA methylation dysregulation to classifiers using a random selection of the same number of CpG sites to determine if dysregulation was genome-wide or a targeted phenomenon. Statistical significance was determined through empirical P value calculations.
Cross-validation of aDVMC-based classifiers in the SWEPIC cohort
We employed 4-fold stratified cross-validation for each SWEPIC dataset (SWEPIC1-3), stratifying based on adenoma status. The predictive power of a linear classifier using the fraction of DNA methylation outliers to distinguish individuals with and without adenomas was assessed. The procedure was applied to each train set, and the fraction of DNA methylation outliers was computed in the test set using train-set aDVMCs. COPA transformation parameters were estimated based on the healthy tissue of the train set.
Genomic region enrichment, point vs regional dysregulation, and clinical factors
To evaluate whether aDVMC sites were enriched in specific genomic regions, we used the genome annotation of colonic mucosa tissue (E075) by the Roadmap Epigenomics Consortium (). We categorized aDVMC dysregulation at the gene level to determine point vs regional dysregulation. Clinical factors were linked to aDVMC DNA methylation levels using a generalized linear model (GLM) with a Gamma Link function.
RNA sequencing processing and analysis
We conducted differential gene expression analysis on the subset of 84 SWEPIC1 patients while correcting for plate effects. We used PyDeSeq2 (https://github.com/owkin/PyDESeq2) () on transcript per million (TPM) estimates. aDVMC CpG sites associated with active genomic regions were linked to genes, and we performed agglomerative clustering (k =2, Ward linkage) of patients based on their gene expression. Paired methylation samples were used to investigate genes showing dysregulation associated with DNA methylation dysregulation.
Statistical testing
In our analyses, we employed Wilcoxon rank-sum tests for continuous variables and Kruskal-Wallis tests for multiple categories. For pairwise categorical comparisons, we used Fisher exact tests. Significance levels were set at P equals .05 for all tests, with false discovery rate (FDR) correction applied to correct for multiple testing. FDR-corrected significance levels were set at P equals0.05 for differential probe discovery and P equals0.1 for associations between methylation and clinical characteristics or gene expression.
Results
DNA methylation profiling of the normal colonic mucosa of individuals in the SWEPIC cohort
We performed the analysis on the extensive SWEPIC cohort, encompassing nearly 1600 individuals with detailed clinical and lifestyle data and DNA methylation arrays for a subset of individuals (). Our focus was on 1111 patients: 791 without right colon polyps (hence excluding patients with only sessile serrated lesions in the right colon) and 320 with adenomatous polyps (AP) in the right colon. The study was divided into 3 datasets generated consecutively (SWEPIC1, SWEPIC2, and SWEPIC3) with varied clinical features (Figure 1, A and B; Supplementary Table 1, available online). We first sequenced SWEPIC1 as a pilot, containing exclusively female patients and stratified by age (each case matched with a control patient +/- 5 years) and adenoma status; we then sequenced the remaining female patients as SWEPIC2 and, following our second endowment, sequenced all male patients as SWEPIC3.
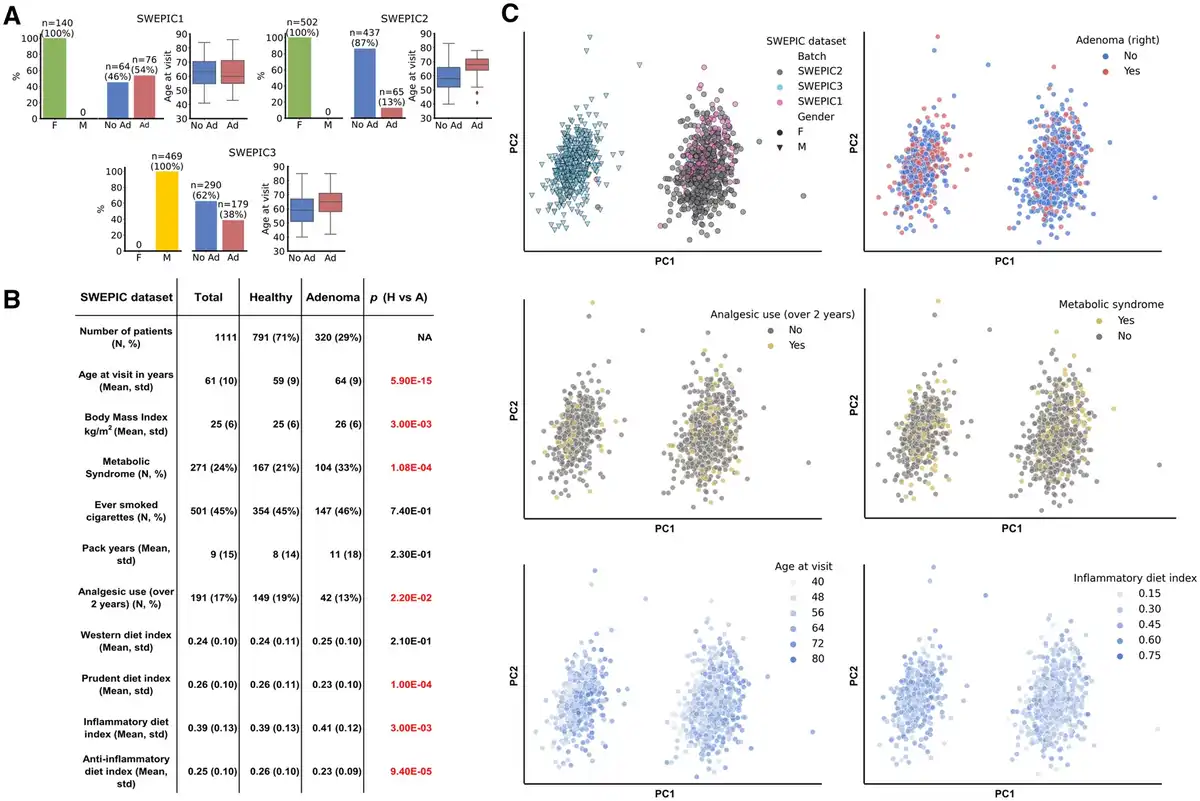
Figure 1
SWEPIC cohort characteristics. A) Characteristics of the 3 SWEPIC datasets. The absolute numbers and percentage of female (F) and male (M) individuals, individuals presenting an adenoma on the right at colonoscopy (Ad) and no adenoma (No Ad), and the distribution of age at visit in the group with and without adenoma are represented for each SWEPIC dataset. B) Main characteristics of the individuals from the SWEPIC cohort included in the study. We report continuous variables with mean and standard deviation (std) and continuous variables with count (N) and percentage of the population (%). We report values for the full cohort, as well as for the healthy patients (Healthy) and the patients presenting an adenomatous polyp in the right colon at colonoscopy (Adenoma). We report the P value of the difference in the feature between the healthy and adenoma group (Wilcoxon rank-sum test for continuous variables, Fisher exact test for binary variables). Significant differences are colored in red. C) Principal component analysis (PCA) representation in the full methylation space of samples in the cohort. We indicate the dataset samples originate from, their sex, the presence of adenoma on the right at colonoscopy, the use of analgesic for more than 2 years in their life, metabolic syndrome status, the age at visit, and the inflammatory diet index (). F = female; M = male; No Ad = no adenoma; Ad = adenoma; H = healthy; A = adenoma; std = standard deviation.
We observed significant associations between known clinical factors and the presence of APs, including age, body mass index (BMI), metabolic syndrome, analgesic use, and dietary indices (,). In the DNA methylation analysis, we noted that clinical and lifestyle factors influenced the first 50 principal components, with a noticeable “batch” effect across datasets (Figure 1, C, Supplementary Figure 1, available online). Given that the cohorts differed significantly in sex, adenoma status, and age distribution (Figure 1, A), we opted not to correct for the batch effect to prevent overcorrection due to inherent phenotypic differences between cohorts and thus conducted the analyses on each cohort individually and then aggregated the results, avoiding confounding sources of variation.
Discovery of adenoma-related differentially variable and differentially methylated CpG sites (aDVMCs) in the normal mucosa of the right colon
Motivated by previous reports on the heterogeneity and stochasticity of field cancerization in normal tissue (,), we aimed to identify CpG sites that were differentially variable and differentially methylated in healthy individuals and those with adenomas. This approach is more sensitive to subtle DNA methylation differences in normal tissue than conventional methods focusing solely on differentially methylated CpG sites (,). Our analysis confirmed the low sensitivity of the latter method, particularly in the SWEPIC2 and SWEPIC3 datasets (Supplementary Figure 2, available online).
To identify adenoma-related differentially variable and differentially methylated CpG sites (aDVMCs), we employed the iEVORA algorithm (), selected CpG sites detected across multiple datasets to reduce dataset-specific and false positive results, and used the COPA transformation to generalize across datasets () (Methods). Our approach identified 558 aDVMCs in the normal cecal mucosa associated with adenomas in the right colon (Figure 2, A; Supplementary Table 2, available online). The overlap between the probes uncovered in each SWEPIC cohort was significantly higher than by random chance (P <.0002). The fraction of DNA methylation outliers, which represents the proportion of aDVMCs significantly differentially methylated compared to the median DNA methylation level of individuals without adenomas, was higher in the AP group than in the healthy individuals (Figure 2, B). We employed a stratified 4-fold cross-validation approach to confirm this association in test sets (Figure 2, C). A linear classifier based on the fraction of DNA methylation outliers demonstrated moderate yet statistically significant power to discriminate individuals with and without adenomas (area under the receiver operating characteristic curve [ROC AUC] = 0.63-0.81 across SWEPIC cohorts) (Figure 2, D, Supplementary Figure 3, available online). Thus, in patients unseen by the model, we confirmed the presence of DNA methylation dysregulation at the aDVMCs discovered between individuals with and without adenomas in the right colon.
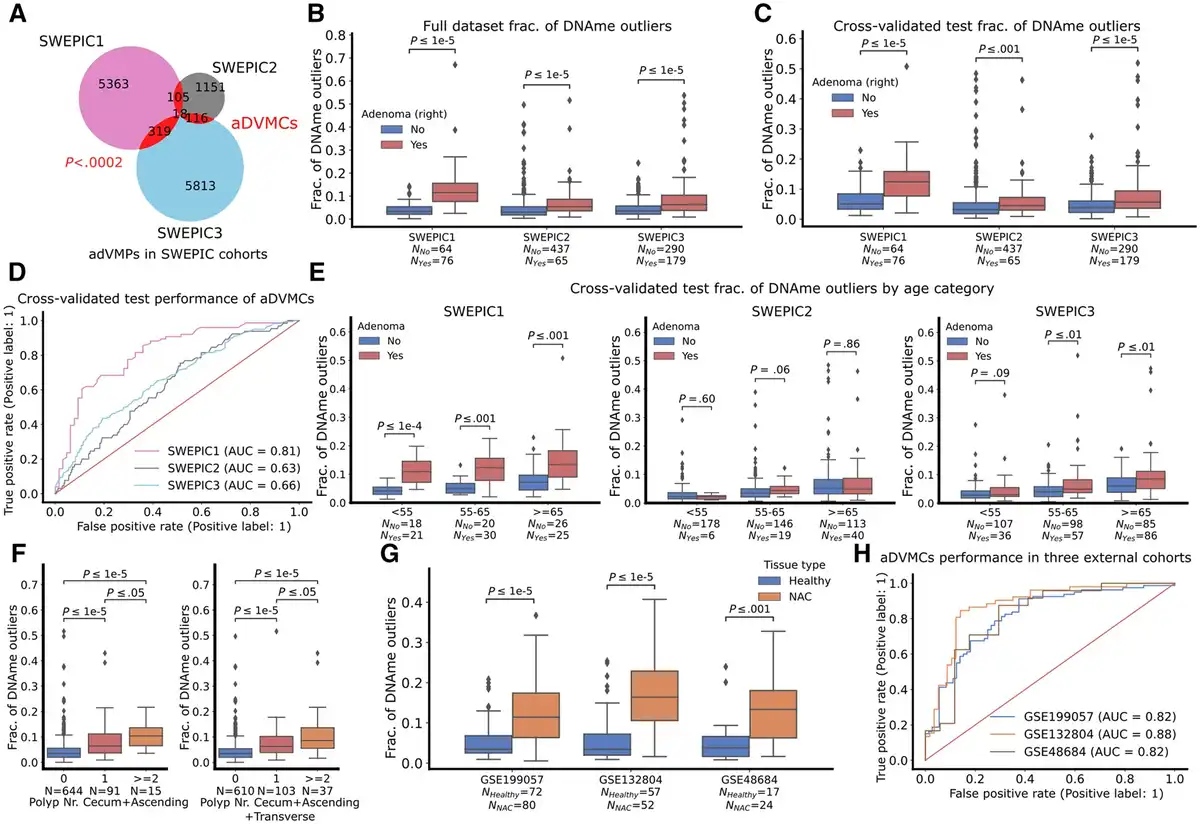
Figure 2
The fraction of DNA methylation outliers at the adenoma-related differentially variable and differentially methylated CpG sites (aDVMCs) in normal cecal mucosa of healthy individuals and patients with adenomas and cancer. A) Venn diagram representing the number of significantly differentially variable and differentially methylated CpG sites uncovered in the 3 SWEPIC datasets and their intersection. The candidate aDVMCs are the CpG sites that were selected in at least 2 datasets, yielding 558 aDVMCs. The significance of the intersection is computed using an empirical P value by randomly selecting probes 5000 times and computing the intersection (Methods). B) Distribution of the fraction of DNA methylation outliers computed at the aDVMCs in the 3 SWEPIC cohorts. The distribution of the fraction of DNA methylation outliers is compared between normal tissue of patients presenting no adenoma at colonoscopy and patients with an adenoma on the right at colonoscopy. The level of statistical significance is computed with a Wilcoxon rank-sum test. C) Same as (B), using the fraction of DNA methylation outliers computed through the cross-validation scheme on test sets. All SWEPIC cohorts were broken into 4 stratified 25% to 75% test-train splits; aDVMCs were computed in the train set and the fraction of DNA methylation outliers was computed on the test set. D) Receiver operating characteristic (ROC) curves of the cross-validated performance of a classifier based on aDVMCs for adenoma status discrimination in the 3 SWEPIC cohorts. ROC curves show the True positive rate versus the False positive rate for a set of threshold settings. ROC AUC was computed using the test fraction of DNA methylation outliers across all four folds. Random performance is indicated with a line. E) Same as (C), distribution of the fraction of DNA methylation outliers computed on the cross-validated test sets broken into age categories: under 55 y/o (<55), 55 to 65 y/o (55-65), and over 65 y/o at colonoscopy (≥65). F) Distribution of the fraction of DNA methylation outliers across patients with no, one, and more than one polyp at colonoscopy. The left plot represents patients with polyps in the cecum and ascending colon only; the right plot represents patients with polyps up until the splenic flexure. The level of significance is assessed using a Wilcoxon rank-sum test. G) Distribution of the fraction of DNA methylation outliers on the normal mucosa computed on the aDVMCs in 3 external cohorts. The distribution of the fraction of DNA methylation outliers is compared between the normal tissue of healthy individuals and patients with cancer. The level of statistical significance is computed with a Wilcoxon rank-sum test. H, ROC curves of the performance of a linear classifier based on the aDVMC fraction of DNA methylation outliers in 3 external cohorts for differentiating normal tissue of healthy patients and patients with cancer. aDVMCs = adenoma-related differentially variable and differentially methylated CpG sites; ROC AUC = area under the ROC curve; Polyp Nr Total = polyp number total; NAC = normal mucosa adjacent to cancerous tissue; y/o = years old.
We ruled out the impact of colonic mucosa cell composition on the fraction of DNA methylation outliers (), as the proportions of cell types deconvolved using EpiSCORE () were only weakly correlated with the fraction of DNA methylation outliers (Supplementary Table 3, available online). Additionally, to mitigate the influence of patients’ sex, SWEPIC1 and SWEPIC2 were merged, and a similar analysis was performed, identifying aDVMCs as the common set of probes that exhibited significant differential variability and methylation between SWEPIC1 + 2 and SWEPIC3 (Supplementary Figure 4, available online). This approach aligned closely with batch-stratified results, confirming aDVMCs’ robustness to procedural specifications.
aDVMC-based fraction of DNA methylation outliers across age categories
Considering epidemiological support for age-related adenoma prevalence (), we explored the relationship between the fraction of aDVMC-based DNA methylation outliers and age in SWEPIC cohorts. Patients were categorized by age: under 55, 55-65, and over 65 (Figure 2, E). The aDVMC-based fraction of DNA methylation outliers showed age-dependent increases in healthy patients, with 1% to 2% growth in median outliers across all SWEPIC datasets, and was consistently higher in adenomatous patients compared to healthy individuals across age categories (0%-6% increase in median). We additionally evaluated whether aDVMC-based outliers conveyed additional information beyond “biological” age estimated from DNA methylation data (,). A modest correlation was found between the fraction of aDVMC-based outliers and the Horvath DNA methylation clock () and the EpiTOC mitotic clock () (Supplementary Figure 5, available online, Pearson’s R =0.23-0.48 and R =0.39-0.52), suggesting that aDVMC-based outliers complement DNA-based “biological” age estimates. In summary, the fraction of aDVMC-based DNA methylation outliers relates to adenomas, and the age-associated increase aligns with adenoma prevalence.
Targeted nature of DNA methylation dysregulation in patients with adenomas
To investigate whether DNA methylation dysregulation in AP patients is genome-wide or targeted to specific CpG sites, we compared classifiers using aDVMC-based DNA methylation outliers to those using 1) randomly selected CpGs and 2) 5% of the most variable CpGs in healthy tissue (Supplementary Figures 3 and 6, available online, Methods). The aDVMC-based classifier consistently outperformed the others, indicating targeted CpG site dysregulation rather than a genome-wide effect. We thus hypothesize that DNA methylation dysregulation at these CpG sites, aDVMCs, may play an important role in early neoplastic development.
Polyp multiplicity association with increasing aDVMC dysregulation
To assess aDVMC-related DNA methylation outliers’ relevance in neoplastic development, we examined if the fraction of DNA methylation outliers was elevated in patients with more severe polyp manifestations. We found that the fraction of DNA methylation outliers was significantly higher in patients with multiple polyps in the cecum, ascending colon, or throughout the right-sided colon compared to those with only one polyp in a similar segment during colonoscopy (Figure 2, F). This suggests that aDVMC-related outliers are associated with an increased risk of developing multiple polyps. However, there was no significant difference in patients with larger polyps in the right colon, indicating no size association, and between patients with nonadvanced and advanced adenomas, likely indicating a link to polyp formation rather than progression; these results are to be considered with caution due to a small advanced adenoma sample size (n =48) (Supplementary Table 4, Supplementary Figure 7, available online). Our findings that greater field defects may predict the development of multiple polyps align well with recent reports suggesting that polyp multiplicity may predict high-risk neoplasia development more effectively than polyp size and histology ().
Evaluation of DNA methylation variability at aDVMCs in normal tissue adjacent to CRC tumors in three external cohorts
To assess the significance of DNA methylation variability at aDVMCs in early neoplastic transformation, we examined its potential to distinguish between normal tissue adjacent to CRC (NAC) and healthy tissue in 3 external cohorts. The fraction of DNA methylation outliers at aDVMCs differed significantly between NAC and healthy tissue across all cohorts and distinguished NAC from normal healthy tissue (ROC AUC = 0.82-0.88 in GSE199057, GSE132804, and GSE48684) (Figure 2, G-H; Supplementary Figure 8). Moreover, aDVMC-based classifiers consistently outperformed random CpG and age-based classifiers in the 3 cohorts, supporting the targeted nature of aDVMC dysregulation and its relevance in addition to age (Supplementary Figure 8, available online). Finally, we evaluated aDVMCs’ dysregulation in neoplastic tissue from GSE199057 and GSE48684 and found a significantly increased fraction of DNA methylation outliers, enabling the distinction of normal and neoplastic tissue with high accuracy (Supplementary Figure 9, available online). These results suggested that the field cancerization effect is established early in tumorigenesis, at the stage of precursor lesions, and that its magnitude increases as neoplastic transformation occurs, consistent with the patterns observed in cervical and breast carcinogenesis (,).
We hypothesized that aDVMC dysregulation would evolve from stochastic to coordinated during neoplastic transformation. We thus compared the null distribution of the expected Manhattan distance between healthy mucosa, NAC, adenoma, and cancer tissue samples, similarly as in a previous study () (Methods). Our analysis revealed a shift from stochastic to coordinated dysregulation as tissue progressed along the neoplastic pathway (Supplementary Figure 10, available online).
Enrichment of aDVMCs in specific genomic regions and their regional vs local dysregulation
We explored the genome regions preferentially targeted by early DNA methylation dysregulation using regions annotated by the Roadmap Epigenomics Consortium (). We found that nearly half of the aDVMCs (47%) were located in active promoter regions, whereas 21% were assigned to bivalent promoters (Figure 3, A). aDVMCs were enriched in active and bivalent regions but depleted in quiescent and polycomb-repressed regions compared to background Illumina CpG probes (Figure 3, B). Additionally, aDVMCs were found in regulatory regions associated with known tumor suppressor genes or oncogenes, such as SMAC (), CDKN1C (,), IQGAP2 (,), and XPR1 (). aDVMCs did not exhibit clustering within specific genomic regions but represented individual positions across the genome. To determine whether these CpG sites displayed regional or point DNA methylation dysregulation, we examined the extent of dysregulation in neighboring Illumina CpG probes associated with the same gene and categorized aDVMCs as regionally dysregulated if a majority of patients displayed significant dysregulation in at least one neighboring probe (Methods). Regional and point dysregulation of DNA methylation at aDVMCs occurred in comparable proportions, suggesting no predominant mechanism underlying aDVMC dysregulation (Figure 3, C). Examples included HLA-F and SPIRE1 promoter regions showing regional dysregulation. In contrast, the IQGAP2 promoter region exhibited point dysregulation (Supplementary Figure 11, available online).
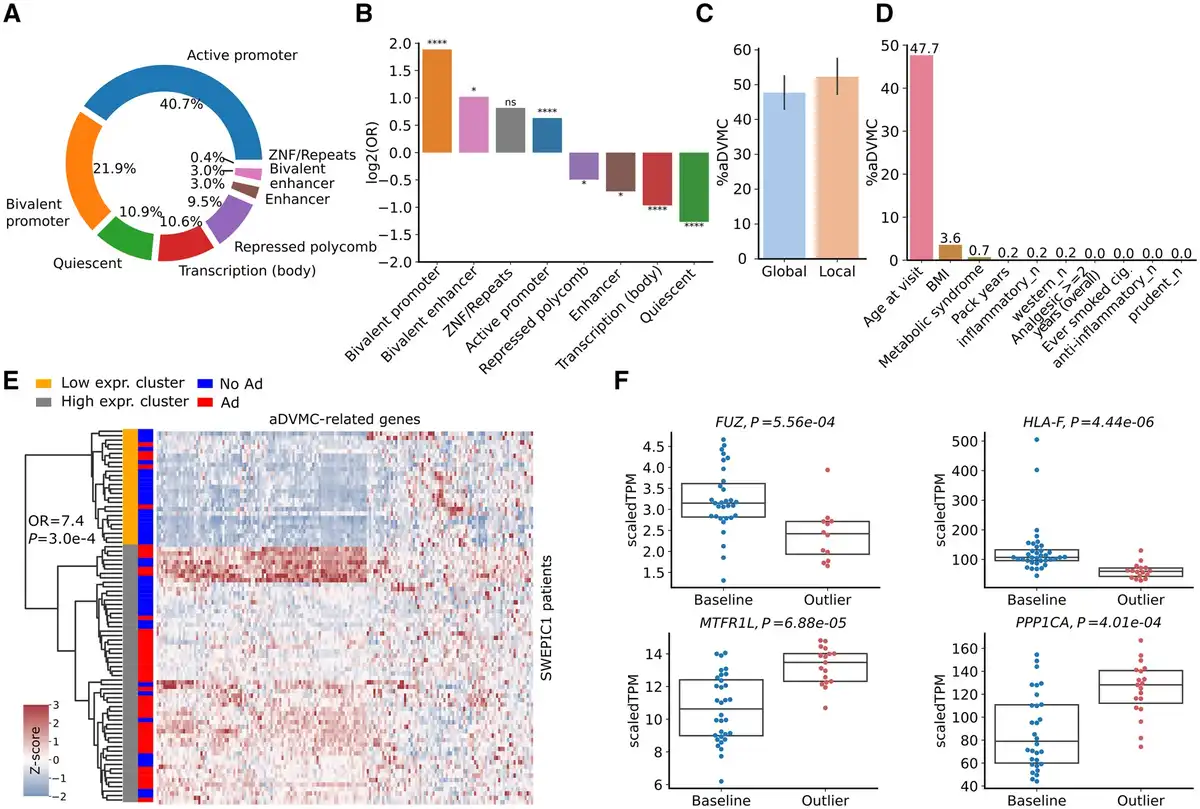
aDVMCs enrichment in active and bivalent regions of the genome, association between DNA methylation levels and clinical and lifestyle factors, and aDVMC-related gene expression in normal tissue adjacent to adenoma. A) Genomic locations of aDVMC. B) Odds ratios (ORs) characterizing enrichment of aDVMC in specific types of genomic regions compared to background Illumina CpG probes. The ORs and associated P values are computed using the Fisher exact test; P values are corrected using FDR. C) Percentage of aDVMCs with point and regional DNA methylation dysregulation. To determine the dysregulation pattern, we examined the neighboring CpG probes for each aDVMC. If at least one of the flanking CpG probes within a region of +/- 2.5 kb displayed significant dysregulation in the majority of patients with adenomas, we classified the aDVMC as regionally dysregulated. Conversely, if neighboring CpGs did not exhibit consistent dysregulation, we categorized the dysregulation at the aDVMC as point one. D) Percentage of aDVMCs significantly associated with each clinical and lifestyle factor in at least 2 SWEPIC cohorts (False Discovery Rate FDR P <0.1). P values are calculated based on a multivariate generalized linear model (GLM) and corrected using FDR. E) Heatmap of the expression values of genes linked to aDVMCs located in active promoter regions for all patients of the SWEPIC1 cohort. Patients are clustered using agglomerative clustering (Euclidean distance, Ward’s linkage) into a low expression and high expression cluster. Adenoma status is represented alongside cluster assignment. F) Gene expression of selected aDVMC-related genes that are significantly differentially expressed (FDR P < .1) between the groups of patients with aDVMC hits (outlier) and baseline patients. Ad = adenoma; No Ad = no adenoma; OR = odds ratio; aDVMC = adenoma-related differentially variable and differentially methylated CpG sites; BMI = body mass index; scaled TPM = scaled transcript per million; FC = fold change. ns: ; *: ; ; ;
Modulation of DNA methylation variability at aDVMCs by clinical and lifestyle factors
To investigate the influence of clinical and lifestyle factors on DNA methylation dysregulation at aDVMCs, we conducted a multivariate generalized linear model analysis to evaluate the significance of the effect of these factors on the methylation level of aDVMCs. We found that close to half of the aDVMCs (48%) were significantly associated with age in at least 2 of the SWEPIC cohorts (FDR <0.1), whereas a small proportion of aDVMCs (<10%) were associated with BMI and metabolic syndrome (Figure 3, D). Of the 558 aDVMCs, more than half were significantly associated (FDR <0.1) with at least one clinical or lifestyle factor in a SWEPIC cohort (Supplementary Figure 12, available online). These findings suggested that mostly age and, to a lesser extent, exposure may modulate field cancerization, suggesting DNA methylation as a potential mechanism linking these well-known risk factors with AP risk.
Dysregulated gene expression of a fraction of genes with aDVMCs in promoters in normal tissue adjacent to adenoma
To investigate the impact of early DNA methylation dysregulation on gene expression, we analyzed a subset of SWEPIC1 cohort samples (n =84) with a focus on genes having aDVMCs in their promoter or promoter-flanking regions (). After quality control, a total of 172 genes with aDVMCs assigned to their transcription start site (TSS) regions were quantified with RNA-seq. The first principal component (PC) in the RNA-seq data correlated with adenoma status and plate indicators (Supplementary Figure 13, available online). We thus performed differential gene expression analysis correcting for plate effects using DESeq2. Fifteen (8.7%) genes with aDVMCs in promoters were significantly differentially expressed between normal tissue and normal tissue adjacent to adenoma (NAA) after FDR correction. Unsupervised agglomerative clustering using aDVMC-related genes segregated patients into low-expression and high-expression groups associated with adenoma status (Figure 3, E; Fisher exact test, OR = 7.7, P =.0003). Another analysis on the subset of patients from plate 1 showed a similar trend (Supplementary Figure 13, available online, Fisher exact test, OR = 6.1, P =.14). Our results indicated that genes targeted by methylation dysregulation at aDVMCs exhibit modest but significant gene expression dysregulation in NAA, showing field cancerization at an early stage.
Furthermore, we examined the methylation-expression association in paired samples. Sixteen (9.3%) aDVMC-related genes displayed significantly different expression between outlier and baseline groups, with a quartet of genes (FUZ, HLA-F, MTRFL1, and PPP1CA) showing significant methylation-expression association after FDR correction (Figure 3, F). These genes, involved in cancer progression and immune responses (), showed dual dysregulation at the DNA methylation and transcriptional levels and may provide insights into early AP development.
Discussion
Our study provides novel insights into field cancerization in the normal right-sided colon mucosa of patients with adenomatous polyps (AP), indicating that this phenomenon is established in the earliest stages of CRC tumorigenesis. The magnitude of field cancerization amplifies with lesion severity, as indicated by aDVMCs’ superior discriminatory ability in NAC. Additionally, progressive DNA methylation dysregulation was observed along the adenoma-carcinoma sequence continuum, evidenced by the elevated number of DNA methylation outliers in neoplastic tissue. The biological relevance of the identified aDVMCs, ie, positions at which patients with AP show deregulation of DNA methylation, is supported by several observations. First, an increased fraction of aDVMC methylation outliers marked colorectal carcinogenesis stages, strengthening aDVMCs’ role in cancer initiation. Second, we identified oncogenes and tumor suppressors with aDVMC-related methylation changes, implicating their involvement in cancer pathways; this corroborates earlier findings of epigenetic contributions to colon carcinogenesis pathways (). Lastly, aDVMC methylation correlated with CRC risk factors, notably age, reflecting its role in right-sided colon CRC development. This observation aligns with epidemiological data indicating proximal CRC risk increases with age, whereas lifestyle exposure drives left-sided and rectal CRC in younger patients ().
Despite promising findings, our study has limitations to consider. First, classifiers based on aDVMCs had limited power to predict adenomas on the left colon side. This was exemplified by inconclusive results of a similar analysis on samples from the sigmoid colon (data not shown) and a lack of discrimination from aDVMCs between NAA and healthy patients in an external cohort with left-sided samples (ROC AUC = 0.58) (Supplementary Figure 14, available online). Second, the SWEPIC datasets were heterogeneous, which hindered sex and age-related analysis. Third, DNA methylation outlier-based classifiers had modest predictive power for adenomas, necessitating auxiliary factors for improved monitoring. Fourth, given that we did not have information about the distance between the biopsy and the adenoma site, we could not assess the impact of this distance on DNA methylation dysregulation. Finally, we used DNA methylation arrays, potentially missing the information on DNA methylation dysregulation in non-covered genomic regions.
Colorectal cancer remains a significant cause of cancer-related deaths globally, despite the recognized efficacy of colonoscopy and polyp resection in CRC prevention (,) highlighted by the occurrence of cancer even after these preventive measures have been taken (). Thus, to enhance CRC prevention strategies, it is essential to improve patient stratification for effective colonoscopy monitoring (,,). DNA methylation has emerged as a promising biomarker for patient stratification, given its crucial role in CRC development and progression (,). Our study revealed that patients exhibiting high levels of DNA methylation field cancerization are at an increased risk of developing AP and synchronous polyps. Therefore, stratifying patients based on the extent of field cancerization in the colon holds the potential for tailoring endoscopic screening and surveillance and thereby reducing the incidence of post-colonoscopy CRC. Additionally, our findings demonstrated the predictive power of classifiers based on aDVMCs, specifically in the right colon, an area where colonoscopy has shown less effectiveness in preventing CRC (,). Further validation of the efficacy of stratifying patients for CRC risk by the aDVMC-based fraction of DNA methylation outliers may guide the development of personalized surveillance procedures, considering its association with the risk of adenoma formation. Future work might extend aDVMC classifiers to noninvasive monitoring methods such as blood or stool, with prospective studies needed.
Cumulatively, in this study, we present evidence for pre-neoplastic field cancerization via aDVMC-associated DNA methylation dysregulation (Figure 4). Dysregulation patterns evolve from stochastic to coordinated during neoplastic transformation, and its extent increases along this transformation, potentially predisposing right colon mucosa to neoplasia. These findings have important implications for patient stratification and monitoring; however, validation in larger cohorts is necessary to assess the utility of aDVMC-based classifiers in clinical risk assessment.
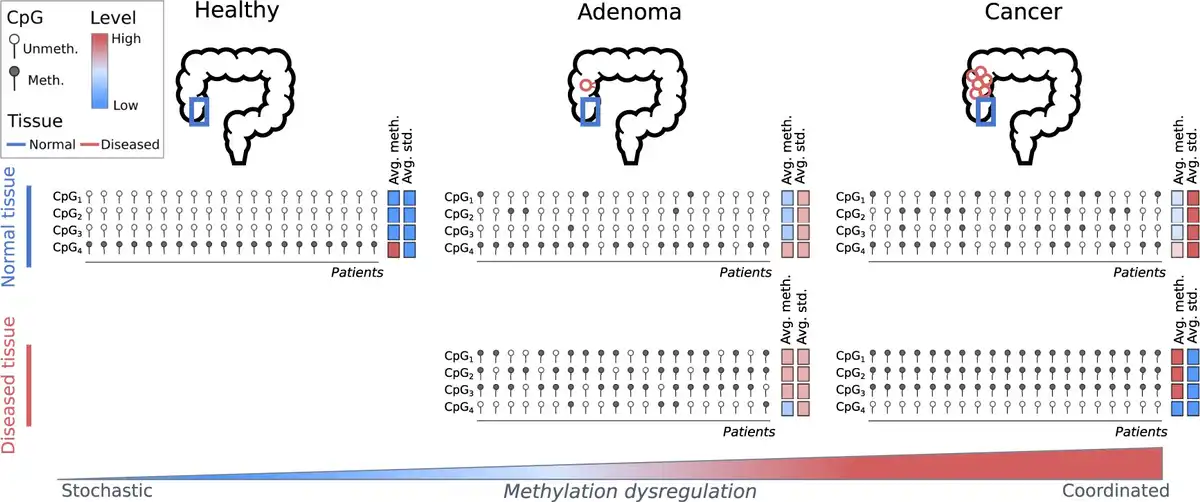
Figure 4
Schematic representation of aDVMC dysregulation along the path of tumorigenesis of the conventional pathway. The status of 4 schematic probes, CpG1, CpG2, CpG3, and CpG4, representing aDVMCs, is represented as methylated or unmethylated. Columns represent patients. The average methylation level (avg. meth.) and standard deviation (avg. std) are represented using a color scale, from low to high. The top row represents the methylation status of normal colonic mucosa from healthy individuals, patients with an adenomatous polyp, and patients with colon cancer. The bottom row represents the methylation status in the neoplastic tissue (either adenoma or cancer). As the disease progresses, the dysregulation becomes increasingly coordinated.
Acknowledgments
We express our gratitude to all study participants and the staff of the involved clinics for their valuable support. We thank Catharine Aquino and the Functional Genomics Center Zurich for the timely processing of the RNAseq data. We are grateful to Florian Dolci for engaging in helpful discussions. The funder had no role in the design of the study, the collection, analysis, or interpretation of the data, or the writing of the manuscript and decision to submit it for publication.
References
- 1. Curtius K, Wright NA, Graham TA. An evolutionary perspective on field cancerization. Nat Rev Cancer. 2018;18(1):19–32.
- 2. Bretthauer M, Løberg M, Wieszczy P, et al; NordICC Study Group. Effect of colonoscopy screening on risks of colorectal cancer and related death. N Engl J Med. 2022;387(17):1547–1556.
- 3. The American Cancer Society medical and editorial content team. Colorectal Cancer Risk Factors. https://www.cancer.org/cancer/colon-rectal-cancer/causes-risks-prevention/risk-factors.html. Accessed April 14, 2023.
- 4. Leung K, Pinsky P, Laiyemo AO, Lanza E, Schatzkin A, Schoen RE. Ongoing colorectal cancer risk despite surveillance colonoscopy: the Polyp Prevention Trial Continued Follow-up Study. Gastrointest Endosc. 2010;71(1):111–117.
- 5. Robertson DJ. Colonoscopy for colorectal cancer prevention: is it fulfilling the promise? Gastrointest Endosc. 2010;71(1):118–120.
- 6. Samadder NJ, Curtin K, Tuohy TMF, et alCharacteristics of missed or interval colorectal cancer and patient survival: a population-based study. Gastroenterology. 2014;146(4):950–960.
- 7. Kamiyama H, Suzuki K, Maeda T, et alDNA demethylation in normal colon tissue predicts predisposition to multiple cancers. Oncogene. 2012;31(48):5029–5037.
- 8. Worthley DL, Whitehall VLJ, Buttenshaw RL, et alDNA methylation within the normal colorectal mucosa is associated with pathway-specific predisposition to cancer. Oncogene. 2010;29(11):1653–1662.
- 9. Hiraoka S, Kato J, Horii J, et alMethylation status of normal background mucosa is correlated with occurrence and development of neoplasia in the distal colon. Hum Pathol. 2010;41(1):38–47.
- 10. Kawakami K, Ruszkiewicz A, Bennett G, et alDNA hypermethylation in the normal colonic mucosa of patients with colorectal cancer. Br J Cancer. 2006;94(4):593–598.
- 11. Belshaw NJ, Pal N, Tapp HS, et alPatterns of DNA methylation in individual colonic crypts reveal aging and cancer-related field defects in the morphologically normal mucosa. Carcinogenesis. 2010;31(6):1158–1163.
- 12. Belshaw NJ, Elliott GO, Foxall RJ, et alProfiling CpG island field methylation in both morphologically normal and neoplastic human colonic mucosa. Br J Cancer. 2008;99(1):136–142.
- 13. Paun BC, Kukuruga D, Jin Z, et alRelation between normal rectal methylation, smoking status, and the presence or absence of colorectal adenomas. Cancer. 2010;116(19):4495–4501.
- 14. Yu M, Wang T, Carter KT, et alAbstract 477: Elevated EVL methylation level in the normal colon mucosa is a potential risk biomarker for developing metachronous polyps. Cancer Res. 2021;81(suppl 13):477.
- 15. Jung G, Hernández-Illán E, Lozano JJ, et alEpigenome-wide DNA methylation profiling of normal mucosa reveals HLA-F hypermethylation as a biomarker candidate for serrated polyposis syndrome. J Mol Diagn. 2022;24(6):674–686.
- 16. Choi CHR, Bakir IA, Hart AL, Graham TA. Clonal evolution of colorectal cancer in IBD. Nat Rev Gastroenterol Hepatol. 2017;14(4):218–229.
- 17. Ghosh J, Schultz BM, Chan J, et alEpigenome-wide study identifies epigenetic outliers in normal mucosa of patients with colorectal cancer. Cancer Prev Res. 2022;15(11):755–766.
- 18. Luo Y, Wong CJ, Kaz AM, et alDifferences in DNA methylation signatures reveal multiple pathways of progression from adenoma to colorectal cancer. Gastroenterology. 2014;147(2):418–429.e8.
- 19. Luo Y, Yu M, Grady WM. Field cancerization in the colon: a role for aberrant DNA methylation? Gastroenterol Rep (Oxf). 2014;2(1):16–20.
- 20. Lao VV, Grady WM. Epigenetics and colorectal cancer. Nat Rev Gastroenterol Hepatol. 2011;8(12):686–700.
- 21. Noreen F, Röösli M, Gaj P, et alModulation of age- and cancer-associated DNA methylation change in the healthy colon by aspirin and lifestyle. J Natl Cancer Inst. 2014;106(7):dju161. doi:
- 22. Noreen F, Küng T, Tornillo L, et alDNA methylation instability by BRAF-mediated TET silencing and lifestyle-exposure divides colon cancer pathways. Clin Epigenetics. 2019;11(1):196.
- 23. Taherian M, Lotfollahzadeh S, Daneshpajouhnejad P, Arora K. Tubular Adenoma. Treasure Island, FL: StatPearls Publishing; 2023.
- 24. Teschendorff AE, Widschwendter M. Differential variability improves the identification of cancer risk markers in DNA methylation studies profiling precursor cancer lesions. Bioinformatics. 2012;28(11):1487–1494.
- 25. Teschendorff AE, Jones A, Fiegl H, et alEpigenetic variability in cells of normal cytology is associated with the risk of future morphological transformation. Genome Med. 2012;4(3):24.
- 26. Teschendorff AE, Gao Y, Jones A, et alDNA methylation outliers in normal breast tissue identify field defects that are enriched in cancer. Nat Commun. 2016;7(1):10478.
- 27. Ghosh J, Schultz B, Coutifaris C, Sapienza C. Chapter One—Highly variant DNA methylation in normal tissues identifies a distinct subclass of cancer patients. In: Tew KD, Fisher PB, eds. Advances in Cancer Research. Vol. 142. Cambridge, MA: Academic Press; 2019:1–22.
- 28. Kim J, Nath K, Schmidlin K, et alHierarchical contribution of individual lifestyle factors and their interactions on adenomatous and serrated polyp risk. J Gastroenterol. 2023;58(9):856–867. doi:
- 29. Wang T, Maden SK, Luebeck GE, et alDysfunctional epigenetic aging of the normal colon and colorectal cancer risk. Clin Epigenet. 2020;12(1):5.
- 30. MacDonald JW, Ghosh D. COPA—cancer outlier profile analysis. Bioinformatics. 2006;22(23):2950–2951.
- 31. Kundaje A, Meuleman W, Ernst J, et al; Roadmap Epigenomics ConsortiumIntegrative analysis of 111 reference human epigenomes. Nature. 2015;518(7539):317–330.
- 32. Love MI, Huber W, Anders S. Moderated estimation of fold change and dispersion for RNA-seq data with DESeq2. Genome Biol. 2014;15(12):550.
- 33. Botteri E, Iodice S, Raimondi S, Maisonneuve P, Lowenfels AB. Cigarette smoking and adenomatous polyps: a meta-analysis. Gastroenterology. 2008;134(2):388–395.
- 34. Dekker E, Tanis PJ, Vleugels JLA, Kasi PM, Wallace MB. Colorectal cancer. Lancet. 2019;394(10207):1467–1480.
- 35. Corley DA, Jensen CD, Marks AR, et alVariation of adenoma prevalence by age, sex, race, and colon location in a large population: Implications for screening and quality programs. Clin Gastroenterol Hepatol. 2013;11(2):172–180.
- 36. Salimian S, Habibi M, Sehat M, Hajian A. Obesity and incidence of colorectal polyps: a case-controlled study. Ann Med Surg (Lond). 2023;85(2):306–310.
- 37. Chan AT, Giovannucci EL, Meyerhardt JA, Schernhammer ES, Curhan GC, Fuchs CS. Long-term use of aspirin and nonsteroidal anti-inflammatory drugs and risk of colorectal cancer. JAMA. 2005;294(8):914–923.
- 38. Yuan F, Deng L, Sun X, et alDietary inflammatory index and risk of colorectal adenoma: effect measure modification by race, nonsteroidal anti-inflammatory drugs, cigarette smoking and body mass index?Cancer Causes Control. 2021;32(8):837–847.
- 39. Jaffe AE, Irizarry RA. Accounting for cellular heterogeneity is critical in epigenome-wide association studies. Genome Biol. 2014;15(2):R31.
- 40. Teschendorff AE, Zhu T, Breeze CE, Beck S. EPISCORE: cell type deconvolution of bulk tissue DNA methylomes from single-cell RNA-Seq data. Genome Biol. 2020;21(1):221.
- 41. Horvath S, Raj K. DNA methylation-based biomarkers and the epigenetic clock theory of ageing. Nat Rev Genet. 2018;19(6):371–384.
- 42. Yang Z, Wong A, Kuh D, et alCorrelation of an epigenetic mitotic clock with cancer risk. Genome Biol. 2016;17(1):205.
- 43. Horvath S. DNA methylation age of human tissues and cell types. Genome Biol. 2013;14(10):R115.
- 44. Yoon H, Shin CM, Park YS, Kim N, Lee DH. Total polyp number may be more important than size and histology of polyps for prediction of metachronous high-risk colorectal neoplasms. BMC Gastroenterol. 2022;22(1):91–97.
- 45. Paul A, Krelin Y, Arif T, Jeger R, Shoshan-Barmatz V. A new role for the mitochondrial pro-apoptotic protein SMAC/diablo in phospholipid synthesis associated with tumorigenesis. Mol Ther. 2018;26(3):680–694.
- 46. Guo H, Lv Y, Tian T, et alDownregulation of p57 accelerates the growth and invasion of hepatocellular carcinoma. Carcinogenesis. 2011;32(12):1897–1904.
- 47. Guo H, Tian T, Nan K, Wang W. p57: a multifunctional protein in cancer (Review). Int J Oncol. 2010;36(6):1321–1329.
- 48. Kumar D, Patel SA, Hassan MK, Mohapatra N, Pattanaik N, Dixit M. Reduced IQGAP2 expression promotes EMT and inhibits apoptosis by modulating the MEK-ERK and p38 signaling in breast cancer irrespective of ER status. Cell Death Dis. 2021;12(4):389.
- 49. Ghaleb AM, Bialkowska AB, Snider AJ, et alIQ motif-containing GTPase-activating protein 2 (IQGAP2) is a novel regulator of colonic inflammation in mice. PLoS One. 2015;10(6):e0129314.
- 50. Bondeson DP, Paolella BR, Asfaw A, et alPhosphate dysregulation via the XPR1-KIDINS220 protein complex is a therapeutic vulnerability in ovarian cancer. Nat Cancer. 2022;3(6):681–695.
- 51. Jones PA, Baylin SB. The epigenomics of cancer. Cell. 2007;128(4):683–692.
- 52. Chen ZS, Lin X, Chan TF, Chan HYE. Pan-cancer investigation reveals mechanistic insights of planar cell polarity gene Fuz in carcinogenesis. Aging. 2021;13(5):7259–7283.
- 53. Hao X, Luo H, Krawczyk M, et alDNA methylation markers for diagnosis and prognosis of common cancers. Proc Natl Acad Sci USA. 2017;114(28):7414–7419.
- 54. Lee N, Ishitani A, Geraghty DE. HLA-F is a surface marker on activated lymphocytes. Eur J Immunol. 2010;40(8):2308–2318.
- 55. Lin A, Yan WH. The emerging roles of human leukocyte antigen-F in immune modulation and viral infection. Front Immunol. 2019;10(1):964.
- 56. Tilokani L, Russell FM, Hamilton S, et alAMPK-dependent phosphorylation of MTFR1L regulates mitochondrial morphology. Sci Adv. 2022;8(45):eabo7956.
- 57. Chen M, Wan L, Zhang J, et alDeregulated PP1α phosphatase activity towards MAPK activation is antagonized by a tumor suppressive failsafe mechanism. Nat Commun. 2018;9(1):159.
- 58. Sun H, Ou B, Zhao S, et alUSP11 promotes growth and metastasis of colorectal cancer via PPP1CA-mediated activation of ERK/MAPK signaling pathway. EBioMedicine. 2019;48(1):236–247.
- 59. Baran B, Mert Ozupek N, Yerli Tetik N, Acar E, Bekcioglu O, Baskin Y. Difference between left-sided and right-sided colorectal cancer: a focused review of literature. Gastroenterology Res. 2018;11(4):264–273.
- 60. Winawer SJ, Zauber AG, Ho MN, et alPrevention of colorectal cancer by colonoscopic polypectomy. The National Polyp Study Workgroup. N Engl J Med. 1993;329(27):1977–1981.
- 61. Cardoso R, Guo F, Heisser T, et alColorectal cancer incidence, mortality, and stage distribution in European countries in the colorectal cancer screening era: an international population-based study. Lancet Oncol. 2021;22(7):1002–1013.
- 62. Cardoso R, Guo F, Heisser T, et alProportion and stage distribution of screen-detected and non-screen-detected colorectal cancer in nine European countries: an international, population-based study. Lancet Gastroenterol Hepatol. 2022;7(8):711–723.
- 63. Yates J, Boeva V. Deciphering the etiology and role in oncogenic transformation of the CpG island methylator phenotype: a pan-cancer analysis. Brief Bioinform. 2022;23(2). doi: