Introduction
Major depressive disorder (MDD) is one of the most pervasive psychiatric disorders, with a lifetime prevalence of roughly 21% in the United States, 11% in Europe, and around 2%–6.7% in Asia (). It is a leading cause of disability worldwide () and may result in an increased risk of other ailments, including diabetes (), cardiovascular diseases () and Alzheimer’s disease (). Depressive disorders were the 13th leading cause of worldwide disability-adjusted life years (DALYs) and accounted for 37.3% of mental disorder DALYs in 2019 (). Despite MDD’s high impact on global health, effective treatment for some patients remains elusive. Currently, the first line of treatment is antidepressant drug (AD) therapy, yet around 40% of patients do not respond to their first treatment (). Moreover, approximately two-thirds of patients do not achieve remission with first-line antidepressants, and a third of these patients fail to remit after multiple treatment options (; ). Currently, no predictive biological marker of treatment response is used in clinical practice, and therefore clinicians rely primarily on a trial-and-error approach to find appropriate treatments.
Neuroimaging techniques have shown promising results in identifying brain correlates predictive of treatment response in MDD. Concerning grey matter (GM) volumes, several studies found volumetric reductions, most notably in areas of the limbic system and frontal cortex, associated both with MDD diagnosis and treatment response (; ; ).
Lower hippocampal volumes are a consistent finding in MDD imaging (; ). In recent years, they have also emerged as one of the few robust structural predictors of poor antidepressant response (), with several studies, both specifically focused on the hippocampus or without a priori regions of interest (ROI) defined, reporting its association with treatment outcome in MDD patients (; ; ). Other studies, however, did not find such an association (; ).
Closely related to the hippocampus, both anatomically and functionally, amygdala volumes have also been investigated regarding treatment response in depression. While larger bilateral amygdala volumes have been found to predict Electroconvulsive therapy (ECT) treatment response (), results in studies investigating drug treatments have been more inconsistent ().
Another brain region consistently found to have lower volumes or cortical thickness in MDD patients compared to controls is the anterior cingulate cortex (; ; ); however, its relation to treatment response is unclear, with some authors reporting the association between lower thickness or volumes in this region and worse antidepressant response (; ), while others failing to find any effect ().
Furthermore, several other brain regions in which reduced GM volumes appear to be associated with worse treatment response have been identified, including the dorsolateral prefrontal cortex, middle and inferior frontal gyri, orbitofrontal cortex, insula, fusiform and lingual gyri (). As suggested by a recent review, generally, lower GM volumes appear to be linked to worse treatment outcomes (). On the other hand, a few studies have associated lower baseline GM volumes with better treatment response, particularly in right temporal regions (; ).
Together with structural neuroimaging, functional MRI has also been extensively used to investigate the association between resting state functional connectivity (rs-FC) and treatment response in MDD patients (). The anterior cingulate cortex (ACC) is again among the most investigated brain regions: lower rs-FC between ACC, ventromedial prefrontal cortex and posterior cingulate cortex has been associated with better treatment response (; ), as well as higher connectivity with right dorsolateral prefrontal cortex (). The amygdala is another region intensively studied, with increased rs-FC with the opercular cortex and right middle frontal gyrus and decreased connectivity with bilateral orbitofrontal and posterior cingulate cortex found to be associated with better response (; ). Higher rs-FC between the insula, the prefrontal cortex, and the parahippocampal gyrus and lower between the insula and the opercular cortex has been associated with symptom remission (), and a study focused specifically on the hippocampi found higher rs-FC between the left hippocampus and left inferior frontal gyrus and precuneus in early responders (). In whole-brain connectivity analyses, baseline rs-FC between the default mode network (DMN) and the orbitofrontal cortex was negatively correlated with clinical improvement (), while in another study, baseline rs-FC within the DMN and with the central executive network predicted treatment response (). Meanwhile, functional connectivity in the salience network has been associated with clinical response to transcranial magnetic stimulation (TMS) in two studies (; ). However, classical mass univariate statistical analyses suffer from the curse of dimensionality (i.e. the number of voxels is significantly higher compared to sample size), introducing significant biases in inferential statistics from high-dimensional data. These limitations can be addressed by functional connectivity multivariate pattern analyses (fc-MVPA), which captures spatially distributed activation patterns underlying behavioural outcomes and mental states, promoting the identification of new biomarkers for mood disorders () and treatment response (; ).
The majority of existing literature on brain correlates of antidepressant response focuses on the effect of drugs acting on monoaminergic systems. However, in recent years, studies investigating brain correlates of treatments with different mechanisms of action such as ketamine are beginning to emerge. Interestingly, they seem to again identify the hippocampus as a key region in affecting response, albeit with somewhat conflicting results: indeed if on the one hand Ketamine was found to be more effective in patients with relatively smaller left hippocampus (), at the same time ketamine treatment was associated with increases in hippocampal volumes () and mean diffusivity ().
Current studies investigating structural and functional correlates of antidepressant treatment response have often been performed on small samples, without a multimodal approach, and focusing on a priori-determined ROIs.
Furthermore, studies employing a real-world approach are sparse, with many authors investigating the effect of a single drug treatment at a fixed dose. While this approach has some undoubted benefits, it nevertheless is often distant from the actual clinical management of depressed patients. Naturalistic studies on the other hand, despite being susceptible to the effect of confounding factors, may provide information more relatable to the real-world clinical picture.
Therefore, in the present study, our objective was to investigate cortical and sub-cortical GM regional volumes associated with drug treatment response in a large sample of MDD inpatients in a naturalistic clinical setting. We employed a whole-brain approach – with only a subsequent ROI-based analysis – with the aim of reducing the potential source of bias determined from the a priori choice of ROIs. The choice of ROIs was based on brain regions previously reported to affect MDD treatment response (). Furthermore, in a subsample of patients with available resting state functional MRI (rs-fMRI) data, we investigated the association between whole-brain rs-FC patterns and antidepressant response.
Methods
Participants
We studied 100 inpatients (F = 66; M = 34) with a diagnosis of MDD (DSM IV-TR criteria), consecutively admitted for a Major Depressive Episode (Table 1) to the Mood Disorder Unit at San Raffaele Hospital in Milan. Patients were referred for hospital treatment of a depressive episode by their general practitioners or psychiatrists in charge, and admitted after an interview with a staff psychiatrist. A significant proportion of patients was already receiving some form of drug treatment at the time of admission (Table 1). The discharge from the hospital occurred when their psychopathological conditions allowed for the continuation of treatment at home. Severity of depressive symptomatology was assessed via the 21-item Hamilton depression rating scale (HDRS), both at admission and discharge, by a trained psychiatrist ().
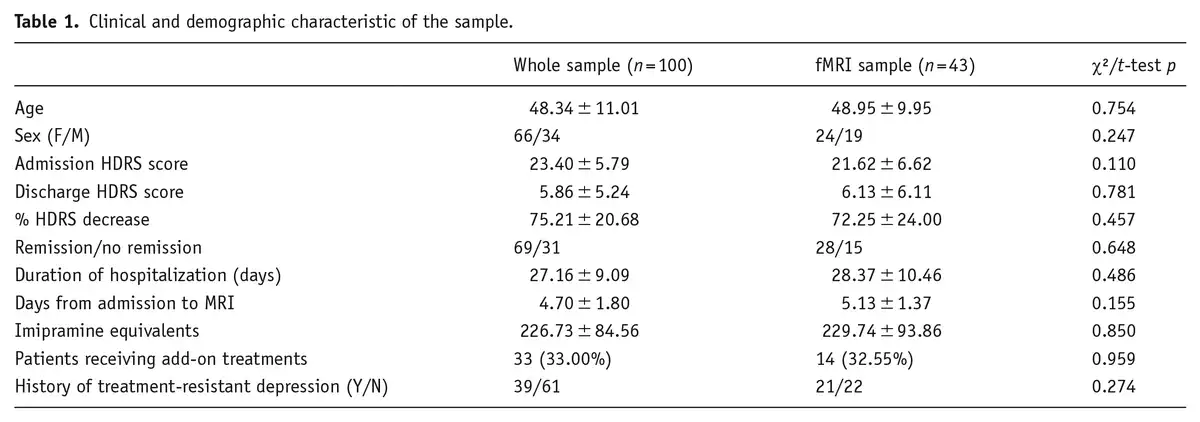
All patients underwent a 3 T MRI scan within the first week upon admission. For 43 patients resting-state fMRI images were also acquired.
Exclusion criteria were age below 18 or above 70, additional diagnoses on axis I, mental retardation on axis II, pregnancy, major medical and neurological disorders, history of drug or alcohol abuse or dependency, and additional therapies besides drug treatment received during the hospital stay.
As commonly seen in MDD a relatively large proportion of our sample (21%) had a previous positive history of suicide attempt; however, after reviewing the attempts details no case of methods involving clear brain oxygen deprivation was identified.
Treatment was administered by the psychiatrist in charge of the patient upon clinical need. Patients were prescribed at least one antidepressant drug: according to our standard treatment protocols, selective serotonin reuptake inhibitors (SSRIs) were preferentially administered; drugs acting on serotonin and norepinephrine (serotonin-norepinephrine reuptake inhibitors, SNRIs) and tricyclic antidepressants were administered to patients who had not responded to SSRIs in their previous clinical history (). Add-on treatments for depression (bupropion, mirtazapine, low dosage aripiprazole or amisulpride, lithium) (), benzodiazepines and other hypnotic drugs were prescribed upon clinical need (Table 1 and Supplemental Table 1).
Drug treatment upon discharge was recorded for each patient; antidepressant dosages were converted into the equivalent dose of imipramine ().
After a complete description of the study was given to the participants, written informed consent was obtained. All the research activities were approved by the local ethical committee.
MRI data acquisition and preprocessing
T1 and T2*-weighted images were acquired on two 3.0 T scanners: 46 patients underwent a 3 T MRI scan in a Gyroscan Intera scanner, Philips, The Netherlands employing an eight channels SENSE head coil (T1-weighted MPRAGE sequences: TR 25.00 ms, TE 4.6 ms, field of view (FOV) = 230 mm, matrix = 256 × 256, in-plane resolution 0.9 × 0.9 mm, yielding 220 transversal slices with a thickness of 0.8 mm); 54 patients were acquired in a 3T Ingenia CX scanner, Philips, The Netherlands using a 32-channel sensitivity encoding SENSE head coil (T1-weighted MPRAGE sequence: TR 8.00 ms, TE 3.7 ms, FOV = 256 mm, matrix = 256 × 256, in-plane resolution 1 × 1 mm, yielding 182 transversal slices with a thickness of 1 mm).
For voxel-based morphometry (VBM) and ROI-based measures, images were processed by using the Computational Anatomy Toolbox (CAT12) preprocessing pipeline () for statistical parametric mapping 12 (SPM12) (https://www.fil.ion.ucl.ac.uk/spm/) in Matlab R2016b, which also allows for the extraction of ROIs tissue volumes. This included segmentation into GM, white matter, and cerebrospinal fluid, bias regularization, non-linear modulation, and normalization to Montreal Neurological institute and Hospital (MNI) space using DARTEL to a 1.5 mm isotropic MNI template. GM images were smoothed with an 8 mm full width at half maximum Gaussian filter. Measures of total intracranial volume (TIV) were obtained.
Specific ROIs previously reported to influence treatment response in MDD were then selected (bilateral hippocampi, amygdalae and anterior cingulate cortex); their volumes were estimated according to the Neuromorphometrics Atlas and converted into percentage of TIV with the formula: (ROI Volume × 100)/TIV.
Regarding resting-state functional data, fMRI images included 200 sequential T2*-weighted volumes (interleaved ascending transverse slices covering whole brain, tilted 30° downward with respect to bicommissural line to reduce susceptibility artefacts in orbitofrontal region), acquired using an echo planar imaging pulse sequence (Repetition time (TR) = 2000 ms, echo time (TE) = 30 ms, flip angle = 85°, FOV = 192 mm, number of slices = 38, slice thickness = 3.7 mm, matrix size = 64 × 62 reconstructed up to 96 × 96 pixels). Six dummy scans before fMRI acquisition allowed obtaining longitudinal magnetization equilibrium. Total time of acquisition was 6 min and 56 s. T2*-weighted images were preprocessed using CONN toolbox (www.nitrc.org/projects/conn), running within SPM12. Preprocessing was performed according to a standard pipeline, which included: (i) realignment to a reference image in order to minimize variance due to head movements and unwarping; (ii) slice timing correction to ease temporal misalignment between slices; (iii) detection of potential outlier scans (subject motion above 0.9 mm and 0.02 rad or spikes in global signal intensity above five SD) by means of Artifact Detection Tool (ART, www.nitrc.org/projects/artifact_detect) – a threshold of 20% scans flagged as outliers was set to determine subject exclusion; (iv) normalization to a standard MNI space and segmentation of the brain into GM, white matter (WM) and cerebrospinal fluid (CSF) [tissues; (v) spatial smoothing with 8 mm full-width at half-maximum isotropic Gaussian kernel to improve the signal-to-noise ratio; (vi) removal of confounding effects via an anatomical component-based noise correction procedure (aCompCor), which involves WM, CSF, physiological noise source reduction (e.g. six standard motion parameters and ART-based ‘scrubbed’ signal artefacts) with relative derivatives, which were considered as covariates in first-level analyses; (vii) application of linear detrending for linear drift artefacts and high-frequency noise removal.
Statistical analysis
The percentage of HDRS decrease from hospital admission to discharge was calculated for each patient with the formula: ((HDRS T0 − HDRS T1) × 100)/HDRS T0.
We first investigated GM structures associated with change in depressive symptoms performing a VBM analysis. VBM is one of the most commonly applied techniques in neuroimaging studies (), allowing for a voxel-wise analysis of structural MRI data; furthermore it also allows for volumetric estimation of ROIs, yielding comparable accuracy when compared with Freesurfer or manual segmentation ().
VBM statistics were carried out within the general linear model framework, as implemented in SPM12: with no a priori ROI, percentage of HDRS decrease was entered as a variable of interest, and age, sex, baseline HDRS score, duration of hospitalization and antidepressant dose equivalents as nuisance covariates. Furthermore, to account for the two MRI scanners used, a ‘scanner’ covariate was added to all our analysis. After checking for design orthogonality, we applied global scaling transformation on intracranial volume (i.e. overall grand mean scaling) in accordance with CAT12 manual (http://www.neuro.uni-jena.de/cat12/CAT12-Manual.pdf). Absolute threshold masking was set at 0.01.
Provided that both smaller or larger GM volumes have been linked to treatment non-response (), the effect of percentage of HDRS decrease on GM volumes was initially tested in a two-sided F-contrast, with a Family Wise Error corrected threshold of significance (pFWE) < 0.05 at cluster level. Two post hoc one-sided T-contrast were then performed to test the positive or negative correlation of treatment response with brain volumes.
For the ROI values, considering the a priori expected interaction of categorical and continuous independent factors, we implemented a generalized linear model (GLZM) with a homogeneity of slope regression design and an identity link function (), entering the percentage of HDRS decrease as the dependent variable and normalized ROI volumes as independent variables; the same nuisance covariates used for the VBM analysis were entered into the model (age, sex, scan, admission HDRS score, duration of hospitalization and antidepressant dose equivalents). Parameter estimates were obtained with least squares maximum likelihood procedures. The significance of the effects was calculated with the likelihood ratio statistic (). False discovery rate (FDR) correction was applied via the Benjamini–Hochberg procedure (). All the statistical analyses were performed with a commercially available software package (StatSoft Statistica 12, Tulsa, OK, USA).
Finally, fc-MVPA was implemented to explore the whole-brain rs-FC patterns associated with treatment response. Unlike commonly used multivariate pattern recognition approaches, such as machine learning classifiers, that extract information about the condition of interest from multivariate patterns (i.e. backward models), fc-MVPA is a forward model since it derives the shape of functional connectivity patterns specifically associated with the condition (). For each voxel, fc-MVPA estimates the functional connectivity maps between this voxel and the rest of the brain. Principal component analysis is then performed on subject’s connectivity maps to derive the low-dimensional representations that best capture the voxel-specific variability in functional connectivity patterns across individuals. A multivariate hypothesis testing is then performed on the lower-dimensional scores to assess differences between subjects in functional connectivity patterns. This procedure is repeated for each voxel in the brain to determine which brain regions show whole-brain between-subjects differences in functional connectivity patterns ().
First-level fc-MVPA was performed using 64 dimensions. fc-MVPA-derived maps were then entered in the second-level analyses to examine the effect of percentage of HDRS decrease, including age, sex, scan, baseline HDRS score, duration of hospitalization and antidepressant dose equivalents as nuisance covariates. The resulting regions of significance represent clusters of voxels with similar between-subject variance in their spatial connectivity patterns in relation to the reduction of depressive symptomatology after treatment. Considering sample size, three components were kept for each voxel. Analyses were thresholded at peak level (p < 0.001, uncorrected; cluster level: p < 0.05 FWE-corrected). Since fc-MVPA is an omnibus test, post hoc seed-based connectivity analyses were performed considering the identified fc-MVPA clusters as seeds to explore how their functional connectivity with the rest of the brain changes according to the percentage of HDRS decrease.
To account for the non-linear relation between age and brain structure, all analyses were repeated adding age squared as a nuisance covariate. Furthermore, we performed an additional analysis on a subsample of patients with an age cut-off of 60 (n = 85). Additional analyses were also performed adding number of previous depressive episodes and history of treatment resistant depression (TRD) as nuisance covariates (see Supplemental Results).
Results
Clinical and demographic characteristics of the sample are summarized in Table 1. While we identified no differences between the whole sample and the fMRI subsample, when directly comparing patients with functional sequences with those with only structural sequences available, the latter exhibited higher baseline HDRS scores and a slightly lower time elapsed from hospital admission to MRI acquisition (Supplemental Table 3). Thirty-nine patients had a positive history for TRD, defined as failure to respond to a minimum of two treatments with adequate dosing and duration (). Eighty-nine patients were already receiving AD drug treatment at the time of depressive relapse and admission; on the other hand, 11 patients were prescribed AD for the first time upon admission. Sixty-nine patients achieved episode remission upon discharge (HDRS score ≤7), while 31 did not. The decrease in depressive symptoms was negatively correlated to the duration of hospitalization (r = −0.36, p < 0.001) and to the amount of prescribed antidepressants (r = −0.26, p = 0.008), possibly reflecting difficulty to treat.
Regional GM volumes associated with the decrease in the severity of depressive psychopathology. In the VBM analysis, the two-sided contrast identified two statistically significant clusters: the first encompassed the right superior and middle temporal gyrus and the temporal pole (cluster level pFWE < 0.001, k = 2097, F = 27.51); the second cluster comprised the left hippocampus and parahippocampal gyrus, left superior temporal gyrus and temporal pole (cluster level pFWE = 0.001, k = 1779, F = 19.76).
Post hoc one-tailed t tests analyses identified no cluster of negative correlation between percent HDRS decrease and brain volumes; while it confirmed a positive correlation analysis in the two clusters identified in the F-contrast (Cluster 1: right superior, middle and inferior temporal gyrus and temporal pole, cluster level pFWE < 0.001, k = 3503, T = 5.24; Cluster 2: left hippocampus and parahippocampal gyrus, left superior temporal gyrus and temporal pole, cluster level pFWE < 0.001, k = 2942, T = 4.44) (Table 2, Figure 1).
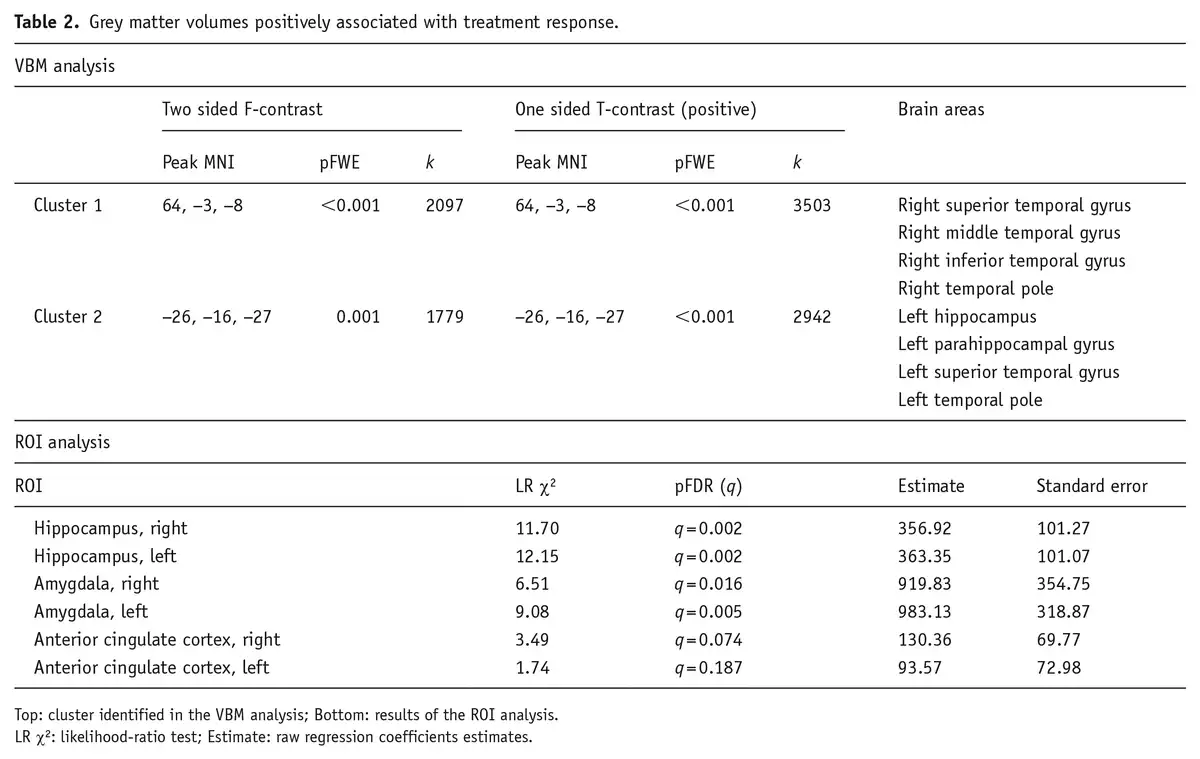
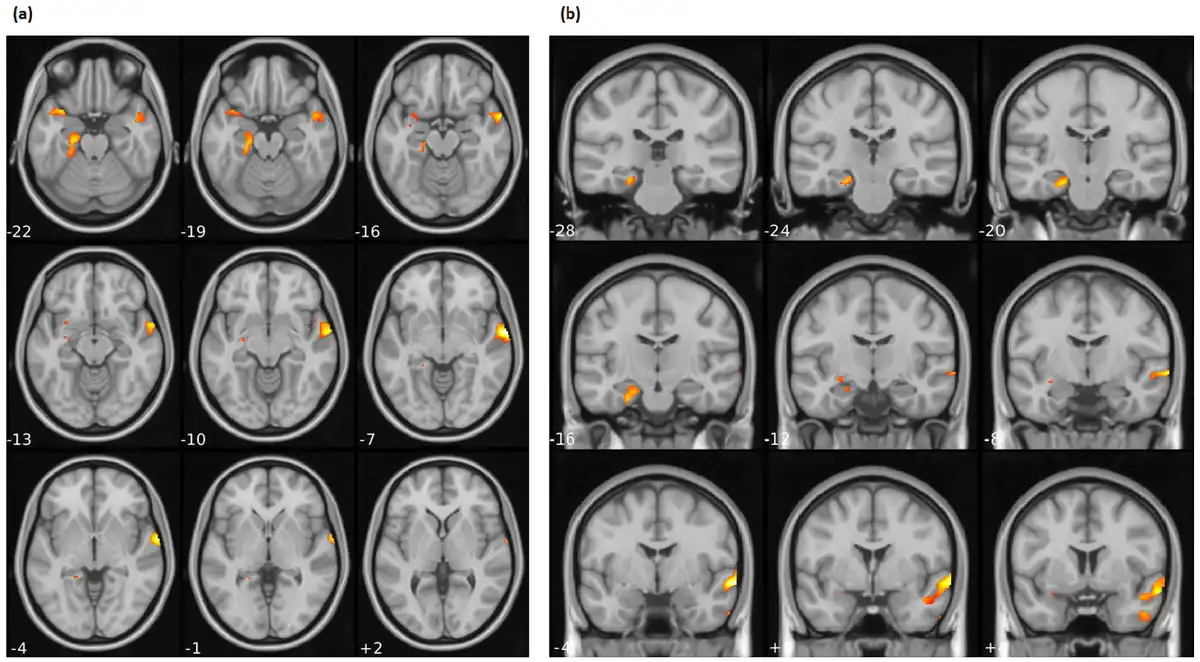
Figure 1
Brain regions identified in the VBM analysis where HDRS percentage decrease positively associated with regional GM volumes: (a) axial and (b) coronal.
These effects were confirmed when studying the relationship between GM volumes in ROIs and changes of HDRS scores with a multiple regression approach in the context of the GLZM. Worse AD treatment response, indicated by a lower percentage of HDRS decrease, was predicted by lower baseline volumes of bilateral hippocampi (Right: LR χ2 = 11.70, q = 0.002; Left: LR χ2 = 12.15, q = 0.002) and amygdalae (Right: LR χ2 = 6.51, q = 0.016; Left: LR χ2 = 9.08, q = 0.005). No effect was observed for ACC (Table 2).
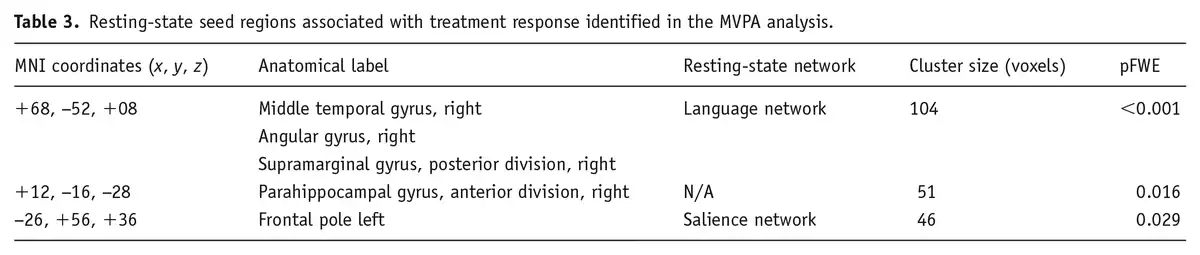
Resting-state functional connectivity also associated with percentage of HDRS decrease. Specifically, fc-MVPA analysis identified three clusters where changes in HDRS scores were significantly associated with rs-FC, which were localized in the right middle temporal gyrus (pFWE < 0.001), the right parahippocampal gyrus (pFWE = 0.016) and the left frontal pole (pFWE = 0.029) (see Figure 2 and Table 3). Post hoc seed-based analyses showed that HDRS decreases were negatively associated with rs-FC between the right middle temporal gyrus and regions located in the salience and sensorimotor networks, whereas the opposite pattern was observed for four clusters in the DMN. Considering the right parahippocampal gyrus as seed, the percentage of HDRS decrease negatively associated with connectivity to the DMN, while positively influenced connectivity with the dorsal attention and visual networks. A similar pattern was observed for the left frontal pole, where changes in the HDRS scores negatively affected the connectivity with a cluster in the DMN and positively associated with connectivity to clusters in the dorsal attention, cerebellar and sensorimotor networks (for detailed effects, see Figure 2 and Supplemental Table 2).
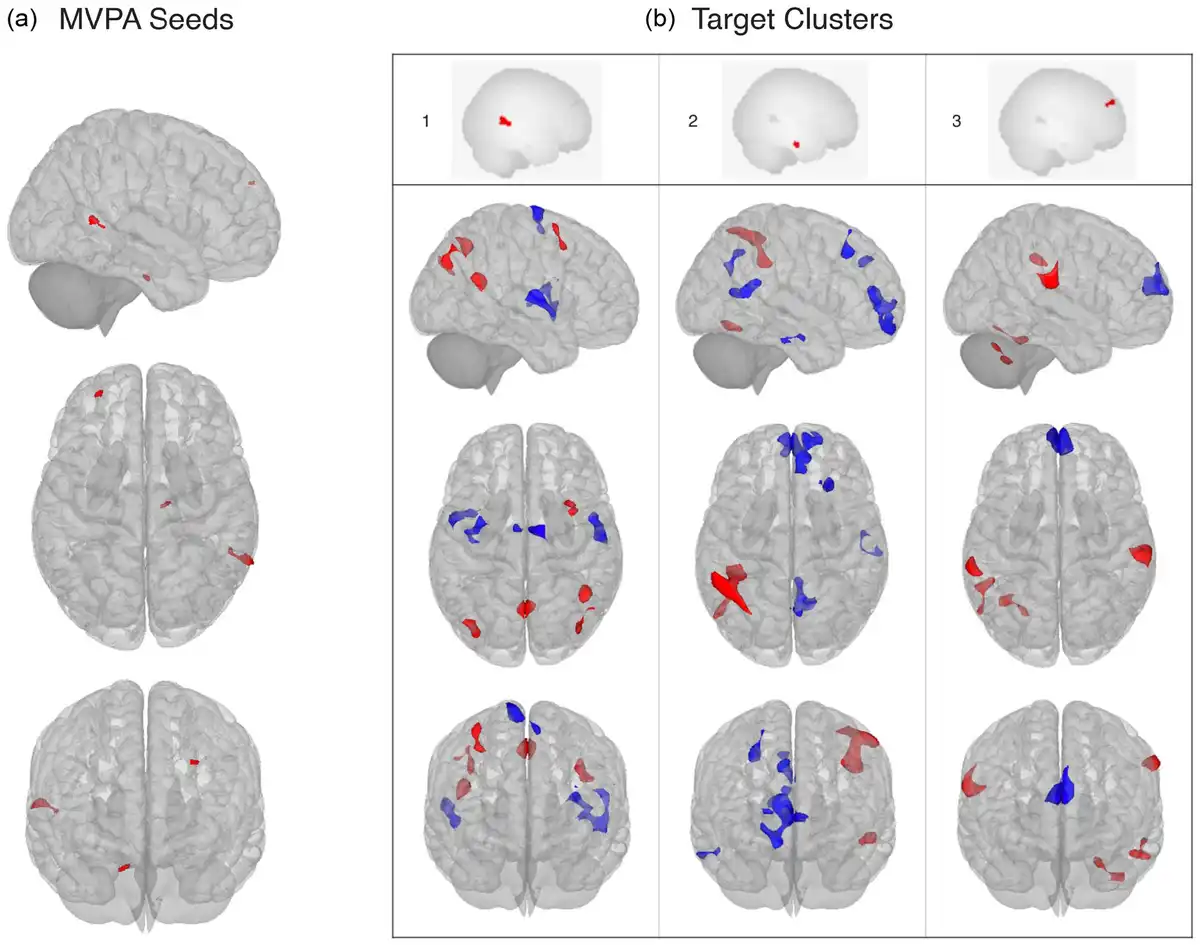
Figure 2
Association between Hamilton depression rating scale percentage decrease and resting-state functional connectivity from fc-MVPA seeds to target clusters: (a) seeds identified in the multivariate pattern connectivity analysis and (b) results of the post hoc seed-based connectivity analysis. 1: middle temporal gyrus, R; 2: parahippocampal gyrus, R; 3: frontal pole, L.
Supplementary analyses were conducted to account for (1) the non-linear relation between brain volumes and age (entering age squared as a nuisance covariate and performing a second analysis on a subsample of patients with an age cut-off of 60), (2) the recurrence of depression (entering the number of previous depressive episodes as a nuisance covariate) and (3) a previous history of TRD (entering history of TRD as a nuisance covariate). Results largely overlapped those of the main analyses with the exception of the VBM analysis in the subsample, in which the left hippocampus exhibited only a trend towards significance (p = 0.051), and the rs-fMRI analysis with history of TRD as an additional covariate, in which the left parahippocampal cluster was no longer significant (see Supplemental Result).
Discussion
The main finding of the present study is that regional brain GM volumes at hospital admission associate with response to antidepressant treatment in patients with MDD. In particular, larger hippocampal volumes were found to be associated with better antidepressant response. This effect was first identified for the left hippocampus and parahippocampal cortex in the whole-brain VBM analysis, and confirmed in the ROI analysis, with lower volumes of both hippocampi predicting worse treatment response.
A predictive effect of hippocampal GM volumes on antidepressant response is in accordance with several previous studies performed on smaller samples (), using MRI scans with lower magnetic field strength () or not employing a voxel-wise approach ().
Lower hippocampal volumes are a common finding in patients suffering from MDD () and have also been correlated with the duration of untreated depressive episodes (). Two recent meta-analyses specifically identified lower volumes of the left hippocampus as a structural characteristic of MDD (; ).
Two main hypotheses have been put forward to explain reduced hippocampal volumes in MDD: the neuroplasticity hypothesis connects volume reduction to morphological changes in hippocampal neurons, while the neurogenesis hypothesis postulates that reduced formation of new neurons in the dentate gyrus is responsible for volumetric reductions. Elevated glucocorticoid levels in response to chronic stress are thought to play a role in both postulations ().
A widely held view today is that antidepressant drug treatment may exert its effect, at least partially, by increasing hippocampal neuroplasticity and possibly neurogenesis, thus opposing or even reversing the effects of stress on the brain. The ability of multiple classes of AD treatments and ECT to increase hippocampal neurogenesis has been repeatedly demonstrated and has been hypothesized to be their common mechanism of action (). Furthermore, preclinical studies demonstrated that impaired hippocampal neurogenesis – obtained via X-irradiation of the mouse brain – cancelled the beneficial effects of antidepressants on depressive-like behaviours (). We can therefore speculate that impaired hippocampal neuroplasticity/neurogenesis homeostatic mechanisms in our patients, possibly revealed by lower hippocampal volumes upon brain MRI, could be responsible for the blunted antidepressant treatment response.
Our VBM analysis also identified a second cluster, comprising the right superior and middle temporal gyri, in which greater volumes were associated with better response. This result contradicts two previous studies that found lower volumes in these brain regions associated with better antidepressant treatment response (; ). However, a recent meta-analysis stressed the need to investigate the relation between right temporal areas and response in depression, provided that only these two studies reported significant associations, that the direction of the effect is opposite to what is usually found and expected, and that no analogous result has been identified for studies investigating structural correlates or treatment response to ECT or cognitive behavioral therapy (CBD) (). Following the publication of the meta-analysis, a new VBM study identified lower volumes of the right superior temporal gyrus in non-responders MDD patients (); therefore, our result appears to be in line with this latter study, associating volumetric reductions in right temporal areas to worse treatment response.
Lower GM volumes in bilateral temporal regions appear to be a consistent finding in patients with MDD (; ) and have also been reported in patients with treatment-resistant depression (; ). Lower volumes of the right superior temporal gyrus have also been repeatedly associated with a history of suicide attempts in adolescents and have been proposed as a marker of suicidality in this age group (; ). Interestingly, albeit this association being still controversial, suicidal ideation and behaviour have been reported to occasionally worsen after antidepressant treatment in adolescents and young adults ().
The superior and middle temporal gyri and the temporal pole, while classically thought to be implicated in sensory information processing, are also important for emotional processing and social cognition (). Volumetric reductions in these areas could therefore contribute to the impaired emotional and memory processing in depression, and also have an impact on symptomatology resolution after treatment.
In our ROI analysis, bilateral amygdala volumes were found to predict depressive symptom reductions. The amygdala is one of the primary sites for emotion regulation () yet despite being anatomically and functionally close to the hippocampus, previous results on amygdale volumes and treatment response in depression are much less consistent. The amygdalae have been shown to have lower volumes in MDD patients compared to healthy controls (HC) and to increase after successful drug or ECT treatment (; ; ). Larger pre-treatment amygdala volumes have also been shown to predict better ECT treatment response (; ). Yet, at the same time, reports of larger amygdala volumes in treatment-resistant patients compared to treatment-responsive individuals and healthy controls () have been published, while other studies found no effect of amygdala volumes on treatment response (). Interestingly, a meta-analysis reported increased amygdale volumes in medicated depressed patients and decreased volumes in un-medicated ones when compared to healthy controls, prompting the authors to hypothesize an antidepressant-mediated increase of neurotrophic factors and neurogenesis with protective activity against stress-related neurotoxicity ().
Finally, both in the VBM and in the ROI analysis, we found no effect for ACC volumes on treatment response. Reduced GM volumes of the ACC are an established structural correlate in MDD patients (). At the same time, their relationship with treatment response is much less clear, with studies reporting lower volumes associated with lower rates of response (; ; ), while others fail to find such an association, as we did (; ; ).
Findings from VBM and ROI analyses were also paralleled by analogous results from fc-MVPA, providing preliminary insights on a possible association between structural and functional correlates of treatment response. Responsiveness to treatment increased the rs-FC between the middle temporal gyrus and regions located in the DMN, whereas the inverse pattern was observed for the salience and sensorimotor networks. Although previous studies on treatment response found that lower within-network DMN connectivity was associated with better treatment outcomes (), other studies in late-life depression reported increased DMN connectivity in lateral and posterior regions, including the middle temporal gyrus, and decreased DMN connectivity in frontal areas following Venlafaxine and escitalopram treatment (; ). These findings suggest that antidepressant medications induce a ‘rebalance’ of DMN connectivity by increasing the functional connectivity in the posterior portions of the DMN while decreasing the frontal ones (; ).
Treatment response also influenced functional connectivity in the frontal pole, which is commonly thought to play a key role in self-reflection, long-term goals, past or future events or hypothetical scenarios (). In treatment-resistant MDD patients, the frontal pole has been shown to be functionally hyperconnected with the DMN and disconnected with regions located in the salience networks (), and reduction of frontal pole neural activity has been proposed as an index of success of neuromodulation techniques () and cognitive-behavioural therapy (). Interestingly, in treatment-resistant depressive patients, the frontal pole is functionally hyperconnected with the DMN and disconnected with regions located in the salience networks (). Our results are in line with these findings, suggesting that lower baseline functional connectivity between the frontal pole and the DMN might promote successful treatment response.
Finally, we also found that rs-FC of the right parahippocampal gyrus was modulated by response to treatment. Lower activation and smaller GM volume in this region have been previously linked to impairments in contextual associations and negative thinking in depression, possibly representing a candidate neural correlate of rumination in MDD (). Considering the relationship with response to antidepressant treatments, a recent meta-analysis of fMRI studies highlighted the role of hippocampal structures in predicting treatment outcomes in MDD (). Specifically, increased short-range functional connectivity strength in the right parahippocampal gyrus was observed after 8 weeks of escitalopram treatment, suggesting that antidepressant treatment normalizes the diminished parahippocampal rs-FC observed in MDD patients at the baseline (; ). Our results further support this evidence, underlining the role of the parahippocampal gyrus as a target for antidepressant treatments.
Supplementary analyses were conducted to account for the non-linear relation between age and brain volumes, recurrence and previous history of TRD; they largely confirmed our results, with the exception of the VBM analysis performed on a younger subsample, where left hippocampal volumes had only a trend towards significance; this might suggest that hippocampal volumes have a stronger effect on treatment response with increased age. However, conducting the ROI analysis in the subsample, lower bilateral hippocampal volumes were still found to affect treatment efficacy.
Concerning resistant depression, as to be expected in real-world clinical settings, patients presented various levels of resistance to previous treatments. Our study focused on brain correlates associated with response to the current depressive episode, but we acknowledge that a previous history of resistance might have a strong impact in this regard. A positive history of TRD didn’t appear to significantly influence the association between brain structure and response to the current episode; however, the addition of the TRD covariate to the rs-fMRI analysis rendered the influence of the parahippocampal cluster on response no longer significant. Future studies with larger rs-fMRI samples could properly address this issue, investigating functional connectivity patterns in TRD and non-TRD patients.
This study has several limitations. The recruitment in a single centre and the absence of a control group limit the generalizability of our findings: in particular, we cannot infer how the response correlates we identified would compare to brain structure and function of healthy volunteers. Furthermore, given the naturalistic design of our study, we couldn’t implement methods commonly used in RCTs to reduce possible sources of bias, such as randomization, blinding and the presence of a placebo group.
Subjects were administered a wide variety of drug treatments after admission: we tried to control for the effect of antidepressant doses using imipramine equivalents, but we couldn’t control for the whole complexity of prescribed drug treatments, nor we could account for the effect of drugs prescribed before hospital admission. As commonly seen in MDD, a relatively large proportion of our sample (21%) had a previous positive history of suicide attempt, which could be affected of affect brain structure (); however, after reviewing the suicide attempts details no case of methods involving clear brain oxygen deprivation was identified.
Depressive symptomatology wasn’t assessed at fixed intervals but at admission and discharge, possibly entering a source of bias in our results. However, the degree of change in depressive symptoms was inversely correlated to duration of hospitalization and dose of antidepressant prescribed, suggesting a link with resistance of each patient to prescribed pharmacotherapies. Resting-states fMRI sequences were available only for a subset of patients. Future studies including larger cohorts and multicentre consortia are needed to provide more reliable and realistic functional markers of treatment response also useful in clinical practice.
In our study we observed relatively high rates of clinical improvements. This must be seen in light of several elements: patients that received physical therapies (electroconvulsive therapy or transcranial magnetic stimulation), by definition resistant to drug treatments, were excluded from the analysis; furthermore, given the real-world nature of our study, no limitations were set on possible drug treatments administered and time of hospital stay, and most patients were discharged only after a significant clinical improvement. Our results appear in any case to be in line with previously reported remission rates in MDD patients of 65%–70% after multiple treatments (). Furthermore, albeit the majority of patients (69%) reached episode remission, it is worth noting that the employed remission criteria (HDRS scores ≤7) is not synonymous with the absence of symptoms, and several studies stress the presence of residual symptoms in remitted MDD patients ().
Finally, the investigation was performed in a real-world setting: this approach has some undoubtable drawbacks, as it increases the heterogeneity of the sample, by definition lacks a control group and the possibility to randomize patients, rendering harder to establish a clear connection between the various treatments administered and the patients’ response. At the same time, compared to studies employing a single drug treatment with a fixed schedule, our study may provide information better connected to a realistic clinical setting and possibly closer to a translation into clinical practice.
Our study suggests that baseline structure and function of several limbic regions (hippocampus, parahippocampal gyrus and amygdala) affect patterns of response to drug treatment in MDD patients. Such regions have previously been found to be involved in MDD pathogenesis and antidepressant efficacy, and here we confirmed this association in a naturalistic setting with a multimodal neuroimaging approach. Furthermore, we identified a similar convergence of structural and functional data on regions located in the right temporal cortex, whose association with MDD treatment response is much less clear. Our results indicate that baseline volumetric reductions and patterns of resting-state functional connectivity of such regions also influence drug treatment efficacy in MDD patients.
While we are still far from routine use of MRI biomarkers of treatment response in clinical practice, more studies are providing promising results for their applicability. Larger multicentric studies are needed to confirm these MRI correlates of treatment response and evaluate their possible role in informing and guiding real-world therapeutic choices.
Not applicable.
Declaration of conflicting interests The author(s) declared no potential conflicts of interest with respect to the research, authorship, and/or publication of this article.
Funding The author(s) disclosed receipt of the following financial support for the research, authorship, and/or publication of this article: MP salary: Italian Ministry of University, XXXVI PhD cycle. FC salary: Italian Ministry of University, XXXVII PhD cycle. YH salary: Italian Ministry of University, XXXVII PhD cycle, FSE REACT-EU 2021 PON projects, Action IV.5. This work was supported by the European Union H2020 EU.3.1.1 grant 754740 MOODSTRATIFICATION, the Italian Ministry of Health, grant RF-2018-12367249 and the Italian Ministry of University and Scientific Research, grant A_201779W93T.
Marco Paolini
https://orcid.org/0000-0001-5731-5925
Data availability Data available upon request.
Supplemental material Supplemental material for this article is available online.
References
- Abdallah CG, Salas R, Jackowski A, et al. (2015) Hippocampal volume and the rapid antidepressant effect of ketamine. Journal of Psychopharmacology 29: 591–595.
- Addis DR, Wong AT, Schacter DL (2007) Remembering the past and imagining the future: Common and distinct neural substrates during event construction and elaboration. Neuropsychologia 45: 1363–1377.
- An J, Wang L, Li K, et al. (2017) Differential effects of antidepressant treatment on long-range and short-range functional connectivity strength in patients with major depressive disorder. Scientific Reports 7: 10214.
- Bartlett EA, DeLorenzo C, Sharma P, et al. (2018) Pretreatment and early-treatment cortical thickness is associated with SSRI treatment response in major depressive disorder. Neuropsychopharmacology 43: 2221–2230.
- Benjamini Y, Hochberg Y (1995) Controlling the false discovery rate: A practical and powerful approach to multiple testing. Journal of the Royal Statistical Society: Series B (Methodological) 57: 289–300.
- Boku S, Nakagawa S, Toda H, et al. (2018) Neural basis of major depressive disorder: Beyond monoamine hypothesis. Psychiatry and Clinical Neurosciences 72: 3–12.
- Bollini P, Pampaliona S, Tibaldi G, et al. (1999) Effectiveness of antidepressants: Meta-analysis of dose-effect relationships in randomised clinical trials. The British Journal of Psychiatry 174: 297–303.
- Brent DA (2016) Antidepressants and suicidality. The Psychiatric Clinics of North America 39: 503–512.
- Campbell S, Marriott M, Nahmias C, et al. (2004) Lower hippocampal volume in patients suffering from depression: A meta-analysis. American Journal of Psychiatry 161: 598–607.
- Campos AI, Thompson PM, Veltman DJ, et al. (2021) Brain correlates of suicide attempt in 18,925 participants across 18 international cohorts. Biological Psychiatry 90: 243–252.
- Chen C-H, Ridler K, Suckling J, et al. (2007) Brain imaging correlates of depressive symptom severity and predictors of symptom improvement after antidepressant treatment. Biological Psychiatry 62: 407–414.
- Chin Fatt CR, Jha MK, Cooper CM, et al. (2020) Effect of intrinsic patterns of functional brain connectivity in moderating antidepressant treatment response in major depression. American Journal of Psychiatry 177: 143–154.
- GBD 2019 Mental Disorders Collaborators (2022) Global, regional and national burden of 12 mental disorders in 204 countries and territories, 1990–2019: A systematic analysis for the Global Burden of Disease Study 2019. The Lancet Psychiatry 9: 137–150.
- Cullen KR, Klimes-Dougan B, Vu DP, et al. (2016) Neural correlates of antidepressant treatment response in adolescents with major depressive disorder. Journal of Child and Adolescent Psychopharmacology 26: 705–712.
- Dichter GS, Gibbs D, Smoski MJ (2015) A systematic review of relations between resting-state functional-MRI and treatment response in major depressive disorder. Journal of Affective Disorders 172: 8–17.
- Douaud G, Lee S, Alfaro-Almagro F, et al. (2021) SARS-CoV-2 is associated with changes in brain structure in UK Biobank. Nature 604: 697–707.
- Downar J, Daskalakis ZJ (2013) New targets for rTMS in depression: A review of convergent evidence. Brain Stimulation 6: 231–240.
- Dunlop BW, Rajendra JK, Craighead WE, et al. (2017) Functional connectivity of the subcallosal cingulate cortex and differential outcomes to treatment with cognitive-behavioral therapy or antidepressant medication for major depressive disorder. American Journal of Psychiatry 174: 533–545.
- Enneking V, Leehr EJ, Dannlowski U, et al. (2020) Brain structural effects of treatments for depression and biomarkers of response: A systematic review of neuroimaging studies. Psychological Medicine 50: 187–209.
- Fettes PW, Moayedi M, Dunlop K, et al. (2018) Abnormal functional connectivity of frontopolar subregions in treatment-nonresponsive major depressive disorder. Biological Psychiatry: Cognitive Neuroscience and Neuroimaging 3: 337–347.
- Friedrich MJ (2017) Depression is the leading cause of disability around the world. JAMA 317: 1517.
- Fu CHY, Costafreda SG, Sankar A, et al. (2015) Multimodal functional and structural neuroimaging investigation of major depressive disorder following treatment with duloxetine. BMC Psychiatry 15: 82.
- Gaser C, Dahnke R, Thompson PM, et al. (2022) CAT-a computational anatomy toolbox for the analysis of structural MRI data. BioRxiv.
- Ge R, Blumberger DM, Downar J, et al. (2017) Abnormal functional connectivity within resting-state networks is related to rTMS-based therapy effects of treatment resistant depression: A pilot study. Journal of Affective Disorders 218: 75–81.
- Gerlach AR, Karim HT, Peciña M, et al. (2022) MRI predictors of pharmacotherapy response in major depressive disorder. NeuroImage: Clinical 36: 103157.
- Goldstein-Piekarski AN, Staveland BR, Ball TM, et al. (2018) Intrinsic functional connectivity predicts remission on antidepressants: A randomized controlled trial to identify clinically applicable imaging biomarkers. Translational Psychiatry 8: 57.
- Gray JP, Müller VI, Eickhoff SB, et al. (2020) Multimodal abnormalities of brain structure and function in major depressive disorder: A meta-analysis of neuroimaging studies. American Journal of Psychiatry 177: 422–434.
- Green RC, Cupples LA, Kurz A, et al. (2003) Depression as a risk factor for Alzheimer disease: The MIRAGE Study. Archives of Neurology 60: 753–759.
- Grimm O, Pohlack S, Cacciaglia R, et al. (2015) Amygdalar and hippocampal volume: A comparison between manual segmentation, Freesurfer and VBM. Journal of Neuroscience Methods 253: 254–261.
- Gryglewski G, Baldinger-Melich P, Seiger R, et al. (2019) Structural changes in amygdala nuclei, hippocampal subfields and cortical thickness following electroconvulsive therapy in treatment-resistant depression: Longitudinal analysis. The British Journal of Psychiatry 214: 159–167.
- Hamilton JP, Siemer M, Gotlib IH (2008) Amygdala volume in major depressive disorder: A meta-analysis of magnetic resonance imaging studies. Molecular Psychiatry 13: 993–1000.
- Hamilton M (1960) A rating scale for depression. Journal of Neurology, Neurosurgery, and Psychiatry 23: 56–62.
- Hansen R, Gaynes B, Thieda P, et al. (2008) Meta-analysis of major depressive disorder relapse and recurrence with second-generation antidepressants. Psychiatric Services 59: 1121–1130.
- Harel EV, Tennyson RL, Fava M, et al. (2016) Linking major depression and the neural substrates of associative processing. Cognitive, Affective, & Behavioral Neuroscience 16: 1017–1026.
- Hasin DS, Sarvet AL, Meyers JL, et al. (2018) Epidemiology of adult DSM-5 major depressive disorder and its specifiers in the United States. JAMA Psychiatry 75: 336–346.
- Haufe S, Meinecke F, Görgen K, et al. (2014) On the interpretation of weight vectors of linear models in multivariate neuroimaging. NeuroImage 87: 96–110.
- Höflich A, Kraus C, Pfeiffer RM, et al. (2021) Translating the immediate effects of S-Ketamine using hippocampal subfield analysis in healthy subjects-results of a randomized controlled trial. Translational Psychiatry 11: 200.
- Israel JA (2010) The impact of residual symptoms in major depression. Pharmaceuticals 3: 2426–2440.
- Iwabuchi SJ, Auer DP, Lankappa ST, et al. (2019) Baseline effective connectivity predicts response to repetitive transcranial magnetic stimulation in patients with treatment-resistant depression. European Neuropsychopharmacology 29: 681–690.
- Jung J, Kang J, Won E, et al. (2014) Impact of lingual gyrus volume on antidepressant response and neurocognitive functions in major depressive disorder: A voxel-based morphometry study. Journal of Affective Disorders 169: 179–187.
- Kang S-G, Cho S-E. (2020) Neuroimaging biomarkers for predicting treatment response and recurrence of major depressive disorder. International Journal of Molecular Sciences 21: 2148.
- Karim H, Andreescu C, Tudorascu D, et al. (2017) Intrinsic functional connectivity in late-life depression: Trajectories over the course of pharmacotherapy in remitters and non-remitters. Molecular Psychiatry 22: 450–457.
- Katayama N, Nakagawa A, Umeda S, et al. (2022) Cognitive behavioral therapy effects on frontopolar cortex function during future thinking in major depressive disorder: A randomized clinical trial. Journal of Affective Disorders 298: 644–655.
- Kilpatrick LA, Krause-Sorio B, Siddarth P, et al. (2022) Default mode network connectivity and treatment response in geriatric depression. Brain and Behavior 12: e2475.
- Klimes-Dougan B, Schreiner MW, Thai M, et al. (2018) Neural and neuroendocrine predictors of pharmacological treatment response in adolescents with depression: A preliminary study. Progress in Neuro-Psychopharmacology and Biological Psychiatry 81: 194–202.
- Klok MPC, van Eijndhoven PF, Argyelan M, et al. (2019) Structural brain characteristics in treatment-resistant depression: Review of magnetic resonance imaging studies. BJPsych Open 5: e76.
- Kopelman J, Keller TA, Panny B, et al. (2023) Rapid neuroplasticity changes and response to intravenous ketamine: A randomized controlled trial in treatment-resistant depression. Translational Psychiatry 13: 159.
- Levy A, Taib S, Arbus C, et al. (2019) Neuroimaging biomarkers at baseline predict electroconvulsive therapy overall clinical response in depression: A systematic review. The Journal of ECT 35: 77–83.
- Li C, Hu Q, Zhang D, et al. (2022) Neural correlates of affective control regions induced by common therapeutic strategies in major depressive disorders: An activation likelihood estimation meta-analysis study. Neuroscience & Biobehavioral Reviews 137: 104643.
- Liu X, Gao X (2010) Effect of reproductive mode on host plant utilization of melon aphid (Hemiptera: Aphididae). Environmental Entomology 39: 1878–1883.
- Ma C, Ding J, Li J, et al. (2012) Resting-state functional connectivity bias of middle temporal gyrus and caudate with altered gray matter volume in major depression. PLoS One 7: e45263.
- MacQueen GM, Yucel K, Taylor VH, et al. (2008) Posterior hippocampal volumes are associated with remission rates in patients with major depressive disorder. Biological Psychiatry 64: 880–883.
- Malberg JE, Hen R, Madsen TM (2021) Adult neurogenesis and antidepressant treatment: The surprise finding by Ron Duman and the field 20 years later. Biological Psychiatry 90: 96–101.
- May A, Gaser C (2006) Magnetic resonance-based morphometry: A window into structural plasticity of the brain. Current Opinion in Neurology 19: 407–411.
- McCullagh P, Nelder J (1989) Generalized linear models, vol. 37 of monographs on statistics and applied probability London. London, UK: Chapman and Hall.
- McLellan Q, Wilkes TC, Swansburg R, et al. (2018) History of suicide attempt and right superior temporal gyrus volume in youth with treatment-resistant major depressive disorder. Journal of Affective Disorders 239: 291–294.
- Meng Q, Zhang A, Cao X, et al. (2020) Brain imaging study on the pathogenesis of depression and therapeutic effect of selective serotonin reuptake inhibitors. Psychiatry Investigation 17: 688–694.
- Middleton H, Shaw I, Hull S, et al. (2005) NICE guidelines for the management of depression. British Medical Journal Publishing Group 330: 267–268.
- Nieto-Castanon A (2022) Brain-wide connectome inferences using functional connectivity multivariate pattern analyses (fc-MVPA). PLoS Computational Biology 18: e1010634.
- Nogovitsyn N, Muller M, Souza R, et al. (2020) Hippocampal tail volume as a predictive biomarker of antidepressant treatment outcomes in patients with major depressive disorder: A CAN-BIND report. Neuropsychopharmacology 45: 283–291.
- Peng H, Wu K, Li J, et al. (2014) Increased suicide attempts in young depressed patients with abnormal temporal–parietal–limbic gray matter volume. Journal of Affective Disorders 165: 69–73.
- Phillips JL, Batten LA, Tremblay P, et al. (2015) A prospective, longitudinal study of the effect of remission on cortical thickness and hippocampal volume in patients with treatment-resistant depression. International Journal of Neuropsychopharmacology 18: pyv037.
- Rotella F, Mannucci E (2013) Depression as a risk factor for diabetes: A meta-analysis of longitudinal studies. The Journal of Clinical Psychiatry 74: 31–37.
- Sämann PG, Höhn D, Chechko N, et al. (2013) Prediction of antidepressant treatment response from gray matter volume across diagnostic categories. European Neuropsychopharmacology 23: 1503–1515.
- Sandu AL, Artiges E, Galinowski A, et al. (2017) Amygdala and regional volumes in treatment-resistant versus nontreatment-resistant depression patients. Depression and Anxiety 34: 1065–1071.
- Santarelli L, Saxe M, Gross C, et al. (2003) Requirement of hippocampal neurogenesis for the behavioral effects of antidepressants. Science 301: 805–809.
- Saragoussi D, Touya M, Haro JM, et al. (2017) Factors associated with failure to achieve remission and with relapse after remission in patients with major depressive disorder in the PERFORM study. Neuropsychiatric Disease and Treatment 13: 2151–2165.
- Schmaal L, Hibar D, Sämann PG, et al. (2017) Cortical abnormalities in adults and adolescents with major depression based on brain scans from 20 cohorts worldwide in the ENIGMA major depressive disorder working group. Molecular Psychiatry 22: 900–909.
- Schmaal L, Veltman DJ, van Erp TG, et al. (2016) Subcortical brain alterations in major depressive disorder: Findings from the ENIGMA major depressive disorder working group. Molecular Psychiatry 21: 806–812.
- Serra-Blasco M, Portella MJ, Gomez-Anson B, et al. (2013) Effects of illness duration and treatment resistance on grey matter abnormalities in majordepression. The British Journal of Psychiatry 202: 434–440.
- Sforzini L, Worrell C, Kose M, et al. (2022) A Delphi-method-based consensus guideline for definition of treatment-resistant depression for clinical trials. Molecular Psychiatry 27: 1286–1299.
- Sheline YI, Gado MH, Kraemer HC (2003) Untreated depression and hippocampal volume loss. American Journal of Psychiatry 160: 1516–1518.
- Straub J, Metzger CD, Plener PL, et al. (2017) Successful group psychotherapy of depression in adolescents alters fronto-limbic resting-state connectivity. Journal of Affective Disorders 209: 135–139.
- Takahashi T, Yücel M, Lorenzetti V, et al. (2010) An MRI study of the superior temporal subregions in patients with current and past major depression. Progress in Neuro-Psychopharmacology and Biological Psychiatry 34: 98–103.
- Takamiya A, Kishimoto T, Hirano J, et al. (2021) Neuronal network mechanisms associated with depressive symptom improvement following electroconvulsive therapy. Psychological Medicine 51: 2856–2863.
- Tang Y, Wang F, Xie G, et al. (2007) Reduced ventral anterior cingulate and amygdala volumes in medication-naive females with major depressive disorder: A voxel-based morphometric magnetic resonance imaging study. Psychiatry Research: Neuroimaging 156: 83–86.
- Taylor DM, Barnes TR, Young AH (2021) The Maudsley Prescribing Guidelines in Psychiatry. Hoboken, NJ: John Wiley & Sons.
- Ten Doesschate F, van Eijndhoven P, Tendolkar I, et al. (2014) Pre-treatment amygdala volume predicts electroconvulsive therapy response. Frontiers in Psychiatry 5: 169.
- Tendolkar I, van Beek M, van Oostrom I, et al. (2013) Electroconvulsive therapy increases hippocampal and amygdala volume in therapy refractory depression: A longitudinal pilot study. Psychiatry Research: Neuroimaging 214: 197–203.
- Van der Kooy K, van Hout H, Marwijk H, et al. (2007) Depression and the risk for cardiovascular diseases: Systematic review and meta analysis. International Journal of Geriatric Psychiatry 22: 613–626.
- van der Wijk G, Harris JK, Hassel S, et al. (2022) Baseline functional connectivity in resting state networks associated with depression and remission status after 16 weeks of pharmacotherapy: A CAN-BIND report. Cerebral Cortex 32: 1223–1243.
- Wang L, Xia M, Li K, et al. (2015) The effects of antidepressant treatment on resting-state functional brain networks in patients with major depressive disorder. Human Brain Mapping 36: 768–778.
- Wang Y, Bernanke J, Peterson BS, et al. (2019) The association between antidepressant treatment and brain connectivity in two double-blind, placebo-controlled clinical trials: A treatment mechanism study. The Lancet Psychiatry 6: 667–674.
- Warden D, Rush AJ, Trivedi MH, et al. (2007) The STAR* D Project results: A comprehensive review of findings. Current Psychiatry Reports 9: 449–459.
- Wise T, Radua J, Via E, et al. (2017) Common and distinct patterns of grey-matter volume alteration in major depression and bipolar disorder: Evidence from voxel-based meta-analysis. Molecular Psychiatry 22: 1455–1463.
- Xiao H, Yuan M, Li H, et al. (2021) Functional connectivity of the hippocampus in predicting early antidepressant efficacy in patients with major depressive disorder. Journal of Affective Disorders 291: 315–321.
- Zeng L-L, Shen H, Liu L, et al. (2012) Identifying major depression using whole-brain functional connectivity: A multivariate pattern analysis. Brain 135: 1498–1507.