INTRODUCTION
Infection is a common issue in intensive care units (ICUs) and is closely associated with high morbidity and mortality.[] ICU patients are at high risk of infection due to immunosuppression, the increasing use of invasive procedures, and the widespread use of broad-spectrum antibiotics. Together, these factors contribute to higher infections and higher infection-related mortality in ICU patients compared to those in general wards. Therefore, rapid and accurate identification of infectious agents, along with timely intervention, is crucial. Indeed, the etiological diagnosis of ICU infection puts forward higher requirements for timeliness and accuracy. That is, it is equally necessary to identify the pathogen at an early stage and to improve the sensitivity and specificity of the detection as much as possible. In this regard, traditional pathogen culture methods remain the gold standard for diagnosing bacterial and fungal infections; however, they have some inherent limitations, significantly hampering their clinical utility. For instance, protracted turnaround times (TATs), typically spanning 3-5 days, can potentially delay critical therapeutic interventions.[] Furthermore, their often inadequate sensitivity (low positivity rate) is particularly problematic for fastidious organisms, which is markedly pronounced following antibiotic exposure, frequently failing to provide a timely etiological diagnosis.[]
Next-generation sequencing (NGS), on the other hand, is an advanced technique that combines high-throughput sequencing with bioinformatics analysis. By sequencing deoxyribonucleic acid (DNA) or ribonucleic acid (RNA) from clinical samples, a single NGS test can accurately identify a broad spectrum of pathogens, including bacteria, fungi, viruses, and parasites.[,] NGS offers faster and more accurate results and provides significant advantages in diagnosing viruses and atypical pathogens. Studies have also shown that NGS is more sensitive than traditional pathogen culture methods in infected patients in general wards.[,] However, its clinical application remains limited. Moreover, studies on ICU patients in general are insufficient, and our study aims to fill this gap. Further studies are needed to confirm its diagnostic performance in severe infections.
This study directly compared the diagnostic performance of NGS against traditional pathogen culture methods in detecting pathogens in ICU patients with severe infections, evaluating both overall detection rates and performance for common infectious agents. Furthermore, we investigated the prognostic significance of NGS findings by assessing the association between NGS positivity and patient outcomes.
MATERIALS AND METHODS
Study design and ethical approval
This single-center, retrospective, non-interventional study was conducted at the ICU of Zhongnan Hospital of Wuhan University. The specific process is shown in Figure 1. The study protocol received ethical approval from the Institutional Review Board of Zhongnan Hospital of Wuhan University (Approval No. 2022112). Due to the retrospective nature of the data analysis, the requirement for individual patient informed consent was waived.
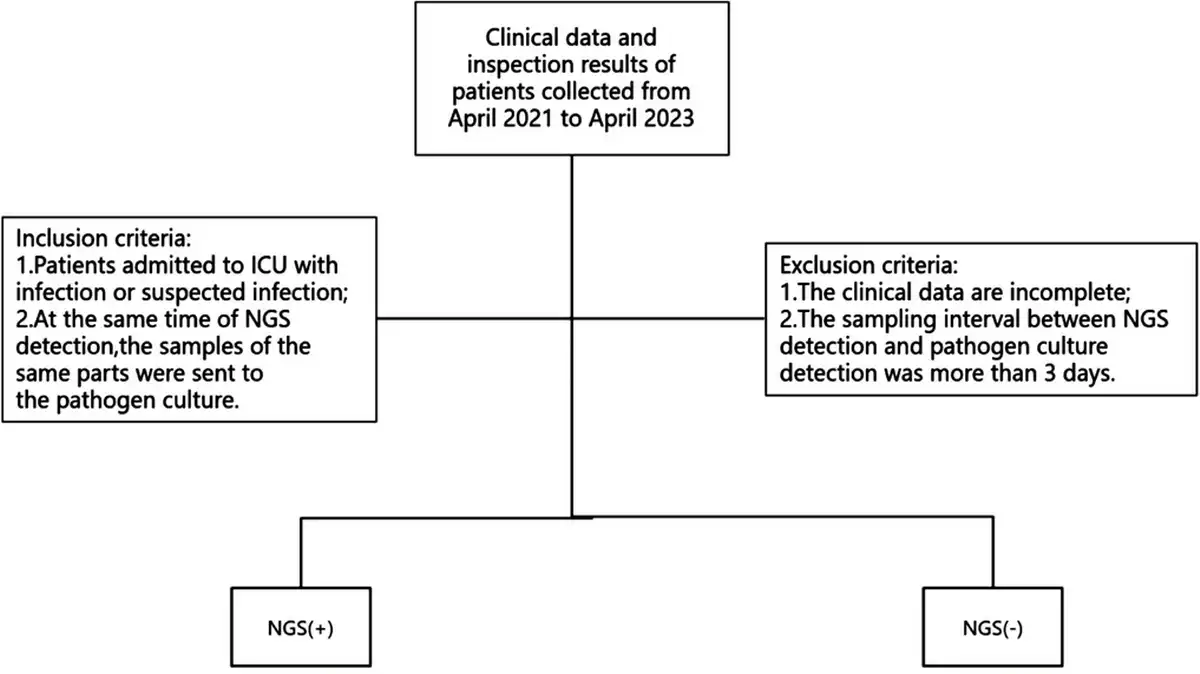
Figure 1.
Flow chart of the study. ICU, intensive care unit; NGS, next-generation sequencing.
Sample collection and inspection
This study strictly followed the standardized sample collection and processing process developed by Zhongnan Hospital of Wuhan University. Professionally trained medical staff used a sterile sampling container and a special sampling kit to select the best sampling method according to the infection site to collect samples. The staff ensured that each patient simultaneously collected matching NGS test samples and traditional pathogen culture samples and recorded the sampling time, location, and basic patient information in detail. After collection, all the samples were immediately labeled with an exclusive barcode. In principle, they are required to be delivered to the laboratory within 30 min of collection, and if they cannot be sent for testing immediately under special circumstances, they need to be stored according to the following conditions: bacterial culture samples—refrigerate at 4 °C for no more than 12 h, and virus test samples—cryostore at -20 °C for no more than 24 h. Temperature fluctuations (± 2 °C) are strictly monitored during storage. Upon receiving the samples, the laboratory department first checked the completeness of the sample information, conducted a preliminary quality assessment (including sample size and hemolysis), divided them according to the standard operating procedures, and inoculated them into the corresponding medium in the biosafety cabinet.
The quality of the entire process, from collection to testing, was in line with the above-mentioned standardized process, and the accuracy and reliability of the test results were ensured to the greatest extent.
NGS detection process
High-throughput sequencing technology was employed to analyze the microbial nucleic acid sequences in the samples. Identification was then performed by referencing the National Center for Biotechnology Information database and a self-constructed microbial gene tag sequence database in China. The NGS detection process encompassed both experimental procedures and bioinformatics analysis. Specific steps included sample preprocessing, nucleic acid extraction, library construction, sequencing, data quality control, removal of human sequences, microbial species identification, and comparison. All the steps were conducted according to the operational guidelines provided by the instrument manufacturer.
Data quality assurance
The data for this study were obtained from the clinical laboratory of Zhongnan Hospital of Wuhan University.
Statistical analysis
Statistical analysis of all the data was conducted using SPSS 20.0, and plotting was performed using GraphPad 7.0. The Kolmogorov-Smirnov test was applied to assess normality, with a P value of > 0.05 indicating that the data followed a normal distribution. Continuous variables that followed a normal distribution were expressed as mean ± standard deviation, and the data were compared using an independent sample t-test. Data with a non-normal distribution were expressed as the median (interquartile range), and the Kruskal-Wallis rank sum test was used for comparison. Multivariate analysis was conducted using binary logistic regression. Statistical analyses for culture and NGS data were performed using the four-cell Chi-square test. In the multivariate analysis, we selected factors identified in the univariate analysis (variables with P < 0.05) and adjusted for confounding factors using the Enter method in logistic regression. In this study, a P value of < 0.05 was considered statistically significant. In the multivariate logistic regression analysis, all relevant variables were analyzed.
RESULTS
Clinical features
Overall, the study included 601 clinical cases, and the clinical features are summarized in Table 1. Of these, 7.9% were male, with a mean age of 61 (57, 72) years. Of the total, 504 patients tested positive for NGS. Compared to those with negative NGS results, NGS-positive patients were more likely to be admitted to the ICU for respiratory, circulatory, and digestive issues and exhibited a higher prevalence of autoimmune diseases. However, no significant differences were observed in clinical scores, ICU type, sources, treatment measures, or complications (P > 0.05). The 28-day mortality rate was higher among NGS-positive patients (44.9% vs. 34.0%).
Table 1
Patient clinical characteristics
| Characteristic | All (n = 601) | NGS (+) (n = 504) | NGS (-) (n = 97) | P value | |
|---|---|---|---|---|---|
| Age (years) | 61.00 (50.00, 72.00) | 63.00 (51.00, 72.75) | 57.00 (46.00, 68.00) | 0.010 | |
| Male | 444 (73.90) | 371 (83.60) | 73 (16.40) | 0.735 | |
| Clinical sore | SOFA DAY1 | 8.00 (5.00, 12.00) | 8.00 (5.00, 12.00) | 10.00 (5.25, 12.00) | 0.510 |
| SOFA DAY2 | 8.00 (5.00, 11.00) | 8.00 (5.00, 11.00) | 8.00 (5.00, 11.00) | 0.457 | |
| APACHEIIDAY1 | 21.00 (16.00, 26.00) | 21.00 (15.00, 26.00) | 21.00 (15.00, 27.00) | 0.935 | |
| APACHEIIDAY2 | 21.00 (15.00, 25.00) | 21.00 (15.00, 25.00) | 20.00 (15.00, 25.00) | 0.729 | |
| Type of admission | Elective surgery | 85 (14.10) | 71 (14.10) | 14 (14.40) | 0.359 |
| Emergency surgery | 68 (11.30) | 52 (10.30) | 16 (16.50) | ||
| Trauma | 52 (8.70) | 44 (8.70) | 8 (8.20) | ||
| Other | 396 (65.90) | 337 (66.90) | 59 (60.80) | ||
| Source of admission | Operating room | 36 (6.00) | 26 (5.20) | 10 (10.30) | 0.164 |
| ED | 54 (9.00) | 47 (9.30) | 7 (7.20) | ||
| Other department | 244 (40.60) | 210 (41.70) | 34 (35.10) | ||
| Other hospital | 267 (44.40) | 221 (43.80) | 46 (47.40) | ||
| Reason for ICU admission | Respiratory | 382 (63.60) | 334 (66.30) | 48 (49.50) | 0.002 |
| Cardiovascular | 219 (36.40) | 164 (32.50) | 55 (56.70) | < 0.001 | |
| Digestive/liver | 119 (19.80) | 90 (17.90) | 29 (29.90) | 0.006 | |
| Renal | 34 (5.70) | 29 (5.80) | 5 (5.20) | 0.815 | |
| Neurologic | 160 (26.60) | 134 (26.60) | 26 (26.80) | 0.965 | |
| Trauma | 49 (8.20) | 41 (8.10) | 8 (8.20) | 0.970 | |
| Blood | 48 (8.00) | 45 (8.90) | 3 (3.10) | 0.052 | |
| Other | 62 (10.30) | 54 (10.60) | 8 (8.20) | 0.241 | |
| Treatment on admission | Hemodialysis | 256 (42.60) | 209 (43.40) | 47 (48.50) | 0.203 |
| Mechanical ventilation | 473 (72.70) | 402 (79.80) | 71 (73.20) | 0.148 | |
| Comorbid conditions | COPD | 19 (3.20) | 18 (3.30) | 1 (1.00) | 0.321 |
| Cancer | 107 (17.80) | 84 (16.70) | 23 (23.70) | 0.097 | |
| Hypertension | 249 (41.10) | 212 (42.10) | 37 (38.10) | 0.473 | |
| CHD | 75 (12.50) | 62 (12.30) | 13 (13.40) | 0.764 | |
| Diabetes mellitus | 121 (20.10) | 104 (20.60) | 17 (17.50) | 0.484 | |
| Chronic renal failure | 60 (10.00) | 54 (10.70) | 6 (6.20) | 0.173 | |
| Immunosuppression | 62 (10.30) | 58 (11.50) | 4 (4.10) | 0.029 | |
| HIV | 16 (2.70) | 16 (3.20) | 0 (0) | 0.151 | |
| Hematologic cancer | 24 (4.00) | 22 (4.40) | 2 (2.10) | 0.437 | |
| Neurologic | 107 (17.80) | 93 (18.50) | 14(14.40) | 0.343 | |
| HepatitisB | 22 (3.70) | 20 (34.30) | 2 (11.10) | 0.137 | |
| No. of comorbid conditions | 1 (1, 2) | 1 (1, 2) | 1 (0, 2) | 0.041 | |
| 0 | 143 (23.80) | 111 (22.00) | 32 (33.00) | 0.111 | |
| 1 | 186 (30.90) | 158 (31.30) | 28 (28.90) | ||
| 2 | 179 (29.80) | 155 (30.80) | 24 (24.70) | ||
| 3 | 62 (10.30) | 51 (10.10) | 11 (11.30) | ||
| > 3 | 31 (5.20) | 29 (5.80) | 2 (2.10) | ||
| Inspection data | PCT | 3.00 (1.00,17.00) | 2.00 (0,15.00) | 4.50 (2.00, 29.00) | 0.001 |
| WBC | 11.00 (6.00,16.00) | 10.00 (6.00, 15.00) | 13.00 (8.00, 22.00) | < 0.001 | |
| IL-6 | 131.00 (41.00, 496.75) | 122.00 (38.00, 460.00) | 161.00 (68.50, 558.25) | 0.084 | |
| 28-day death | 259 (43.1) | 226 (44.9) | 33 (34.0) | 0.047 | |
Detection results of NGS and traditional pathogen culture methods
In a total of 601 samples, BALF and blood accounted for 91.2%, while drainage fluid and cerebrospinal fluid accounted for only 8.8% [Figure 2]. NGS detected pathogens in 8.9% of the samples, and the virus positivity rate was 34.4%, with Epstein-Barr Virus (EBV), Herpes Simplex Virus 1 (HSV-1), and Cytomegalovirus (CMV) being the predominant viruses detected. BALF and blood were the primary samples that yielded positive results [Figure 3]. The bacterial detection rate was 7.5%, with the highest detection rate observed in BALF (9.8%) and the lowest in blood (4.6%). The primary bacteria detected were Klebsiella pneumoniae, Acinetobacter baumannii, and Enterococcus faecalis [Figure 4]. The main fungi detected by NGS are Candida albicans and closely related species, but the fungi with the highest detection rate in blood samples are Aspergillus flavus and Aspergillus niger [Figure 5]. The positivity rate of atypical pathogens was 8.0%, with BALF remaining the primary sample source [Figure 6; Tables 2, 3, and 4; and Supplementary Figure 1, https://links.lww.com/JTCCM/A28]. The positivity rate of pathogen culture was only 45.1%. The bacterial detection rate was 36.9%, with A. baumannii, K. pneumoniae, and Pseudomonas aeruginosa being the predominant bacteria detected. The highest detection rate was observed in drainage fluid (46.9%), while no bacteria were detected in cerebrospinal fluid [Figure 7]. The fungal detection rate was 9.0%, with BALF being the primary source of positive pathogens. The predominant fungi detected were C. albicans, Candida tropicalis, and Aspergillus fumigatus [Figure 8 and Tables 2, 3, and 5].
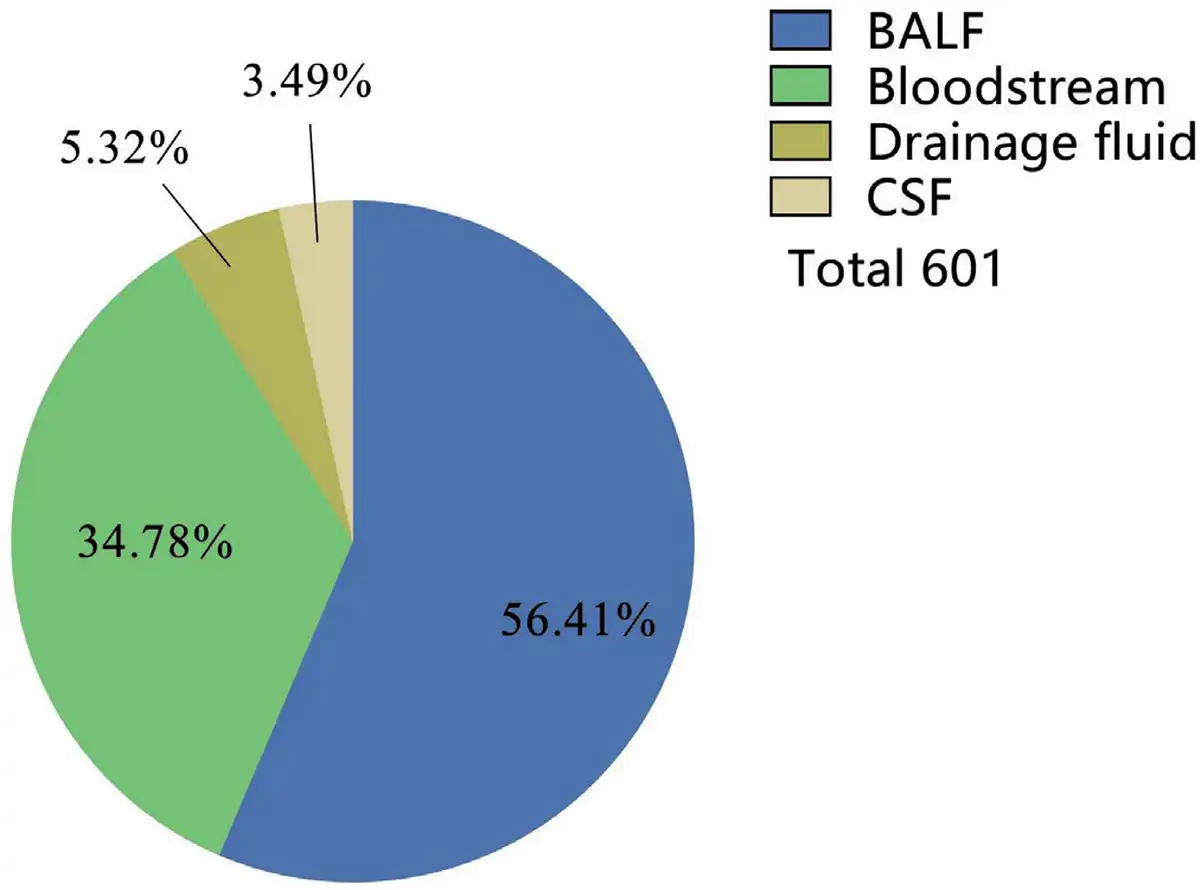
Figure 2.
Source of samples. BALF, bronchoalveolar lavage fluid; CSF, cerebrospinal fluid.
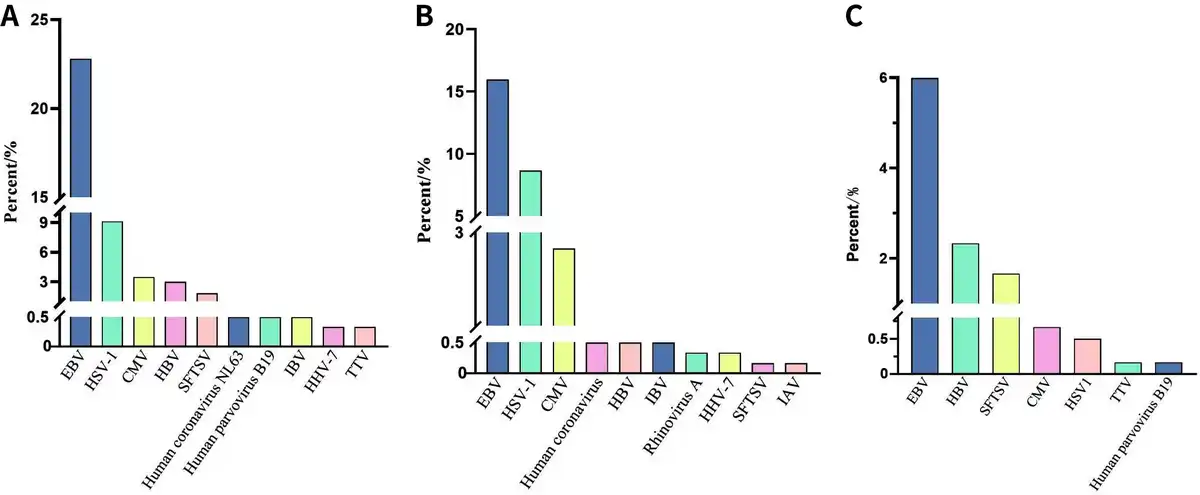
Figure 3.
NGS detection of virus. (A). Total. Rhinovirus A tied for 10th. (B) BALF. Human parvovirus B19, and COVID-19 tied for 10th. (C) Bloodstream. EBV, Epstein-Barr virus; HSV-1, Herpes simplex virus type 1; CMV, Cytomegalovirus; HBV, Hepatitis B virus; SFTSV, severe fever with thrombocytopenia syndrome bunyavirus; IAV, Influenza A virus; IBV, Influenza B virus; HHV-7, Human herpesvirus 7; TTV, Torque teno virus. NGS, next-generation sequencing; BALF, bronchoalveolar lavage fluid; COVID-19, coronavirus disease 2019.
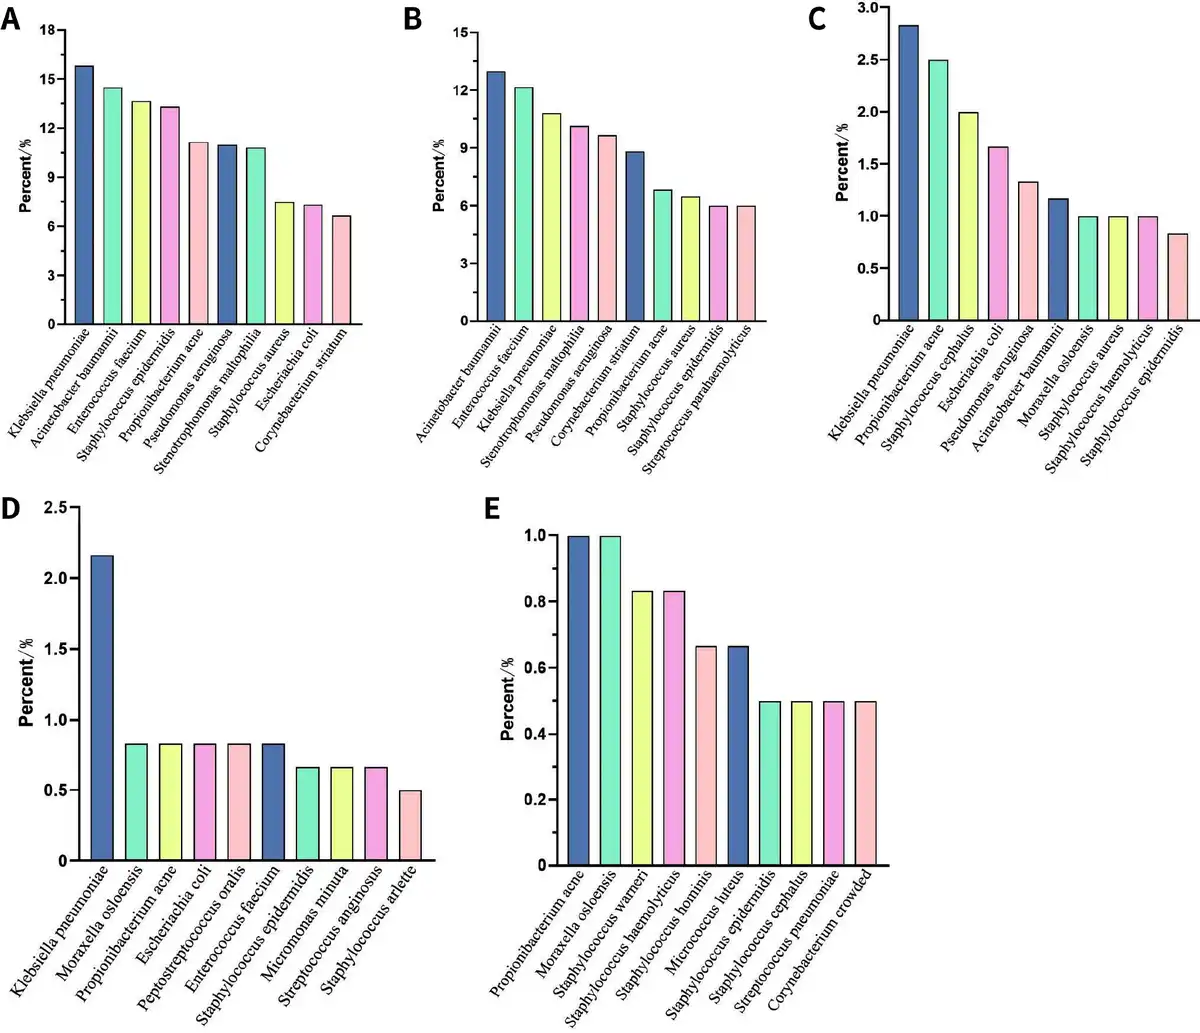
Figure 4.
NGS detection of bacteria. (A) Total; (B) BALF; (C) Bloodstream; (D) Drainage fluid; (E) CSF. NGS, next-generation sequencing; BALF, bronchoalveolar lavage fluid; CSF, cerebrospinal fluid.
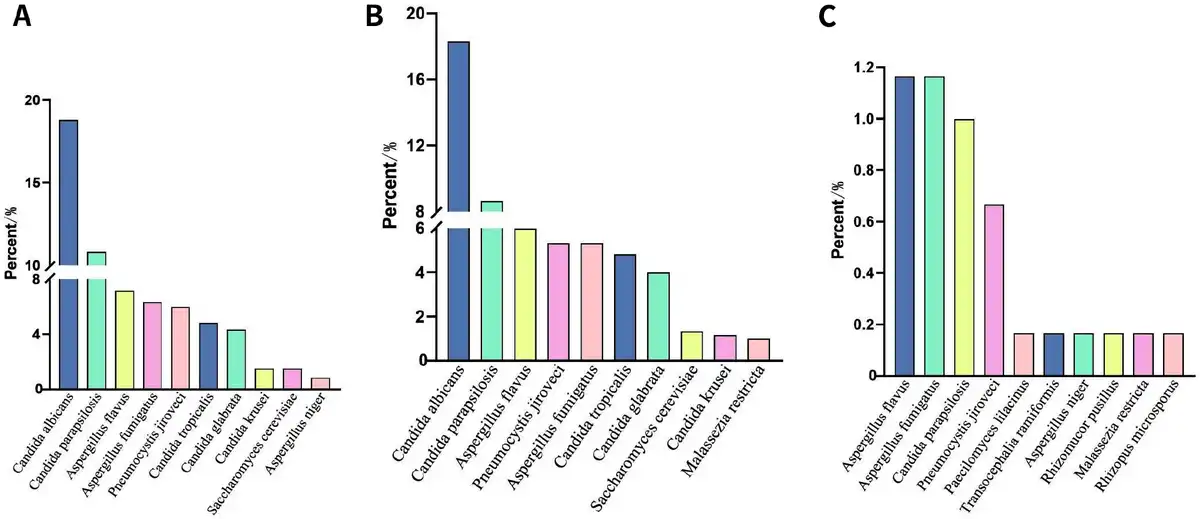
Figure 5.
NGS detection of fungi. (A) Total. Candida metapsilosis and Malassezia tied for 10th. (B) BALF. (C) Bloodstream. Aspergillus chevalieri tied for 10th. NGS, next-generation sequencing; BALF, bronchoalveolar lavage fluid.
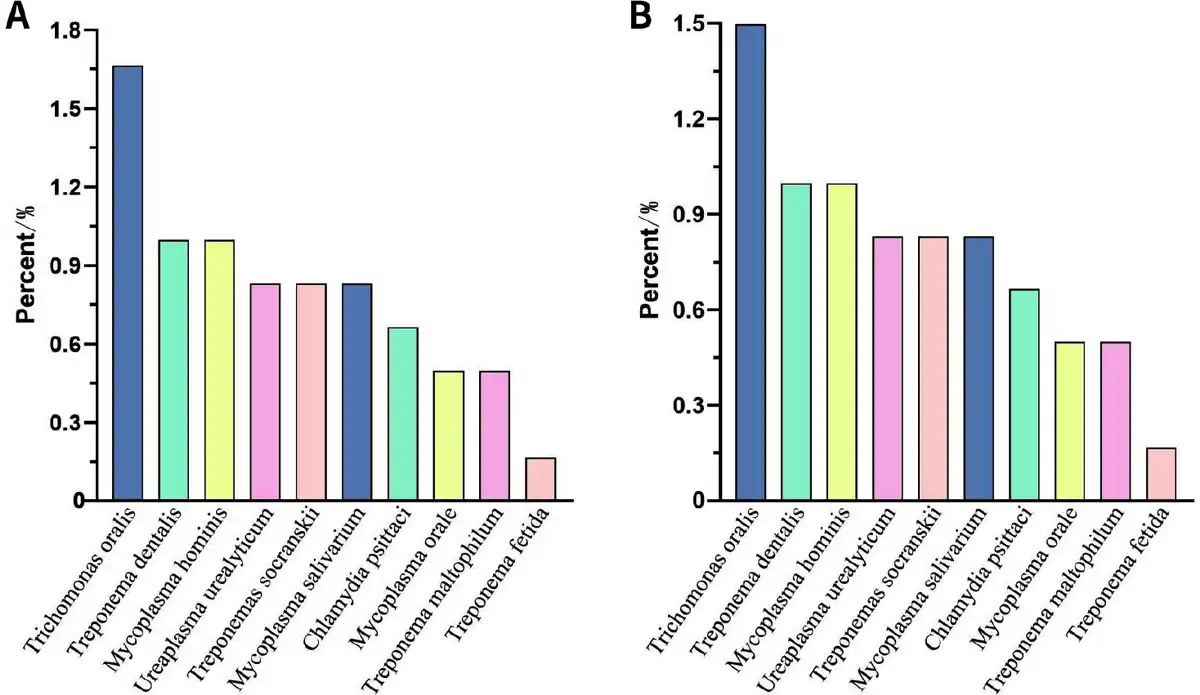
Figure 6.
NGS detection of atypical pathogens. (A) Total. Treponema phosphatidylcholine, Ureaplasma urealyticum, Treponema vendori and Ureaplasma parvum tied for 10th. (B) BALF. Treponema phosphatidylcholine, Ureaplasma urealyticum, Treponema vendori and Ureaplasma parvum tied for 10th. NGS, next-generation sequencing; BALF, bronchoalveolar lavage fluid.
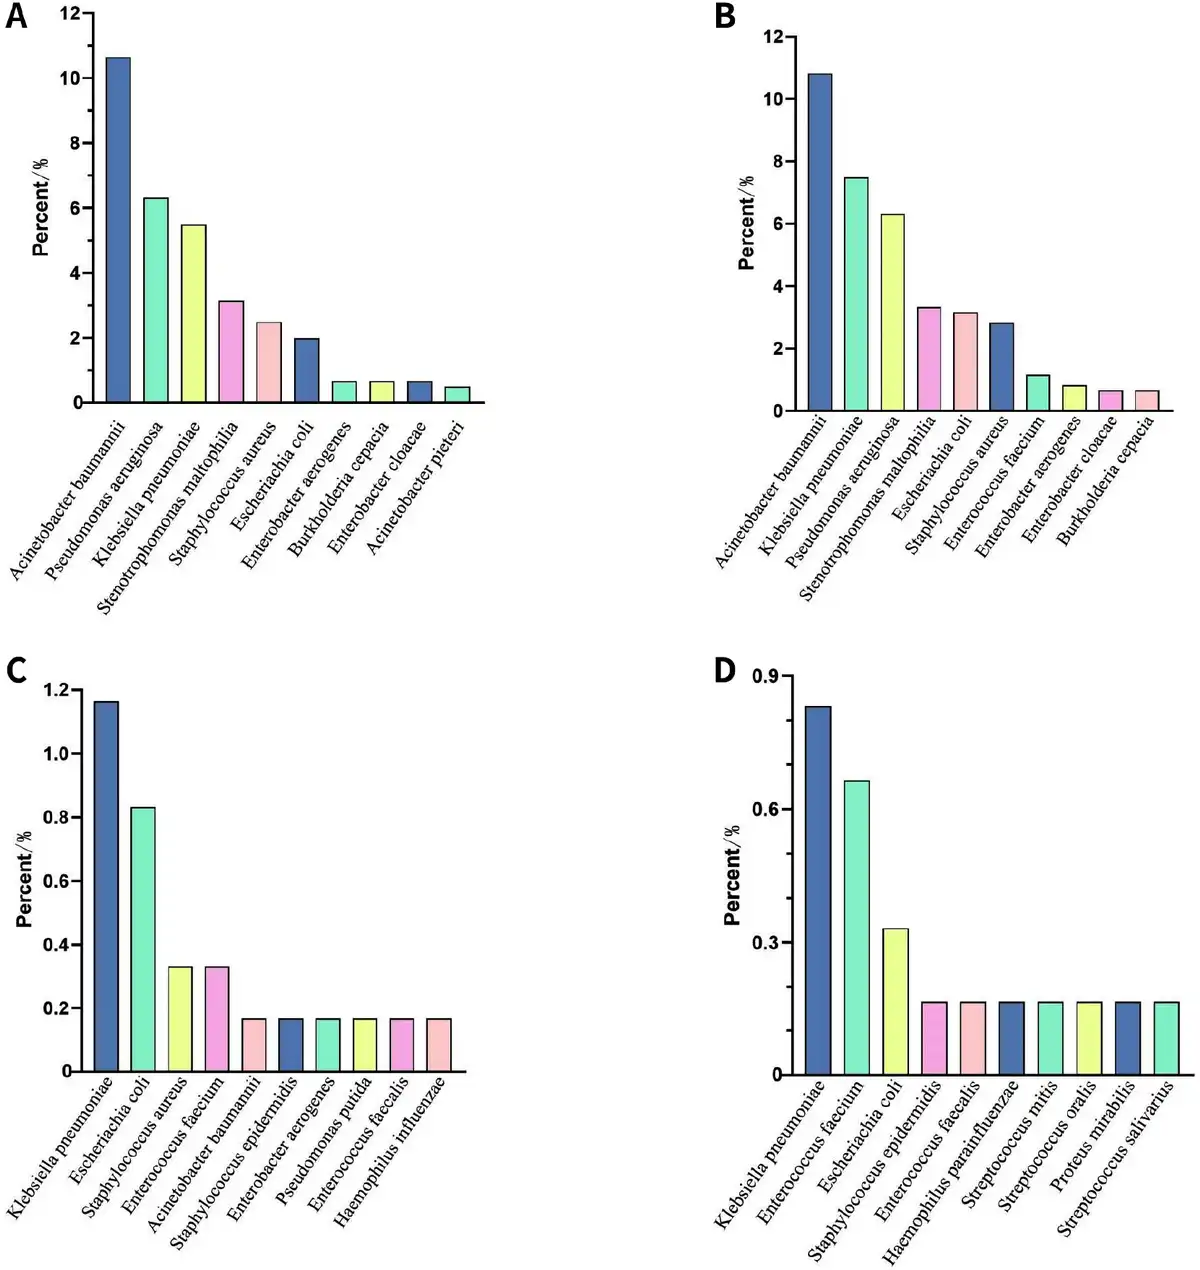
Figure 7.
The pathogenic culture detection of bacteria. (A) Total. (B) BALF. (C) Bloodstream. Staphylococcus haemolyticus, Stenotrophomonas maltophilia and Streptococcus constellatus tied for 10th. (D) Drainage fluid. BALF, bronchoalveolar lavage fluid.
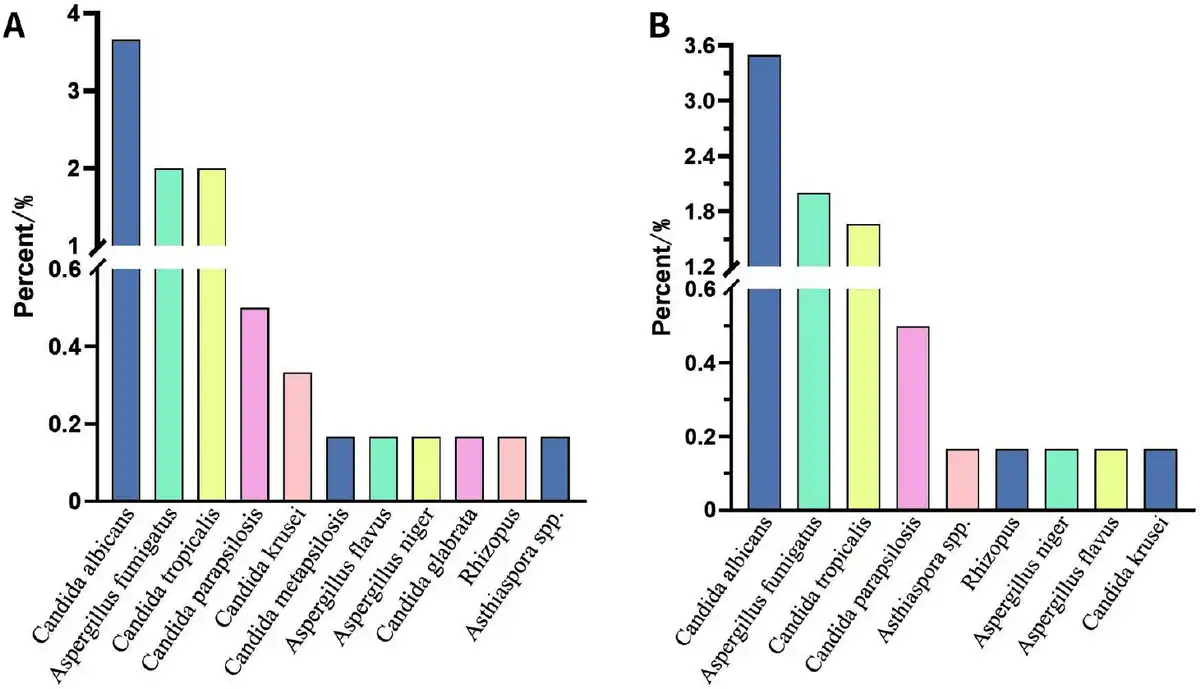
Figure 8.
The pathogenic culture detection of fungi. (A) Total: Asthiaspora spp. tied for 10th. (B) BALF. BALF, bronchoalveolar lavage fluid.
Table 2
Microorganisms identified by NGS and pathogenic culture
| Sample source | All | NGS, n (%) | Culture, n (%) | |||||||
| Virus | Bacteria | Fungi | Atypical pathogens | Virus | Bacteria | Fungi | Atypical pathogens | |||
| BALF | 339 | 140 (41.3) | 317 (93.5) | 218 (64.3) | 47 (13.9) | 0 | 184 (54.3) | 48 (14.2) | 0 | |
| Bloodstream | 209 | 60 (28.7) | 89 (42.6) | 29 (13.9) | 0 | 0 | 23 (11.0) | 2 (1.0) | 0 | |
| Drainage fluid | 32 | 4 (12.5) | 23 (71.9) | 8 (25.0) | 1 (3.1) | 0 | 15 (46.9) | 4 (12.5) | 0 | |
| CSF | 21 | 3 (14.3) | 13 (61.9) | 5 (23.8) | 0 | 0 | 0 | 0 | 0 | |
| Total | 601 | 207 (34.4) | 442 (73.5) | 260 (43.3) | 48 (8.0) | 0 | 222 (36.9) | 54 (9.0) | 0 | |
Table 3
Influence of sample source on pathogenic culture results
| Sample source | Positive, n (%) | Negative, n (%) | X2 | P value |
|---|---|---|---|---|
| BALF | 229 (67.6) | 110 (32.4) | 183.271 | < 0.001 |
| Bloodstream | 24 (11.5) | 185 (88.5) | ||
| Drainage fluid | 18 (56.2) | 14 (43.8)# | ||
| CSF | 0 | 21 (100) |
Table 4
Comparison of NGS results at different times in the same part of the same patient
| Item | Inconsistent | Completely consistent | Partially consistent | Total |
|---|---|---|---|---|
| n (%) | 26 (33.77) | 7 (9.09) | 44 (57.14) | 77 |
Table 5
Impact of sample source on NGS results
| Sample source | Positive, n (%) | Negative, n (%) | X2 | P value |
|---|---|---|---|---|
| BALF | 335 (98.8) | 4 (1.2) | 152.275 | < 0.001 |
| Bloodstream | 128 (61.2) | 81 (38.8) | ||
| Drainage fluid | 24 (75.0) | 8 (25.0) | ||
| CSF | 17 (81.0) | 4 (19.0) |
Comparison of the cycle times between NGS and traditional pathogen culture methods
Statistical differences were observed in the culture cycle of pathogens across different sample sources (P < 0.001). The shortest culture cycle was observed for BALF (48 h), while the longest cycle was observed for blood (120 h). No significant difference was found in the NGS cycle across different sample sources (P > 0.05, Table 6). For the entire study population and across various sample sources, statistical differences were found in the detection cycle times of NGS and pathogen culture (P < 0.05). The largest difference was observed in blood samples (120 h vs. 48 h, Table 7). In addition, 77 patients had multiple samples extracted from the same site for NGS testing, with an average interval of 10.75 days [Table 4].
Table 6
Impact of sample source on pathogenic culture and NGS cycles
| Item | BALF | Bloodstream | Drainage fluid | CSF | H value | P value |
|---|---|---|---|---|---|---|
| Culture, cycle/h | 48 (48.00, 48.00) | 120 (120.00, 120.00) | 48 (48.00, 72.00)# | 72 (72.00, 72.00)# | 475.99 | < 0.001 |
| NGS, cycle/h | 48 (41.02, 48.00) | 48 (48.00, 48.00) | 48 (48.00, 72.00) | 48 (41.96, 48.00) | 4.21 | < 0.001 |
Table 7
Comparison of pathogenic culture and NGS cycles by sample source
| Sample source | Culture cycle/h | NGS cycle/h | Z value | P value |
|---|---|---|---|---|
| BALF | 48 (48.00, 48.00) | 48 (41.02, 48.00) | -9.84 | < 0.001 |
| Bloodstream | 120 (120.00, 120.00) | 48 (48.00, 48.00) | -12.89 | < 0.001 |
| Drainage fluid | 48 (48.00, 72.00) | 48 (48.00, 72.00) | -3.326 | 0.001 |
| CSF | 72 (72.00, 72.00) | 48 (41.96, 48.00) | -3.660 | < 0.001 |
| Total | 48 (48.00, 120.00) | 48 (41.88, 48.00) | -16.79 | < 0.001 |
Comparison and consistency of NGS and pathogen culture results
To improve the comparability of NGS and culture results, we screened the NGS results to exclude pathogens that could not be cultured, yielding a result referred to as “screening NGS”. The positive rate of screening NGS in 601 samples was 79.0% [Table 8]. The positive rate of both NGS and screening NGS was higher than that of pathogen culture across all sample sources [Tables 3, 4, and 9].
Table 8
Comparison of pathogenic culture and NGS results
| Item | Positive, n (%) | Negative, n (%) | X2 | P value |
|---|---|---|---|---|
| Culture | 271 (45.1) | 330 (54.9) | - | - |
| NGS | 504 (83.9) | 97 (16.1) | 56.519 | < 0.001 |
| Screening NGS | 475 (79.0) | 126 (21.0) | 81.475 | < 0.001 |
Table 9
Influence of sample sources on screening NGS results
| Sample source | Positive, n (%) | Negative, n (%) | X2 | P value |
|---|---|---|---|---|
| BALF | 332 (97.9) | 7 (2.1) | 196.590 | < 0.001 |
| Bloodstream | 105 (49.8) | 106 (50.2) | ||
| Drainage fluid | 24 (66.7) | 8 (33.3) | ||
| CSF | 14 (75.0) | 7 (25.0) |
The comparison of concordance revealed that BALF samples had the highest positive concordance (55.2%), while blood samples exhibited the highest negative concordance (45.9%, Table 10). Complete matches occurred in 80.5% of the samples that yielded positive results for both NGS and pathogen culture [Figure 9]. The positive percent agreement (PPA) for NGS detection of bacteria was 95.05% and 88.89% for fungi [Table 11].
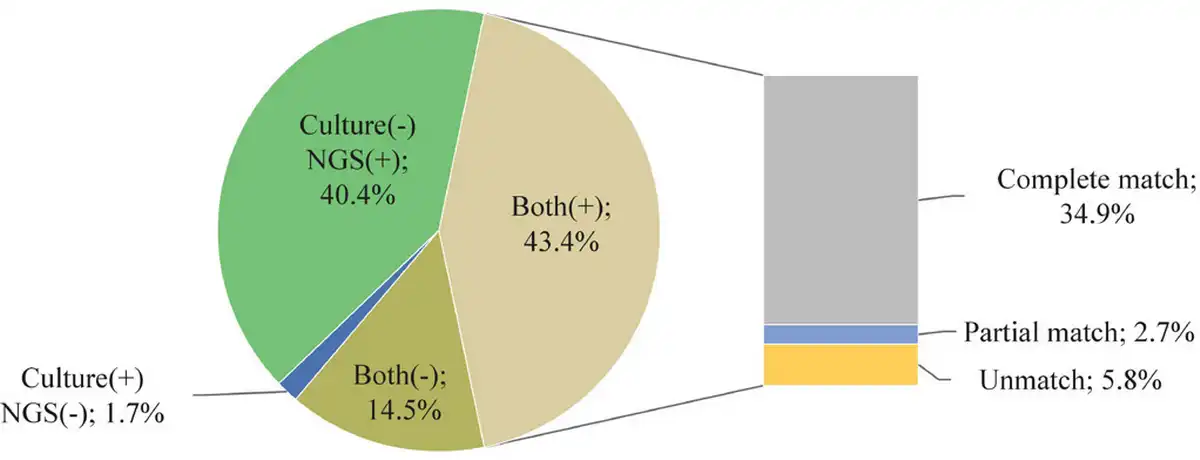
Figure 9.
The consistency of pathogen culture and NGS. NGS, next-generation sequencing.
Table 10
Consistency of pathogenic culture and screening NGS results
| Sample source | Inconsistent, n (%) | Positive consistent, n (%) | Positive partial consistent, n (%) | Negative consistent, n (%) | X2 | P value |
|---|---|---|---|---|---|---|
| BALF | 136 (40.1) | 187 (55.2) | 11 (3.2) | 5 (1.2) | 288.678 | < 0.001 |
| Bloodstream | 100 (47.8) | 11 (5.3) | 2 (1.0) | 96 (45.9) | ||
| Drainage fluid | 11 (34.4) | 12 (37.5) | 3 (9.4) | 6 (18.8) | ||
| CSF | 14 (66.7) | 0 | 0 | 7 (33.3) |
Table 11
Consistency of NGS and pathogenic culture in the detection of pathogens
| Pathogen | Culture (+)/NGS (-) | Culture (+)/NGS (+) | Culture (-)/NGS (-) | Culture (-)/NGS (+) | PPA, % | NPA, % |
|---|---|---|---|---|---|---|
| Bacteria | 11 | 211 | 148 | 231 | 95.05 | 39.05 |
| Fungi | 6 | 48 | 335 | 212 | 88.89 | 61.24 |
| Virus | 0 | 0 | 394 | 207 | 0 | 65.56 |
| Atypical pathogens | 0 | 0 | 553 | 48 | 0 | 92.01 |
Detection of common pathogens and multivariate logistic regression analysis
NGS demonstrated a superior ability to detect common pathogens compared to pathogenic culture (P < 0.05). We selected 10 of the more common pathogens for consistent analysis of NGS and cultures: A. baumannii, K. pneumoniae, P. aeruginosa, Escherichia coli, Enterococcus faecium, Staphylococcus aureus, Stenotrophomonas maltophila, C. albicans, A. fumigatus, and C. tropicalis. A. baumannii had the highest concordance in NGS and pathogen culture (κ = 0.700, P < 0.001), followed by P. aeruginosa (κ = 0.665, P < 0.001) and E. coli (κ = 0.518, P < 0.001), while C. albicans had the lowest concordance (κ = 0.20, P < 0.001). P. aeruginosa had the highest PPA of 94.74%, followed by E. coli and A. baumannii, while A. fumigatus had the lowest PPA of 66.67%. Only P. aeruginosa had a higher PPA than negative percent agreement (NPA), and all other common pathogens exhibited higher NPA [Table 12]. NGS demonstrated a higher negative predictive value for all common pathogens [Table 13]. Furthermore, infections caused by A. baumannii, S. aureus, A. fumigatus, and S. maltophilia were identified as independent risk factors for 28-day mortality [Table 14].
Table 12
Consistency of NGS and pathogenic culture in the detection of common pathogens
| Pathogen | Culture (+)/NGS (-) | Culture (+)/NGS (+) | Culture (-)/NGS (+) | Culture (-)/NGS (-) | PPA, % | NPA, % | Kappa | Kappa P value |
|---|---|---|---|---|---|---|---|---|
| Acinetobacter baumannii | 9 | 56 | 31 | 505 | 86.15 | 94.22 | 0.700 | < 0.001 |
| Klebsiella pneumoniae | 8 | 37 | 59 | 497 | 82.22 | 89.39 | 0.471 | < 0.001 |
| Pseudomonas aeruginosa | 2 | 36 | 30 | 533 | 94.74 | 94.67 | 0.665 | < 0.001 |
| Escherichia coli | 2 | 17 | 27 | 555 | 89.47 | 95.36 | 0.518 | < 0.001 |
| Enterococcus faecium | 2 | 5 | 77 | 517 | 71.43 | 87.04 | 0.093 | 0.001 |
| Staphylococcus aureus | 3 | 14 | 31 | 553 | 82.35 | 94.69 | 0.428 | < 0.001 |
| Stenotrophomonas maltophilia | 5 | 15 | 50 | 531 | 75.00 | 91.39 | 0.318 | < 0.001 |
| Candida albicans | 5 | 17 | 96 | 483 | 77.27 | 83.42 | 0.203 | < 0.001 |
| Aspergillus fumigatus | 4 | 8 | 31 | 558 | 66.67 | 94.74 | 0.292 | < 0.001 |
| Candida tropicalis | 3 | 9 | 20 | 569 | 75.00 | 96.60 | 0.423 | < 0.001 |
Table 13
NGS diagnostic capability
| Pathogen | Sensitivity, % | Specificity, % | PPV, % | NPV, % | Accuracy, % | Mcnemar P value |
|---|---|---|---|---|---|---|
| Bacteria | 95.0 (91.3, 97.2) | 39.1 (34.3, 44.0) | 47.7 (43.1, 52.4) | 93.1 (88.0, 96.1) | 59.7 (55.8, 63.6) | < 0.001 |
| Acinetobacter baumannii | 86.2 (75.3, 93.5) | 94.2 (91.9, 96.0) | 64.4 (55.9, 72.0) | 98.3 (96.8, 99.0) | 93.3 (91.4, 95.3) | 0.001 |
| Klebsiella pneumoniae | 82.2 (68.0, 92.0) | 89.4 (86.5, 91.8) | 38.5 (32.2, 45.3) | 98.4 (97.1, 99.1) | 88.9 (86.3, 91.4) | < 0.001 |
| Pseudomonas aeruginosa | 94.7 (82.3, 99.4) | 94.7 (92.5, 96.4) | 54.5 (45.7, 63.1) | 99.6 (98.6, 99.9) | 94.7(92.9, 96.5) | < 0.001 |
| Enterococcus faecium | 71.4 (29.0, 96.3) | 87.0 (84.1, 89.6) | 6.1 (3.7, 9.8) | 99.6 (98.8, 99.9) | 86.9 (83.9, 89.3) | < 0.001 |
| Escherichia coli | 89.5 (93.3, 96.9) | 95.4 (93.3, 96.9) | 38.6 (29.7, 48.4) | 99.6 (98.7, 99.9) | 95.2 (93.2, 96.6) | < 0.001 |
| Staphylococcus aureus | 82.4 (56.6, 96.2) | 94.7 (92.6, 96.4) | 31.1 (23.1, 40.4) | 99.5 (98.5, 99.8) | 94.3 (92.2, 95.9) | < 0.001 |
| Stenotrophomonas maltophilia | 75.0 (50.9, 91.3) | 91.4 (88.8, 93.5) | 23.1 (17.2, 30.2) | 99.1 (98.0, 99.6) | 90.8 (88.3, 92.9) | < 0.001 |
| Fungi | 88.9 (77.8, 94.8) | 61.2 (57.1, 65.2) | 18.5 (14.2, 23.6) | 98.2 (96.2, 99.2) | 63.7 (59.8, 67.5) | < 0.001 |
| Candida albicans | 77.3 (54.6, 92.1) | 83.4 (80.1, 86.4) | 15.0 (11.7, 19.1) | 99.0 (97.8, 99.5) | 83.2 (80.0, 86.0) | < 0.001 |
| Aspergillus fumigatus | 66.7 (34.9, 90.1) | 94.8 (92.6, 96.4) | 20.5 (13.2, 30.4) | 99.3 (98.4, 99.7) | 94.2 (92.0, 95.8) | < 0.001 |
| Candida tropicalis | 75.0 (42.8, 95.5) | 96.6 (94.8, 97.9) | 31.0 (20.8, 43.6) | 99.5 (98.6, 99.8) | 96.2 (94.3, 97.4) | < 0.001 |
Table 14
Logistic regression of common pathogens’ 28-day mortality
| Pathogens | Unadjusted OR value (95% CI) | P value | Adjusted OR value (95% CI) | P value | |
|---|---|---|---|---|---|
| NGS | Acinetobacter baumannii | 1.580 (1.001, 2.493) | 0.049 | 1.943 (1.173, 3.219) | 0.010 |
| Staphylococcus aureus | 1.891 (1.002, 3.498) | 0.042 | 1.903 (1.020, 3.552) | 0.043 | |
| Aspergillus fumigatus | 2.815 (1.417, 5.594) | 0.003 | 2.558 (1.207, 5.420) | 0.014 | |
| Culture | Stenotrophomonas maltophilia | 3.190 (1.209, 8.420) | 0.019 | 3.094 (1.106, 8.653) | 0.031 |
| Aspergillus fumigatus | 6.807 (1.478, 31.342) | 0.014 | 5.624 (1.147-27.572) | 0.033 | |
Multivariate logistic regression analysis of 28-day mortality
In a multivariate regression analysis of 28-day mortality, we found that age, elective surgery, coronary artery disease, malignancy, NGS positivity, and culture positivity were independent predictors. NGS-positive patients had a worse prognosis compared to pathogenic culture-positive patients (odds ratio [OR] = 1.734, 95% confidence interval [CI]: 1.047-2.871 vs. OR = 1.521, 95% CI: 1.061-2.179; Tables 15 and 16).
Table 15
Multivariate logistic regression analysis of 28-day mortality in NGS-positive patients
| Variable | OR (95% CI) | P value |
|---|---|---|
| Age | 1.024 (1.013, 1.035) | < 0.001 |
| Elective surgery | 0.367 (0.212, 0.635) | < 0.001 |
| Cancer | 2.231 (1.391, 3.577) | 0.001 |
| CHD | 2.359 (1.352, 4.115) | 0.003 |
| SOFA DAY2 | 1.147 (1.097, 1.200) | < 0.001 |
| NGS (+) | 1.734 (1.047, 2.871) | 0.032 |
Table 16
Multivariate logistic regression analysis of 28-day mortality in culture-positive patients
| Variable | OR (95% CI) | P value |
|---|---|---|
| Age | 1.023 (1.012, 1.034) | < 0.001 |
| Elective surgery | 0.365 (0.211, 0.632) | < 0.001 |
| Cancer | 2.151 (1.343, 3.443) | 0.001 |
| CHD | 2.433 (1.393, 4.251) | 0.002 |
| SOFA DAY2 | 1.145 (1.095, 1.197) | < 0.001 |
| Culture (+) | 1.521 (1.061, 2.179) | 0.022 |
DISCUSSION
Infections in ICUs represent a major clinical challenge, significantly contributing to patient morbidity and mortality. Consequently, rapid and accurate identification of the etiological agents is paramount for effective patient management. The present study systematically evaluated the performance of NGS against traditional pathogen culture methods using a substantial cohort of 601 samples from ICU patients. The findings robustly demonstrated the significant advantages of NGS over traditional pathogen culture methods, including markedly higher overall pathogen detection rates, the capacity to identify a broader spectrum of microorganisms (encompassing bacteria, fungi, viruses, and atypical pathogens), and a considerably shorter TAT.[,] These findings were consistent across various sample types and align well with previous research, reinforcing the technical superiority of NGS in the diagnostic landscape.[,] Beyond technical performance, this discussion delves into the clinical significance, challenges, and potential integration of NGS in the critical care setting.
Traditional pathogen culture methods, long considered the gold standard for bacterial and fungal infections, suffer from well-documented limitations, particularly in the ICU. Their inherently slow process (often 3-5 days or longer) and relatively low sensitivity, especially for fastidious organisms, viruses, atypical pathogens, or samples obtained after antibiotic administration, often hinder timely diagnosis.[] The low positivity rate of blood cultures in septic patients (approximately 30%) exemplifies this challenge,[] frequently leaving clinicians without definitive microbial evidence.
In line with previous research,[,,] our study confirms the substantial improvement in diagnostic yield offered by NGS. Precisely, we observed significantly higher detection rates compared to culture. While NGS demonstrated good concordance with traditional culture methods for common, easily cultivated pathogens (e.g., high PPA and substantial concordance for P. aeruginosa,[] with an overall concordance of 80.5% for dual-positive samples in our study), its true value often lies in identifying pathogens missed by culture. This includes crucial detections of atypical pathogens, such as Legionella pneumophila and Chlamydia psittaci identified in our cohort, which require specific, non-routine culture techniques often not performed standardly. Furthermore, NGS excelled in detecting viruses, particularly herpesviruses (EBV, HSV-1, and CMV). While interpreting the clinical significance of these viral findings requires caution (distinguishing reactivation from active disease),[,] their detection provides valuable information regarding potential co-infections, the patient’s immune status, or viral-related complications.[] A critical advantage, particularly relevant in the ICU, is NGS’s ability to detect pathogen nucleic acids even after antibiotic administration,[] offering a diagnostic window when culture sensitivity is significantly reduced.
A pivotal finding from our analysis was the independent association between a positive NGS result and increased 28-day mortality. This association persisted after adjusting for potential confounders, including baseline illness severity assessed by the Sequential Organ Failure Assessment (SOFA) score. In fact, the SOFA score itself was an independent predictor of mortality, consistent with its established role in prognostication for critically ill patients.[] This linkage between NGS positivity and poorer outcomes suggests that NGS is not merely detecting more organisms but is identifying microbial signatures that reflect a higher infection burden, more virulent pathogens, or complex polymicrobial infections directly impacting patient survival. This finding elevates NGS beyond a purely diagnostic tool, positioning it as a potential prognostic indicator that warrants clinical attention. Interestingly, common inflammatory markers such as procalcitonin and interleukin-6 did not show a clear positive correlation with NGS status in our study, possibly reflecting the complex interplay of infection, inflammation, treatment effects, and non-infectious conditions prevalent in ICU patients.[] This underscores the need to interpret biomarkers within the broader clinical context rather than in isolation.
Despite its diagnostic power, the high sensitivity of NGS introduces significant interpretive challenges. For instance, NGS can detect nucleic acid sequences originating from viable pathogens, non-viable organisms, colonizing flora, or environmental contaminants that may not be relevant to the disease being investigated. Therefore, distinguishing clinically relevant signals from background noise is of paramount importance.[,] Common colonizers (e.g., C. albicans and skin commensals such as Propionibacterium acnes) are frequently detected, especially in non-sterile site samples such as respiratory specimens or samples susceptible to skin contamination.[] Contamination can also occur during sample collection, transport, storage, or laboratory processing.[,] Furthermore, detecting microbial DNA, even in sterile sites such as blood, does not always equate to active infection, as transient translocation or the presence of cell-free DNA can occur.[,] Therefore, NGS results require careful clinical correlation; they must be interpreted alongside the patient’s symptoms, signs, imaging findings, other laboratory data, immune status, and treatment response. Quantitative or semi-quantitative information from NGS reports (e.g., read counts), comparison to established background/contaminant databases, and potentially repeat testing can aid interpretation. Stringent laboratory quality control measures, including negative controls and optimized bioinformatic filtering, are essential to minimize false-positive results and enhance reliability. The need for standardized interpretation guidelines remains.
Considering its strengths and limitations, NGS can be strategically integrated into the ICU diagnostic workflow. Its speed and broad coverage make it particularly valuable for early investigation in critically ill patients with suspected infection, especially those with fever of unknown origin, immunocompromised status, suspected rare/atypical infections, or those failing empirical therapy. For sample types with low culture yields, such as blood, NGS may offer a higher chance of identifying an etiologic agent.[] For samples such as BALF, where culture can be more informative and concordance with NGS is higher,[] parallel testing might be optimal—NGS provides rapid, broad data while culture offers definitive viability confirmation and crucial antimicrobial susceptibility testing (AST) results. Culture combined with AST remains indispensable for guiding targeted antibiotic therapy adjustments and is more cost-effective.[,] NGS results, by identifying specific pathogens or resistance markers rapidly, can potentially inform earlier adjustments to empirical therapy while awaiting culture/AST.
NGS, however, is one tool among several advanced molecular diagnostics. For instance, targeted polymerase chain reaction (PCR) or droplet digital PCR may offer higher sensitivity or quantification for specific, known pathogens.[] In this regard, NGS provides an unbiased, hypothesis-free approach suitable for detecting unexpected or multiple pathogens simultaneously. An important limitation of this study is its single-center, retrospective design. Future research should include prospective, multicenter studies to validate these findings and, more importantly, to assess whether specific clinical algorithms incorporating NGS results lead to improved patient outcomes (e.g., faster appropriate therapy, reduced mortality, and shorter ICU stays). Further research is also needed to optimize pre-analytical factors (sample handling) and standardize analytical pipelines and interpretation frameworks. Beyond individual patient diagnosis, NGS technology holds considerable promise for public health applications, including surveillance of antimicrobial resistance patterns, tracking pathogen transmission during outbreaks, and identifying novel or emerging infectious agents.
CONCLUSION
This study provides substantial evidence supporting the clinical utility of NGS in the diagnosis of severe infections within the ICU setting. NGS offers significant advantages over traditional pathogen culture methods in terms of detection rate, microbial spectrum coverage, and speed. Crucially, NGS positivity is independently associated with increased mortality, highlighting its prognostic relevance. While careful interpretation integrated with clinical data is essential to navigate challenges related to sensitivity and specificity, NGS represents a transformative diagnostic tool. Its thoughtful integration with traditional methods holds the potential to significantly improve the management of critically ill patients by enabling earlier, more informed therapeutic decisions. Further research focusing on its clinical impact and optimal implementation strategies is warranted.
Acknowledgements
None.
Author contributions
Wang Y: Writing—Original draft, Resources, Writing—Review and Editing. Wu ZY: Writing—Original draft, Writing—Review and Editing. Hu C: Data curation, Writing—Review and Editing. Wang BQ: Data curation, Writing—Review and Editing. Zhang XY: Formal analysis, Writing—Review and Editing. Wu W: Formal analysis, Writing—Review and Editing. Wang XZ: Writing—Review and Editing. Li YM: Conceptualization, Writing—Review and Editing. Peng ZY: Conceptualization, Writing—Review and Editing. All authors read and approved the final manuscript.
Source of funding
This work was supported by the General Program of National Natural Science Foundation of China (grant numbers: 81971816); the Youth Program of National Natural Science Foundation of China (grant number: 82102273); the Youbo Fund of Zhongnan Hospital of Wuhan University (grant number: ZNYB2020008); and the project supported by the Hainan Province Clinical Medical Center.
Ethics approval
This study has been approved by the Ethics Committee of Zhongnan Hospital of Wuhan University (Approval No. 2022112).
Informed consent
Informed consent was waived by our Institutional Review Board because of the retrospective nature of our study.
Conflict of interest
Zhiyong Peng is an Associate Editors-in-chief of the journal. The article was subject to the journal’s standard procedures, with peer review handled independently of the member and research group.
Data availability statement
The data that support the findings of this study are available on request from the corresponding author upon reasonable request.
How to cite this article: Wang Y, Wu ZY, Hu C, et al. Next-generation sequencing vs. traditional pathogen culture methods in the diagnosis of severe infections in intensive care unit patients: A comparative study. J Transl Crit Care Med. 2025;7:e25-00006. doi: 10.1097/JTCCM-D-25-00006
REFERENCES
1.
Angus DC, Linde-Zwirble WT, Lidicker J, Clermont G, Carcillo J, Pinsky MR. Epidemiology of severe sepsis in the United States: analysis of incidence, outcome, and associated costs of care. Crit Care Med. 2001;29(7):1303-1310.2.
Sun LM, Zhang SG, Yang ZY, et al. Clinical Application and Influencing Factor Analysis of Metagenomic Next-Generation Sequencing (mNGS) in ICU Patients With Sepsis. Front Cell Infect Microbiol. 2020;12:9051.3.
Tjandra KC, Ram-Mohan N, Abe R, et al. Diagnosis of bloodstream infections: an evolution of technologies towards accurate and rapid identification and antibiotic susceptibility testing. Antibiotics (Basel). 2022;11(4):511.4.
Watanabe N, Kryukov K, Nakagawa S, et al. Detection of pathogenic bacteria in the blood from sepsis patients using 16S rRNA gene amplicon sequencing analysis. PLoS One. 2018;13(8):e0202049.5.
Evans L, Rhodes A, Alhazzani W, et al. Surviving sepsis campaign: international guidelines for management of sepsis and septic shock 2021. Crit Care Med. 2021;49(11):e1063-e1143.6.
Zhou H, Larkin PMK, Zhao DD, et al. Clinical impact of metagenomic next-generation sequencing of bronchoalveolar lavage in the diagnosis and management of pneumonia: a multicenter prospective observational study. J Mol Diagn. 2021;23(10):1259-1268.7.
Xie GJ, Zhao B, Wang X, et al. Exploring the clinical utility of metagenomic next-generation sequencing in the diagnosis of pulmonary infection. Infect Dis Ther. 2021;10(3):1419-1435.8.
Zuo YH, Wu YX, Hu WP, et al. The Clinical Impact of Metagenomic Next-Generation Sequencing (mNGS) Test in Hospitalized Patients with Suspected Sepsis: A Multicenter Prospective Study. Diagnostics (Basel). 2023;13(2):323.9.
Qu JM, Zhang J, Chen Y, et al. Aetiology of severe community acquired pneumonia in adults identified by combined detection methods: a multi-centre prospective study in China. Emerg Microbes Infect. 2022;11(1):556-566.10.
Long Y, Zhang YX, Gong Y, et al. Diagnosis of Sepsis with Cell-free DNA by Next-Generation Sequencing Technology in ICU Patients. Arch Med Res. 2016;47(5):365-371.11.
Grumaz S, Grumaz C, Vainshtein Y, et al. Enhanced Performance of Next-Generation Sequencing Diagnostics Compared With Standard of Care Microbiological Diagnostics in Patients Suffering From Septic Shock. Crit Care Med. 2019;47(5):e394-e402.12.
Vincent JL, Sakr Y, Sprung CL, et al. Sepsis in European intensive care units: results of the SOAP study. Crit Care Med. 2006;34(2):344-353.13.
Yanagihara K, Kitagawa Y, Tomonaga M, et al. Evaluation of pathogen detection from clinical samples by real-time polymerase chain reaction using a sepsis pathogen DNA detection kit. Crit Care. 2010;14(4):R159.14.
Cheng MP, Stenstrom R, Paquette K, et al. Blood culture results before and after antimicrobial administration in patients with severe manifestations of sepsis: A diagnostic study. Ann Intern Med. 2019;171(8):547-554.15.
Timsit JF, Ruppé E, Barbier F, Tabah A, Bassetti M. Bloodstream infections in critically ill patients: an expert statement. Intensive Care Med. 2020;46(2):266-284.16.
Lee IK, Chang JP, Huang WC, Tai CH, Wu HT, Chi CH. Comparative of clinical performance between next-generation sequencing and standard blood culture diagnostic method in patients suffering from sepsis. J Microbiol Immunol Infect. 2022;55(5):845-852.17.
Xie Y, Du J, Jin W, et al. Next generation sequencing for diagnosis of severe pneumonia: China, 2010-2018. J Infect. 2019;78(2):158-169.18.
Cohen JI. Epstein-Barr virus infection. N Engl J Med. 2000;343(7):481-492.19.
Blazquez-Navarro A, Dang-Heine C, Wittenbrink N, et al. BKV, CMV, and EBV interactions and their effect on graft function one year post-renal transplantation: results from a large multi-centre study. EBioMedicine. 2018;34:113-121.20.
Arabi YM, Fowler R, Hayden FG. Critical care management of adults with community-acquired severe respiratory viral infection. Intensive Care Med. 2020;46(2):315-328.21.
Voiriot G, Visseaux B, Cohen J, et al. Viral-bacterial coinfection affects the presentation and alters the prognosis of severe community-acquired pneumonia. Crit Care. 2016;20(1):375.22.
Emonet S, Lazarevic V, Pugin J, Schrenzel J, Ruppé E. Clinical Metagenomics for the Diagnosis of Hospital-acquired Infections: Promises and Hurdles. Am J Respir Crit Care Med. 2017;196(12):1617-1618.23.
Li Y, Ma JM. [Expert consensus on the clinical application of metagenomics sequencing technology in moderate to severe infections (first edition)]. Infect Inflamm Repair. 2020;21(02):75-81.24.
Zhang XM, Zhang WW, Yu XZ, Dou QL, Cheng AS. Comparing the performance of SOFA, TPA combined with SOFA and APACHE-II for predicting ICU mortality in critically ill surgical patients: a secondary analysis. Clin Nutr. 2020;39(9):2902-2909.25.
Stocker M, van Herk W, El Helou S, et al. C-reactive protein, procalcitonin, and white blood count to rule out neonatal early-onset sepsis within 36 hours: a secondary analysis of the neonatal procalcitonin intervention study. Clin Infect Dis. 2021;73(2):e383-e390.26.
Pettilä V, Hynninen M, Takkunen O, Kuusela P, Valtonen M. Predictive value of procalcitonin and interleukin 6 in critically ill patients with suspected sepsis. Intensive Care Med. 2002;28(9):1220-1225.27.
Tan MC, Lu YX, Jiang H, Zhang LD. The diagnostic accuracy of procalcitonin and C-reactive protein for sepsis: a systematic review and meta-analysis. J Cell Biochem. 2019;120(4):5852-5859.28.
Ruan L, Chen GY, Liu Z, et al. The combination of procalcitonin and C-reactive protein or presepsin alone improves the accuracy of diagnosis of neonatal sepsis: a meta-analysis and systematic review. Crit Care. 2018;22(1):316.29.
Chalupa P, Beran O, Herwald H, Kaspříková N, Holub M. Evaluation of potential biomarkers for the discrimination of bacterial and viral infections. Infection. 2011;39(5):411-417.30.
Cao XG, Zhou SS, Wang CY, Jin K, Meng HD. The diagnostic value of next-generation sequencing technology in sepsis. Front Cell Infect Microbiol. 2022;12:899508.31.
Lusk RW. Diverse and widespread contamination evident in the unmapped depths of high throughput sequencing data. PLoS One. 2014;9(10):e110808.32.
Salter SJ, Cox MJ, Turek EM, et al. Reagent and laboratory contamination can critically impact sequence-based microbiome analyses. BMC Biol. 2014;12:87.33.
Liu V, Escobar GJ, Greene JD, et al. Hospital deaths in patients with sepsis from 2 independent cohorts. JAMA. 2014;312(1):90-92.34.
Li SK, Leung RK, Guo HX, et al. Detection and identification of plasma bacterial and viral elements in HIV/AIDS patients in comparison to healthy adults. Clin Microbiol Infect. 2012;18(11):1126-1133.35.
Xiao M, Sun ZY, Kang M, et al. Five-year national surveillance of invasive candidiasis: species distribution and azole susceptibility from the China hospital invasive fungal surveillance net (CHIF-NET) study. J Clin Microbiol. 2018;56(7):e00577-18.36.
Bertolini M, Ranjan A, Thompson A, et al. Candida albicans induces mucosal bacterial dysbiosis that promotes invasive infection. PLoS Pathog. 2019;15(4):e1007717.37.
Nikkari S, McLaughlin IJ, Bi W, Dodge DE, Relman DA. Does blood of healthy subjects contain bacterial ribosomal DNA? J Clin Microbiol. 2001;39(5):1956-1959.38.
Gosiewski T, Ludwig-Galezowska AH, Huminska K, et al. Comprehensive detection and identification of bacterial DNA in the blood of patients with sepsis and healthy volunteers using next-generation sequencing method—the observation of DNAemia. Eur J Clin Microbiol Infect Dis. 2017;36(2):329-336.39.
Huang CR, Chen H, Ding YJ, et al. A microbial world: could metagenomic next-generation sequencing be involved in acute respiratory failure? Front Cell Infect Microbiol. 2021;11:738074.40.
Lamy B, Dargère S, Arendrup MC, Parienti JJ, Tattevin P. How to optimize the use of blood cultures for the diagnosis of bloodstream infections? A state-of-the art. Front Microbiol. 2016;7:697.41.
Hu BC, Tao Y, Shao ZQ, et al. A comparison of blood pathogen detection among droplet digital PCR, metagenomic next-generation sequencing, and blood culture in critically ill patients with suspected bloodstream infections. Front Microbiol. 2021;12:641202.42.
Post JC, Ehrlich GD. The impact of the polymerase chain reaction in clinical medicine. JAMA. 2000;283(12):1544-1546.43.
Dark P, Blackwood B, Gates S, et al. Accuracy of LightCycler(®) SeptiFast for the detection and identification of pathogens in the blood of patients with suspected sepsis: a systematic review and meta-analysis. Intensive Care Med. 2015;41(1):21-33.44.
Abram TJ, Cherukury H, Ou CY, et al. Rapid bacterial detection and antibiotic susceptibility testing in whole blood using one-step, high throughput blood digital PCR. Lab Chip. 2020;20(3):477-489.