INTRODUCTION
Antibody-mediated rejection (AMR) is the most common cause of allograft rejection and loss, and occurs when circulating donor-specific antibodies (DSAs) interact with the graft endothelium, triggering endothelial cell activation and recruitment of inflammatory cells to the vasculature via a cascade of both complement-dependent and -independent mechanisms. This can cause acute graft injury and lead to chronic graft injury through laying down of matrix in glomeruli, peritubular capillaries and arteries. The diagnosis of AMR is reached using the Banff Classification for Allograft Pathology and requires three elements: (i) histological features of AMR (Criterion 1); (ii) evidence of interaction between a DSA and the endothelium (Criterion 2); and (iii) evidence of a DSA (Criterion 3). Following the discovery of increased endothelial and natural killer (NK)-cell-related transcripts in biopsies with AMR [], the Banff Classification was modified in 2013 and 2017, to include ‘increased expression of thoroughly validated gene transcripts/classifiers in the biopsy tissue strongly associated with AMR’ either as evidence of interaction of a DSA with tissue (Criterion 2) and/or as evidence of a DSA itself (Criterion 3) []. Therefore, in the presence of histological features of AMR (Criterion 1), ‘increased expression of thoroughly validated gene transcripts/classifiers in the biopsy tissue strongly associated with AMR’ defines cases with AMR.
Several studies have confirmed increased expression of endothelial-associated or NK-associated transcripts in AMR, using microarray analysis [, ], quantitative real-time polymerase chain reaction (qRT-PCR) [] or Nanostring nCounter analysis [, ]. Using microarray analysis, Sellares et al. showed that the AMR gene signature was associated with increased graft loss (GL) [, ], and Loupy et al. showed that adding an AMR molecular score to serology and histology data improved stratification of patients with AMR for their risk of GL []. We have previously reported that in patients with a de novo DSA, a subset of transcripts associated with AMR measured using qRT-PCR is associated with GL []. None of these studies, however, investigates the precise application of molecular analysis in the diagnosis of AMR as defined in the Banff Classification.
The aim of this study was to investigate an AMR-associated gene score in the context of use proposed in the Banff classification, by analysing whether increased expression of the AMR-associated gene set defines, amongst cases meeting Criterion 1 alone, a group of cases more closely aligned with AMR in terms of their outcome.
MATERIALS AND METHODS
Study population and data collection
The study population comprised patients from Imperial College Healthcare National Heath Service (NHS) Trust with a transplant biopsy between 20 July 2010 and 6 November 2018, for which a sample in RNAlater was obtained with sufficient RNA available (500 ng). Renal transplant biopsy cores were obtained under ultrasound guidance with an 18-gauge spring-loaded needle. At least half or a full core was placed in RNAlater (Life Technologies, Paisley, UK). Tissue was obtained from the Imperial College Healthcare NHS Trust Tissue Bank, which has ethics approval to both collect human tissue and release material to researchers (MREC 17/WA/0161). Patients were followed up to February 2020.
Clinical and pathological features
Cases were classified according to Banff 2017 [] criteria, using histological and serological data, excluding results of gene expression analysis. Acute tubular injury on its own was not considered a criterion for histological evidence of AMR. Cases identified in this way as meeting the full diagnostic criteria for AMR according to Banff 2017 are designated ‘AMR’.
Cases that fulfilled Criterion 1 but that would only meet a diagnosis of AMR with ‘increased expression of thoroughly validated gene transcripts/classifiers strongly associated with AMR’ were designated suspicious for AMR (AMRsusp).
Criterion 1 was considered fulfilled in cases with g+ peritubular capillaritis (ptc) >0 [with the usual restrictions related to presence of glomerulonephritis or borderline/T-cell-mediated rejection for glomerulitis (g) and ptc, respectively] and/or v and/or thrombotic microangiopathy (TMA) and/or glomerular capillary wall double contours (cg) >1a or ptcbml (defined according to the current Banff definition of AMR []). Borderline for T-cell-mediated rejection was defined as at least i1 and at least t1. No-AMR designates the cases that did not fulfil Criterion 1.
Serological detection of anti-HLA DSAs
DSAs were assessed using LABScreen mixed beads (One Lambda, Inc., Canoga Park, CA, USA) and, if positive, the anti-HLA antibody specificity was identified using LABScreen single antigen beads as previously described [].
RNA extraction, qPCR and Z-score transformation
RNA was extracted from the whole tissue as previously described []. RNA concentration and purity were quantified with a NanoDrop 2000c Spectrophotometer (LabTech, East Sussex, UK). Total RNA was converted directly into cDNA with random hexamer priming []. qRT-PCR was carried out using an Applied Biosystems Vii7 real-time qPCR machine []. Gene-specific primers spanning an intron were designed for 18 genes from a list of ‘top hits’ for AMR in the literature (Supplementary data, Table S1) [, , , , , ]. Gene expression levels were normalized to housekeeping gene HPRT1 and results were measured relative to Stratagene qRT-PCR Reference RNA (Agilent Technologies using the ΔΔCt method) [].
To compare gene expression levels between genes with differing levels of expression, we performed Z-score normalization [Z = (x – mean)/SD] across all samples tested.
Data analysis
Descriptive data are presented in tables and were analysed using chi-square for categorical parameters and ANOVA or Kruskal–Wallis (KW) for continuous parameters. Correlation between parameters was analysed using Spearman’s rank correlation and illustrated using heat map analysis with hierarchical clustering by Euclidean distance (Cluster 3.0 []). P-values were corrected using Bonferroni correction. Groups were compared using the Mann–Whitney test. Gene cut-off was determined using receiver operating characteristic (ROC) curve analysis. Outcome analysis was performed using Kaplan–Meier survival curves and Cox proportional hazards regression.
Analyses were performed in IBM SPSS version 25 (IBM Corp., Chicago, IL, USA) and on R version 4.0.3.
RESULTS
Study population, demographic and histological characteristics
From an initial set of 665 archived cDNA samples [], 365 samples had sufficient cDNA (>500 ng) for the current analysis. Forty-three samples were excluded due to technical problems during the PCR analysis (poor triplicates and gene expression levels for housekeeping genes with ct value >34); another 25 were excluded because they were from the same patient. Where several biopsies from the same patient were taken, only one biopsy was included, either the first sample with rejection or, if no biopsies showed rejection, the first chronological sample. The total number of samples retained for analysis was 297, comprising 27 AMR, 49 AMRsusp and 221 No-AMR.
Demographic characteristics are presented in Table 1. In comparison with the other groups, the AMR group was younger (P = 0.007) and had a higher proportion of females (P = 0.0003).
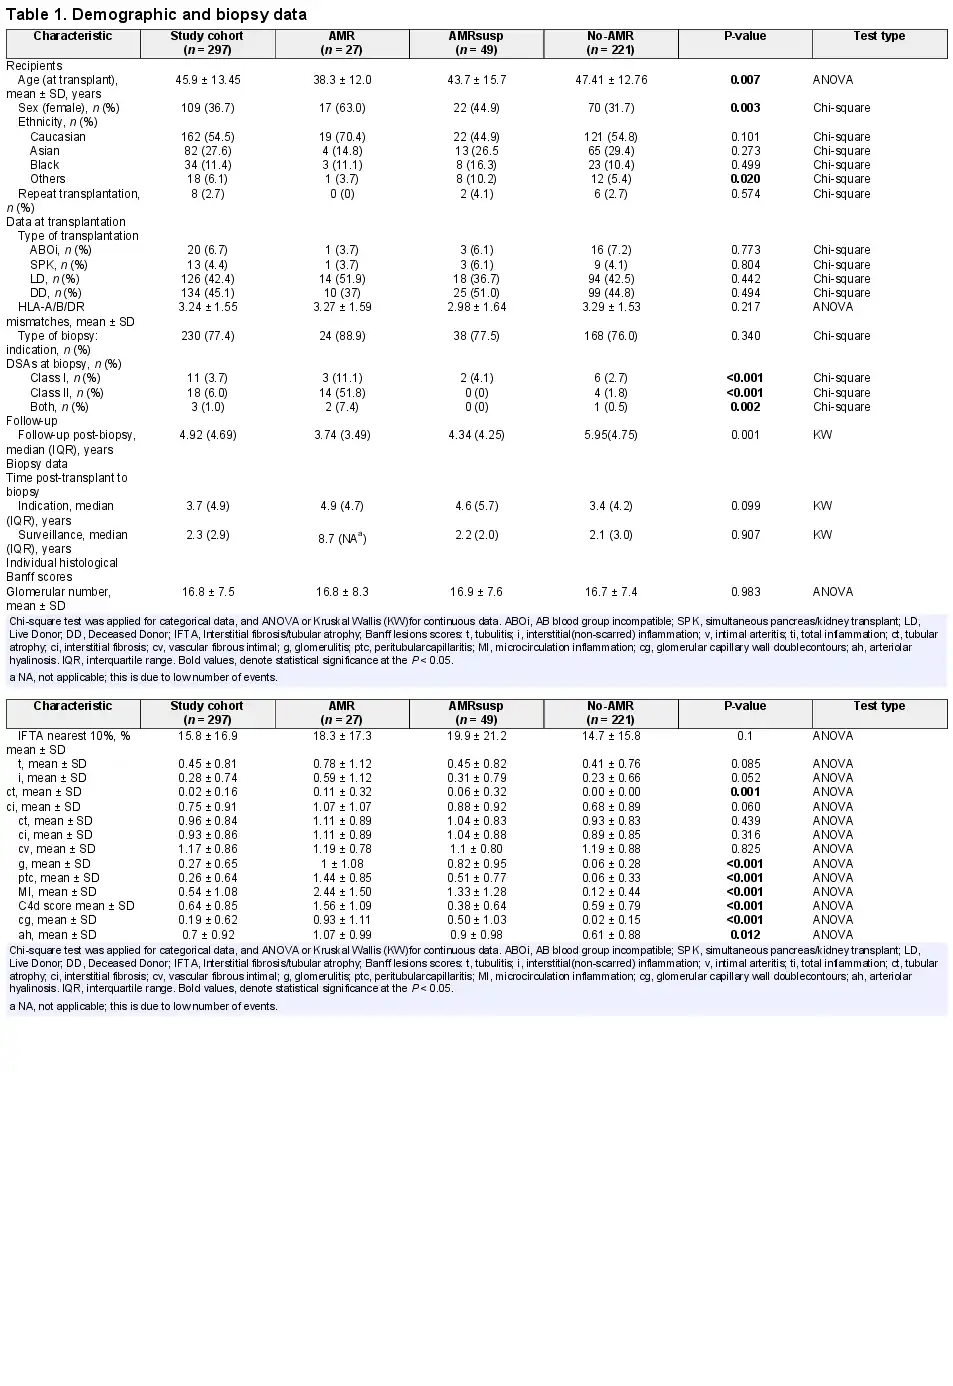
Histological features are presented in Table 2. There were higher scores for g, ptc, intimal arteritis (v) and cg, arteriolar hyalinosis (ah) and microcirculation inflammation (MI) in the AMR and AMRsusp groups compared with No-AMR. Details of the main diagnoses in each group are presented in Supplementary data, Table S2.
Of the 49 AMRsusp cases, 15 were included for TMA. Thirty-seven cases were included because of the presence of g + ptc MI > 0. Of those, 23 had an MI = 1 (2/23 also with features of chronicity), 17/23 with isolated g and 6/23 with isolated ptc. Most of these MI = 1 cases did not have complement component 4 (C4d; 21/23) or evidence of a DSA (22/23). The remaining 14 cases had an MI > 1 (10/14 also with features of chronicity), without C4d or DSA (Table 2).
Selection of the AMR-associated gene panel and testing of its association with AMR
‘Top hits’ for AMR from the literature were selected. We discounted genes with >50% missing values in the qRT-PCRs, due to a ct value >34 and/or bad triplicates. We tested each gene for its association with AMR in a discovery (n = 151) and a validation cohort (n = 146), using a Mann–Whitney test and ROC curve analysis. We retained genes with significant association with AMR in both tests and both cohorts (Supplementary data, Figure S1): PECAM-1, GNLY, DARC, MYBL1, CXCL11, KLRF1, KLF4, CXCL10, PLA1a and SH2d1b. We derived an AMR 10-gene score using the sum of Z-scores of the 10 retained genes. The 10-gene score predicted a diagnosis of AMR in both discovery and validation cohorts (Supplementary data, Figure S1).
The AMR 10-gene score was significantly higher in AMR than in AMRsusp (P < 0.001) and No-AMR (P < 0.001; Figure 1A). Expression in the AMRsusp group was also significantly higher than the No-AMR group (P < 0.001). Within the AMR group, there was no significant difference in the AMR 10-gene score between cases with features of AMR chronicity and those without (data not shown). The AMR 10-gene score was significantly different between the AMR group and TCMR cases in the No-AMR group (Mann–Whitney, P = 0.0001). There were 16 ABO-incompatible (ABOi) transplants in the No-AMR group; there was no significant difference of expression between ABOi and ABO compatible cases (Mann–Whitney, P = 0.836).
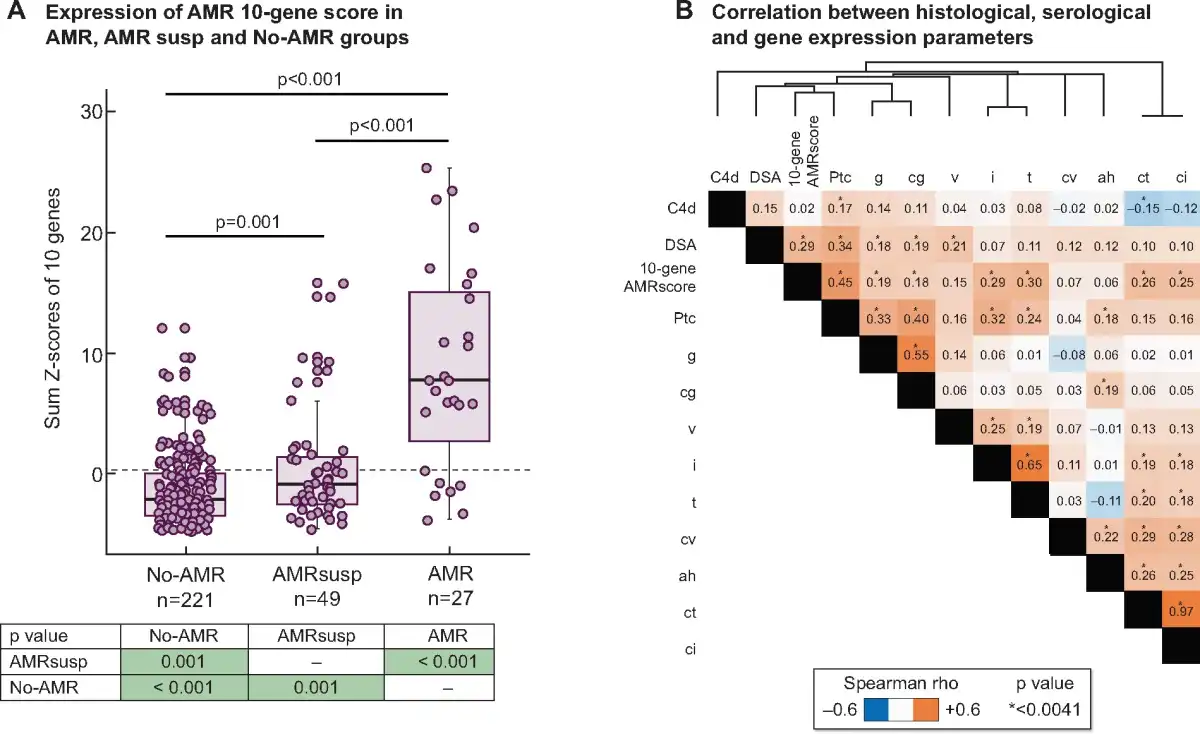
FIGURE 1
Expression and correlations of the AMR 10-gene score. (A) Expression of AMR 10-gene score in AMR, AMRsusp and No-AMR groups. The box plots represent the distribution of the AMR 10-gene score expression in three groups: AMR (n = 27), AMRsusp (n = 49) and No-AMR (n = 221). Each dot represents one individual sample. Mann–Whitney statistical test was applied comparing groups two by two, with P-values in the table below. (B) Correlation between histological, serological and gene expression parameters. The heatmap represents correlation between parameters. The colour intensity in each box represents the level of correlation measure (Spearman rho) between the conditions, with orange representing positive correlation and blue negative correlation. The asterisks in the boxes relate to significance corrected using Bonferroni method (*P < 0.0041). Parameters are ordered using a hierarchical clustering by Euclidean distance according to the Spearman rho value.
We tested the correlation between the AMR 10-gene score and histological and serological features, using Spearman rank correlation (Figure 1B) as previously described []. The AMR 10-gene score showed significant correlation with all histological features of rejection [g, ptc, tubulitis (t), interstitial (non-scarred) inflammation (i), v and cg], and also with features of chronicity.
Graft outcome analysis without and with molecular data
There were 65 allograft failures, 15 in the AMR group, 17 in the AMRsusp group and 33 in the no-AMR group. Death-censored Kaplan–Meier survival curve for GL from time of biopsy was carried out comparing AMR, AMRsusp and No-AMR (Figure 2A). There was significantly worse graft survival for AMR compared with AMRsusp (P = 0.047) and No-AMR (P < 0.0001). AMRsusp had an intermediate graft survival rate between No-AMR and AMR. The survival at 5 years was 89% for No-AMR, 69% for AMRsusp and 48% for AMR group.
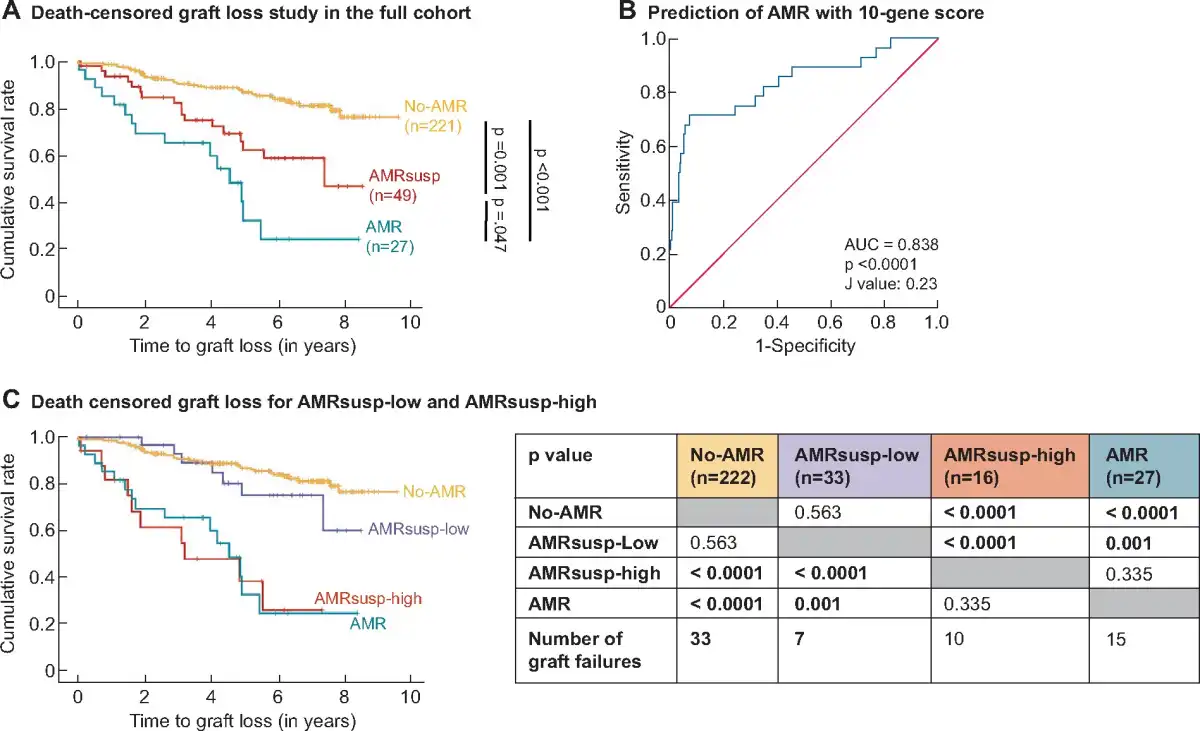
FIGURE 2
Outcome analysis. (A) Outcome analysis was performed using Kaplan–Meir survival curves. Graft survival (in years) from time of biopsy was plotted for No-AMR (orange line), AMRsusp (red line) and AMR (green line). Data were censored for patient death with functioning graft. Statistical analysis was carried out using a Breslow test. (B) ROC curve analysis for the AMR 10-gene score predicting AMR diagnosis, revealed as an AUC of 0.838 (95% CI 0.749–0.943, P < 0.0001). Youden’s J statistic was used to define the cut off for the AMR 10-gene score as >0.23. (C) The cut-off value was used to split the AMRsusp group into AMRsusp-low (AMRsusp samples with an AMR 10-gene score <0.23) and AMRsusp-high (AMRsusp samples with an AMR 10-gene score >0.23). Outcome analysis was performed using Kaplan–Meir survival curves. Graft survival from time of biopsy (in years) was plotted for No-AMR (orange line), AMRsusp-low (blue line), AMRsusp-high (red line) and AMR (green line). Data were censored for patient death with functioning graft. Statistical analysis was carried out using a Breslow test (results presented in the table).
To determine a cut-off value for the AMR 10-gene score, we performed ROC curve analysis on the full cohort (Figure 2B). The area under the curve (AUC) for a diagnosis of AMR versus No-AMR was 0.838 [95% confidence interval (CI) 0.749–0.943, P < 0.0001]. Youden’s J statistic identified a cut-off value of 0.23, which was used to split AMRsusp samples, by gene score, into AMRsusp-high (n = 16/49) and AMRsusp-low (n = 33/49). The 5-year survival was 44% for AMRsusp-high and 82% for AMRsusp-low.
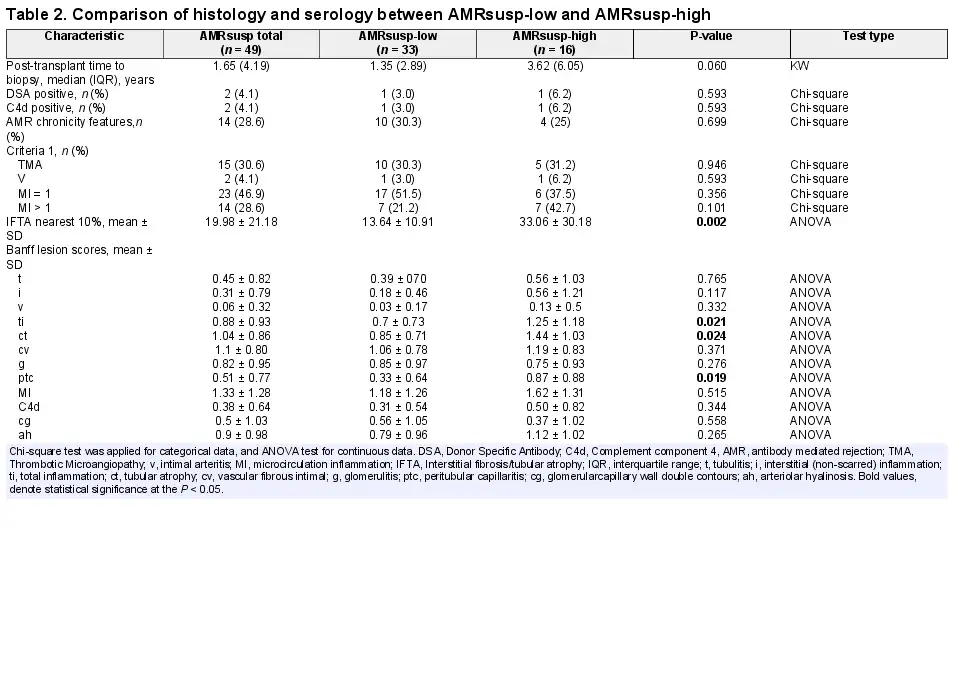
The characteristics of the AMRsusp-high and AMRsusp-low groups are compared in Table 2. AMRsusp-high showed significantly more interstitial fibrosis/tubular atrophy (ct), a higher total inflammation (ti) score, a higher ptc score and a non-significant trend to being performed later in time post-transplant.
Death-censored Kaplan–Meier survival curve for GL from time of biopsy was performed comparing AMRsusp-low and AMRsusp-high (Figure 2C). We observed a significantly better survival rate in AMRsusp-low compared with AMRsusp-high (P < 0.0001). Survival in the AMRsusp-high aligned with the AMR group (P = 0.335), and AMRsusp-low aligned with the No-AMR group (P = 0.563).
Applying molecular data to the whole cohort, there was a significant difference in survival curves between cases with high and low AMR 10-gene scores (P < 0.001) (Supplementary data, Figure S2A). However, there was no significant difference in survival curves between No-AMR-low and No-AMR-high (P = 0.431; Supplementary data, Figure S2B) or between AMR-low and AMR-high (P = 0.889; Supplementary data, Figure S2C).
Uni- and multivariate analysis of serological, histological and molecular features for predicting kidney graft failure
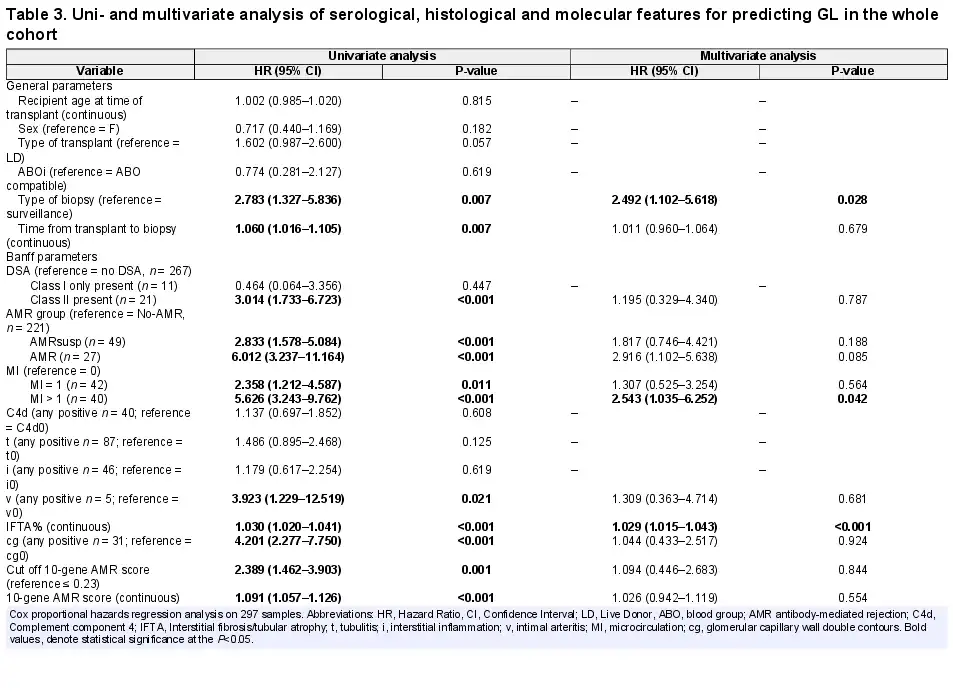
We used Cox proportional hazard regression to predict graft failure, in both uni- and multivariate analyses, in the whole cohort of biopsies (Table 3). Significant predictors for GL in the univariate analysis included type of biopsy (indication versus surveillance) [hazard ratio (HR) = 2.783, P = 0.007], time from transplant to biopsy (HR = 1.060, P = 0.0007), the presence of a class II DSA (HR = 3.014, P ≤ 0.001), a diagnosis of AMR (HR = 6.012, P < 0.001) or AMRsusp (HR = 2.833, P < 0.001), an MI score of 1 (HR = 2.358, P = 0.011) or MI > 1 (HR = 5.626, P < 0.001), v > 0 (HR = 3.923, P = 0.021), IFTA% (HR = 1.030, P < 0.001), cg > 0 (HR = 4.201, P < 0.001), and the AMR 10-gene score as a dichotomous (HR = 2.389, P = 0.001) or a continuous (HR = 1.091, P < 0.001) parameter. In the multivariate analysis, only type of biopsy (HR = 2.492, P = 0.028), MI > 1 (HR = 2.543, P = 0.042) and IFTA% (HR = 1.029, P < 0.001) were retained.
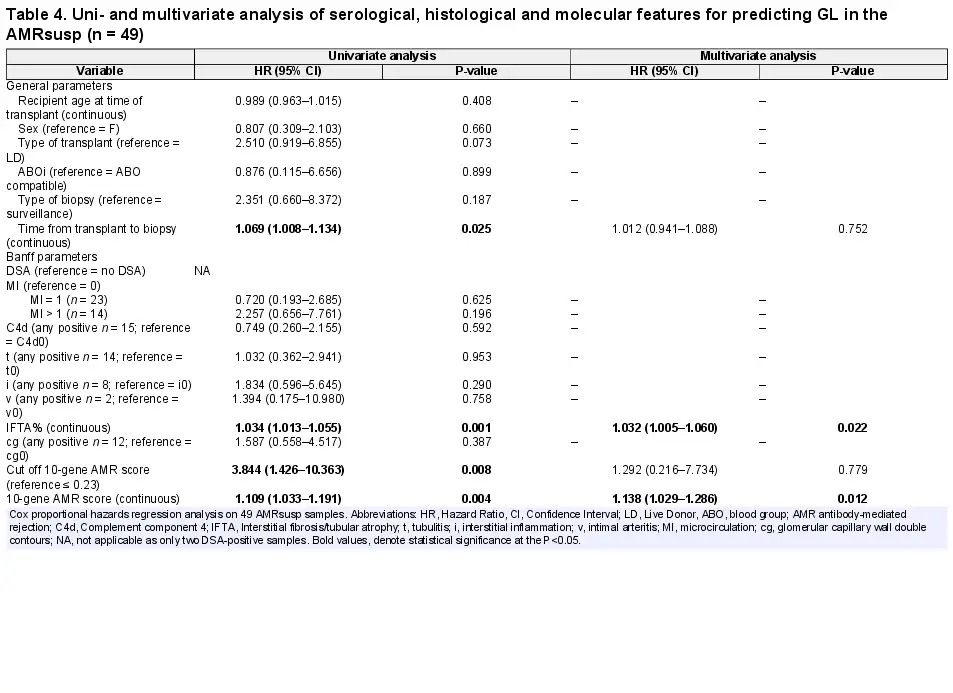
The same analysis was applied to the AMRsusp group (Table 4). In the univariate analysis, time from transplant to biopsy (HR = 1.069, P = 0.025), IFTA% (HR = 1.034, P = 0.001), and the AMR 10-gene score either dichotomous (HR = 3.844, P = 0.008) or continuous (HR = 1.109, P = 0.004) were significant. In the multivariate analysis, only IFTA% (HR = 1.032, P = 0.022) and the continuous AMR 10-gene score (HR = 1.138, P = 0.012) were retained.
Finally, to simulate the clinical use of these variables, logistic regression models were generated using different combinations of three variables: (H) for histology of AMR (as described in Materials and methods), (D) for DSA and/or C4d positivity and (G) for an AMR 10-gene score above threshold (Supplementary data, Figure S3; according to previously published method []). The full D + H + G model incorporating all variables demonstrated a larger ROC AUC than each of the reduced models (AUC = 70.6% in the full cohort, 69.3% in the AMRsusp group) although this did not reach statistical significance when compared with D + H in either group. Net reclassification index (NRI) analysis demonstrated improved risk classification with the full D + H + G model versus the D + H reduced model in the AMRsusp group (NRI = 62.1%, P = 0.028), but not in the full cohort (NRI = 26.1%, P = 0.059). Integrated discrimination improvement (IDI) also demonstrated superior discrimination with the D + H + G model compared with D + H only in the AMRsusp group (IDI = 16.2%, P = 0.014) but not in the full cohort (IDI = 1.6%, P = 0.112) (Supplementary data, Figure S3B).
DISCUSSION
Gene expression analysis in the diagnosis of AMR was introduced in the 2013 revision of the Banff Classification for Allograft Pathology, but its context of use has never been tested. Most centres still use ‘standard of care’ (SOC) in analysis of transplant biopsies, i.e. histological analysis interpreted in the context of serological data for a DSA. In this study, we compared SOC with SOC + the addition of an AMR 10-gene score, with GL as an outcome. We found improved outcome prediction when adding the AMR 10-gene data to histological and serological data, but not in all biopsies. The 10-gene score only improved prediction of GL in AMRsusp cases, i.e. cases that show histological evidence of antibody-mediated injury (Criteria 1), but that would only fulfil Criteria 2 (evidence of recent/current interaction of antibody with endothelium) and Criteria 3 (evidence of a circulating DSA) on the basis of gene expression data.
We re-visited the histological and serological characteristics of this group of AMRsusp cases, to see if we could identify particular features in cases with a high AMR 10-gene score compared with those without. Biopsies with a high gene score showed significantly more interstitial fibrosis (ci)/ct (IFTA), a higher ti and a higher ptc score. We suspect this may be related to the fact AMRsusp-high cases showed a trend to being taken at a later time post-transplant, and may indicate that cut-off Banff lesion scores for diagnosis of AMR could be time-sensitive, e.g. for biopsies taken later post-transplant, the selection of a lower ptc score cut-off score for a diagnosis of AMR might increase diagnostic accuracy.
In cases that were clearly AMR using SOC only (i.e. our ‘AMR’ group) and in cases that would never be AMR, even including transcript data (i.e. our ‘No-AMR’ group), the AMR 10-gene score does not appear to improve outcome prediction. This confirms the importance of defining the ‘context of use’ of a biomarker before its validation and clinical implementation []. Although applying gene classifiers to unselected cohorts has a central role in biomarker discovery, translation to clinical practice requires a different approach that takes into consideration net clinical benefit and cost-effectiveness compared with SOC. This is particularly important in transplant biopsies, where tissue is scarce, and best use of remaining tissue is dictated by the initial histological findings. For example, elements of the SOC approach that are important to patient management but that cannot be identified using molecular diagnosis include recurrent glomerulonephritis, the degree of scarring and vascular features.
The use of qRT-PCR on a selected gene panel could help disseminate the practice of gene expression analysis, as this is a cheap technology for which most routine diagnostic laboratories have equipment and expertise. It can be performed rapidly and on a single sample at a time if needed. However, it requires a sample taken in RNA preservative to yield large amounts of good quality RNA and its introduction into routine diagnosis would require the introduction of synthetic standards to support inter-laboratory reproducibility.
Our gene selection was based on literature review and confirmed association with AMR in our cohort. The 10-gene panel selected for association with a diagnosis of AMR was then analysed for its association with outcome and found to be predictive of GL. The 10 AMR-associated genes are also present in other AMR-associated gene lists such as the Banff Human Organ Transplant (B-HOT) panel used for Nanostring [] and the pathogenesis‐based transcript sets (core transcript set group DSAT and NKB) for microarray studies []. This approach mirrors previous attempts to establish biomarkers for AMR that are both diagnostic (based on their association with serological and histological features) and prognostic (based on their association with outcome). Our panel may not represent the optimal panel for each of these aims. Future multicentre studies on larger unselected cohorts will inform optimal gene selections for defined purposes, including gene weighting. We did not test in this study whether the AMR 10-gene score is applicable using other techniques, or other sample types, such as formalin-fixed paraffin-embedded tissue. However, in another manuscript where we investigated whether results of gene expression analysis performed using qRT-PCR on samples preserved in RNAlater correlated with results using Nanostring nCounter analysis on formalin-fixed paraffin-embedded tissue, these 10 genes correlated well []. We previously observed that there was good correlation between measurements of AMR-associated genes, when comparing two different cores from the same kidney transplant, using two different techniques (Nanostring and qRT-PCR) [].
This study has limitations. First, we used a retrospective cohort limited to 297 samples, selected based on the availability of sufficient quantities of cDNA for qRT-PCR analysis. Although it contains a mix of diagnoses that are representative of our biopsy population, we cannot exclude a sample bias. Second, this is a retrospective cohort with varied therapeutic strategies, so we were not able to capture response to AMR treatment as an outcome. Prospective cohort analyses, preferably in the context of clinical trials of AMR, are needed. We used the commonly accepted graft failure as our outcome measure. GL has many causes other than AMR; the study design and balanced demographic and transplant data between the groups only go part of the way to correcting for this limitation [].
In summary, we provide evidence for the first time that an AMR 10-gene score can improve prediction of graft outcome in the context of use proposed in the Banff Classification for Allograft Pathology. Larger, multicentre prospective studies will be needed to better define optimal gene scores for a variety of gene expression analysis techniques.
ACKNOWLEDGEMENTS
We thank Dr Ben Adam for sharing R scripts for logistic regression analysis, and for helpful comments. Human samples used in this research project were obtained from the Imperial College Healthcare Tissue Bank (ICHTB). ICHTB is supported by the National Institute for Health Research (NIHR) Biomedical Research Centre based at Imperial College Healthcare NHS Trust and Imperial College London.
REFERENCES
- 1. Halloran PF, Famulski KS, Reeve J. Molecular assessment of disease states in kidney transplant biopsy samples. Nat Rev Nephrol2016; 12: 534–548
- 2. Sis B, Jhangri GS, Bunnag S et al Endothelial gene expression in kidney transplants with alloantibody indicates antibody-mediated damage despite lack of C4d staining. Am J Transplant2009; 9: 2312–2323
- 3. Hidalgo LG, Sis B, Sellares J et al NK cell transcripts and NK cells in kidney biopsies from patients with donor-specific antibodies: evidence for NK cell involvement in antibody-mediated rejection. Am J Transplant2010; 10: 1812–1822
- 4. Yazdani S, Callemeyn J, Gazut S et al Natural killer cell infiltration is discriminative for antibody-mediated rejection and predicts outcome after kidney transplantation. Kidney Int2019; 95: 188–198
- 5. Haas M, Loupy A, Lefaucheur C et al The Banff 2017 kidney meeting report: revised diagnostic criteria for chronic active T cell-mediated rejection, antibody-mediated rejection, and prospects for integrative endpoints for next-generation clinical trials. Am J Transplant2018; 18: 293–307
- 6. Hayde N, Bao Y, Pullman J et al The clinical and molecular significance of C4d staining patterns in renal allografts. Transplantation2013; 95: 580–588
- 7. Hayde N, Broin PO, Bao Y et al Increased intragraft rejection-associated gene transcripts in patients with donor-specific antibodies and normal biopsies. Kidney Int2014; 86: 600–609
- 8. Dominy KM, Roufosse C, de Kort H et al Use of quantitative real time polymerase chain reaction to assess gene transcripts associated with antibody-mediated rejection of kidney transplants. Transplantation2015; 99: 1981–1988
- 9. Dominy KM, Willicombe M, Al Johani T et al Molecular assessment of C4d-positive renal transplant biopsies without evidence of rejection. Kidney Int Rep2019; 4: 148–158
- 10. Adam B, Afzali B, Dominy KM et al Multiplexed color-coded probe-based gene expression assessment for clinical molecular diagnostics in formalin-fixed paraffin-embedded human renal allograft tissue. Clin Transplant2016; 30: 295–305
- 11. Sellares J, Reeve J, Loupy A et al Molecular diagnosis of antibody-mediated rejection in human kidney transplants. Am J Transplant2013; 13: 971–983
- 12. Loupy A, Lefaucheur C, Vernerey D et al Molecular microscope strategy to improve risk stratification in early antibody-mediated kidney allograft rejection. J Am Soc Nephrol2014; 25: 2267–2277
- 13. Roufosse C, Simmonds N, Clahsen-van Groningen M et al A 2018 reference guide to the Banff classification of renal allograft pathology. Transplantation2018; 102: 1795–1814
- 14. Loupy A, Haas M, Solez K et al The Banff 2015 kidney meeting report: current challenges in rejection classification and prospects for adopting molecular pathology. Am J Transplant2017; 17: 28–41
- 15. Toulza F, Dominy K, Cook T et al Technical considerations when designing a gene expression panel for renal transplant diagnosis. Sci Rep2020; 10: 17909
- 16. Livak KJ, Schmittgen TD. Analysis of relative gene expression data using real-time quantitative PCR and the 2(-Delta Delta C(T)) method. Methods2001; 25: 402–408
- 17. de Hoon MJ, Imoto S, Nolan J et al Open source clustering software. Bioinformatics2004; 20: 1453–1454
- 18. Roufosse C, Drachenberg C, Renaudin K et al Molecular assessment of antibody-mediated rejection in human pancreas allograft biopsies. Clin Transplant2020; 34: e14065
- 19. Naesens M, Friedewald J, Mas V et al A practical guide to the clinical implementation of biomarkers for subclinical rejection following kidney transplantation. Transplantation2020; 104: 700–707
- 20. Mengel M, Loupy A, Haas M et al Banff 2019 meeting report: molecular diagnostics in solid organ transplantation-consensus for the Banff Human Organ Transplant (B-HOT) gene panel and open source multicenter validation. Am J Transplant2020; 20: 2305–2317
- 21. Halloran PF, de Freitas DG, Einecke G et al The molecular phenotype of kidney transplants. Am J Transplant2010; 10: 2215–2222
- 22. Einecke G, Reeve J, Gupta G et al; INTERCOMEX Investigators. Factors associated with kidney graft survival in pure antibody-mediated rejection at the time of indication biopsy: importance of parenchymal injury but not disease activity. Am J Transplant2021; 21: 1391–1401