Introduction
Chronic obstructive pulmonary disease (COPD) is a common, generally preventable, and treatable disease characterized by persistent respiratory symptoms and airflow limitation []. Emphysematous changes [] and airway wall thickness [] on chest computed tomography (CT) correlate with the degree of airflow limitation in patients with COPD. The frequency of COPD exacerbation is an important outcome measure in COPD. Several reports showed that exacerbations are associated with poor health status [] and poor prognosis []. Thus, previous reports, including ours, have described several biomarkers such as serum Clara cell secretory protein-16, eosinophil count, and neutrophil-lymphocyte ratio to predict future exacerbations in patients with COPD [-].
COPD is associated with cardiovascular disease and is characterized by specific electrocardiography (ECG) abnormalities []. ECG abnormalities of rhythm, axis, and electrical conduction have been described in patients with COPD []. The P-wave and QRS axis can be easily obtained by ECG using the established algorithms [, ]. The P-wave axis reflects atrial depolarization, and the QRS axis relates to the spread of left and right ventricular depolarization, which is dominated by the left ventricular function []. The vertical P-wave axis is a useful criterion to screen for COPD [], as the P-wave axis correlates with the degree of emphysematous changes on chest CT []. In addition, the QRS axis, as well as the P-wave axis, is related to the degree of airflow obstruction and lung hyperinflation in patients with COPD []. To the best of our knowledge, no clinical studies to date have correlated the clinical characteristics of patients with COPD, especially health status and exacerbation frequency, with the vertical P-wave and QRS axis. We hypothesized that patients with COPD with a vertical P-wave axis exhibit a poor health status and frequent exacerbations. The study aimed to (1) investigate the clinical characteristics of patients with COPD with a vertical P-wave axis and to (2) compare the P-wave axis and QRS axis to predict the airflow obstruction severity, health status, and future exacerbations in a Japanese multicenter, 3-year observational cohort study (Keio COPD Comorbidity Research, K-CCR) [, , -].
Methods
Study Population
The overall design of the K-CCR has been previously described [, ]. In brief, this was a 3-year, prospective observational study that enrolled 572 men and women aged 40–91 years who were diagnosed (n = 440) or at risk (n = 132) for COPD between April 2010 and December 2012 [, ]. For this study, 201 patients with spirometrically confirmed COPD and with ECG and CT data were included, while patients with atrial fibrillation were excluded (online suppl. Fig. 1; for all online suppl. material, see http://www.karger.com/doi/10.1159/000519668). All patients were clinically stable and had no exacerbations or acute infections for at least 1 month prior to recruitment [, ]. The Ethics Committees of Keio University and its affiliated hospitals approved the study protocol. Each patient provided written informed consent for the analysis and presentation of their data.
Assessment of Clinical Parameters
Complete medical and smoking histories, as well as information regarding the current pharmacologic treatments, were obtained on enrollment and annually thereafter [, ]. All patients were assessed by spirometry and chest CT imaging. On the CT images, the extent of emphysema was quantified using the ratio of the low attenuation area (LAA%) and the percentage of the airway wall area (WA%) by custom-made software (AZE Ltd., Tokyo, Japan) []. Blood samples were analyzed for brain natriuretic peptide (BNP) levels. Independent investigators evaluated the number and severity of exacerbations based on the physicians’ reviews of the medical records, as previously reported []. COPD exacerbation was defined as the requirement for treatment with systemic corticosteroids and/or antibiotics []. Immediately after enrollment, all of the following questionnaires were completed by the patients with their respective homes, while they were in a stable state. The Japanese version of the COPD assessment test (CAT) [, ] and the St. George’s Respiratory Questionnaire (SGRQ) in Japanese [-] were used for health status assessments.
Electrocardiography
Standard 12-lead ECG was performed by trained technicians using a Cardiofax V ECG-1550 (Nihon Kohden, Tokyo, Japan). ECG calibration was performed at 25 mm/s and 10 mm/mV. We assessed the P-wave and QRS axis of the ECG electronically. Every analyzed ECG was checked by an experienced cardiologist to confirm the automatic analysis. The vertical P-wave axis is defined as >75° [, ].
Echocardiography
Echocardiography measurements were obtained using 2 commercially available echocardiography systems (GE Vivid7/Vivid9; GE Healthcare, Horten, Norway; and iE33/Sonos7500; Philips, Amsterdam, Netherlands), and the estimated systolic pulmonary artery pressure, left ventricular ejection fraction, and inferior vena cava (IVC) diameter were obtained, as previously reported [].
Statistical Analysis
Data are presented as mean ± standard deviation (SD) or median interquartile range. Data were compared between the 2 groups using Student’s t test, Mann-Whitney U test, and χ2 test. Univariate logistic regression analyses were performed to assess the effects of the P-wave axis and QRS axis on airway obstruction and COPD exacerbation. Receiver operating characteristic (ROC) curves were constructed to assess the areas under the curve (AUC). The optimal cutoff values were determined by maximizing the Youden index.
Results
Comparison of Baseline Characteristics
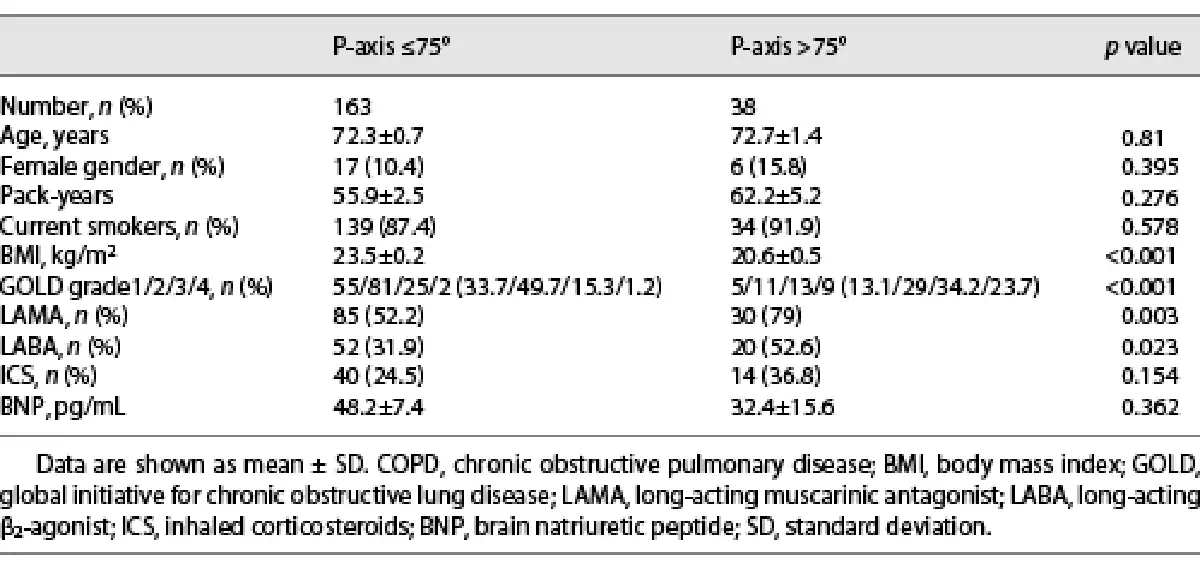
The comparison of baseline characteristics between the patients with a P-wave axis ≤75° and a P-wave axis >75° is shown in Table 1. The severity of COPD according to the global initiative for chronic obstructive lung disease (GOLD) grading was higher in patients with a P-wave axis >75° than in those with a P-wave axis ≤75°. In addition, the body mass index (BMI) was significantly lower, and the prescription rate of long-acting muscarinic antagonists and long-acting β2-agonists was significantly higher in patients with a P-wave axis >75° than in those with a P-wave axis ≤75°. There were no differences in age, the ratio of females, and serum BNP levels between the 2 groups.
Comparison of Pulmonary Function
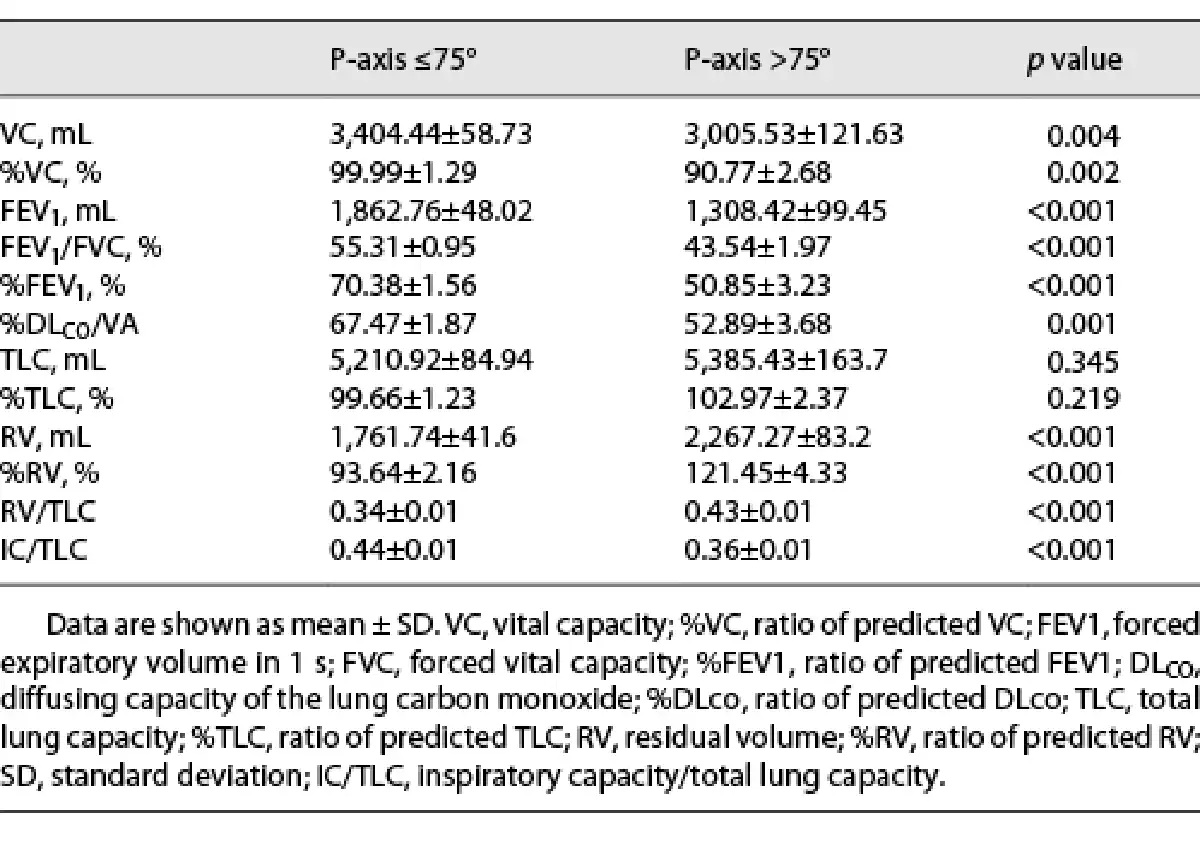
The comparison of pulmonary function test results between the patients with a P-wave axis ≤75° and a P-wave axis >75° is shown in Table 2. The forced expiratory volume in 1 s (FEV1) and the forced expiratory volume in 1 s as a percentage of the predicted FEV1 (%FEV1) were significantly lower in patients with a P-wave axis >75° than in those with a P-wave axis ≤75°. In addition, the residual volume (RV), residual volume as a percentage of the predicted residual volume (%RV), and the RV/total lung capacity (RV/TLC) ratio were significantly higher; the inspiratory capacity/total lung capacity (IC/TLC) ratio and vital capacity (VC) were significantly lower in the patients with a P-wave axis >75° than in those with a P-wave axis ≤75°. Moreover, the ratio of predicted diffusing capacity of lung carbon monoxide divided by the alveolar volume was significantly lower in patients with a P-wave axis >75° than in those with a P-wave axis ≤75°. These results imply that the degrees of airflow obstruction, lung hyperinflation, and diffusion impairment were more severe in patients with COPD with a P-wave axis >75° than in those with a P-wave axis ≤75°.
Comparison of Health Status
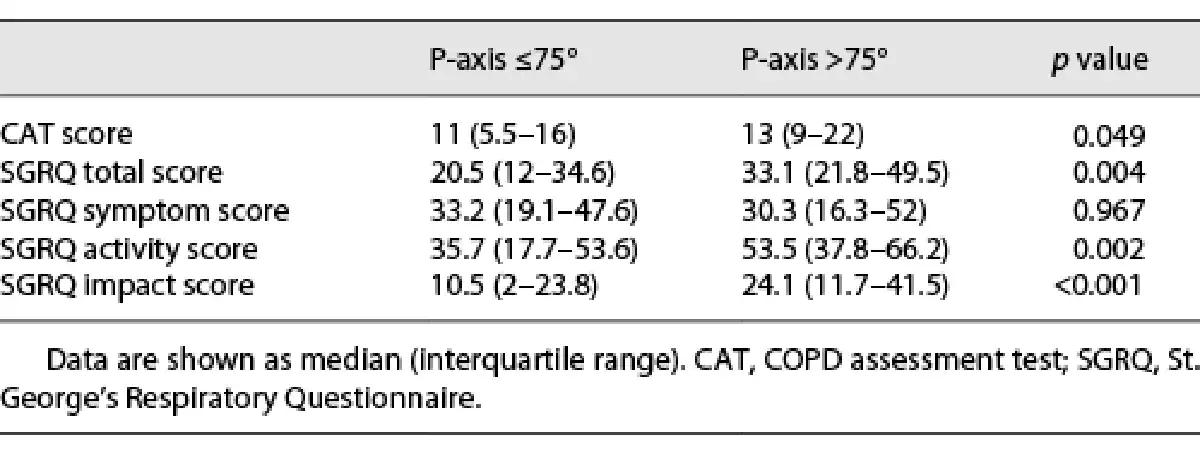
The comparison of the health status of patients with a P-wave axis ≤75° and a P-wave axis >75° is shown in Table 3. At baseline, patients with a P-wave axis >75° exhibited significantly higher total CAT scores, SGRQ total, activity, and impact scores than those with a P-wave axis ≤75°. The differences between the 2 groups, which were statistically significant, exceeded the clinical relevance threshold of 2 and 4 units for CAT [] and SGRQ [], respectively.
Comparison of the Exacerbation Frequency
The incidence of exacerbations over 1 and 3 years was significantly higher in patients with a P-wave axis >75° than in those with a P-wave axis ≤75° (30.43% vs. 7.84% over 1 year; Fig. 1a, 52.17% vs. 17.64% over 3 years; Fig. 1b). In addition, the rates of patients who experienced exacerbations in 1 out of 3 years, and 2 out of 3 years were higher in patients with a P-wave axis >75° than in patients with a P-wave axis ≤75° (1 out of 3 years: 34.78% vs. 11.76%, p = 0.012; 2 out of 3 years: 17.39% vs. 4.9%, p = 0.038).
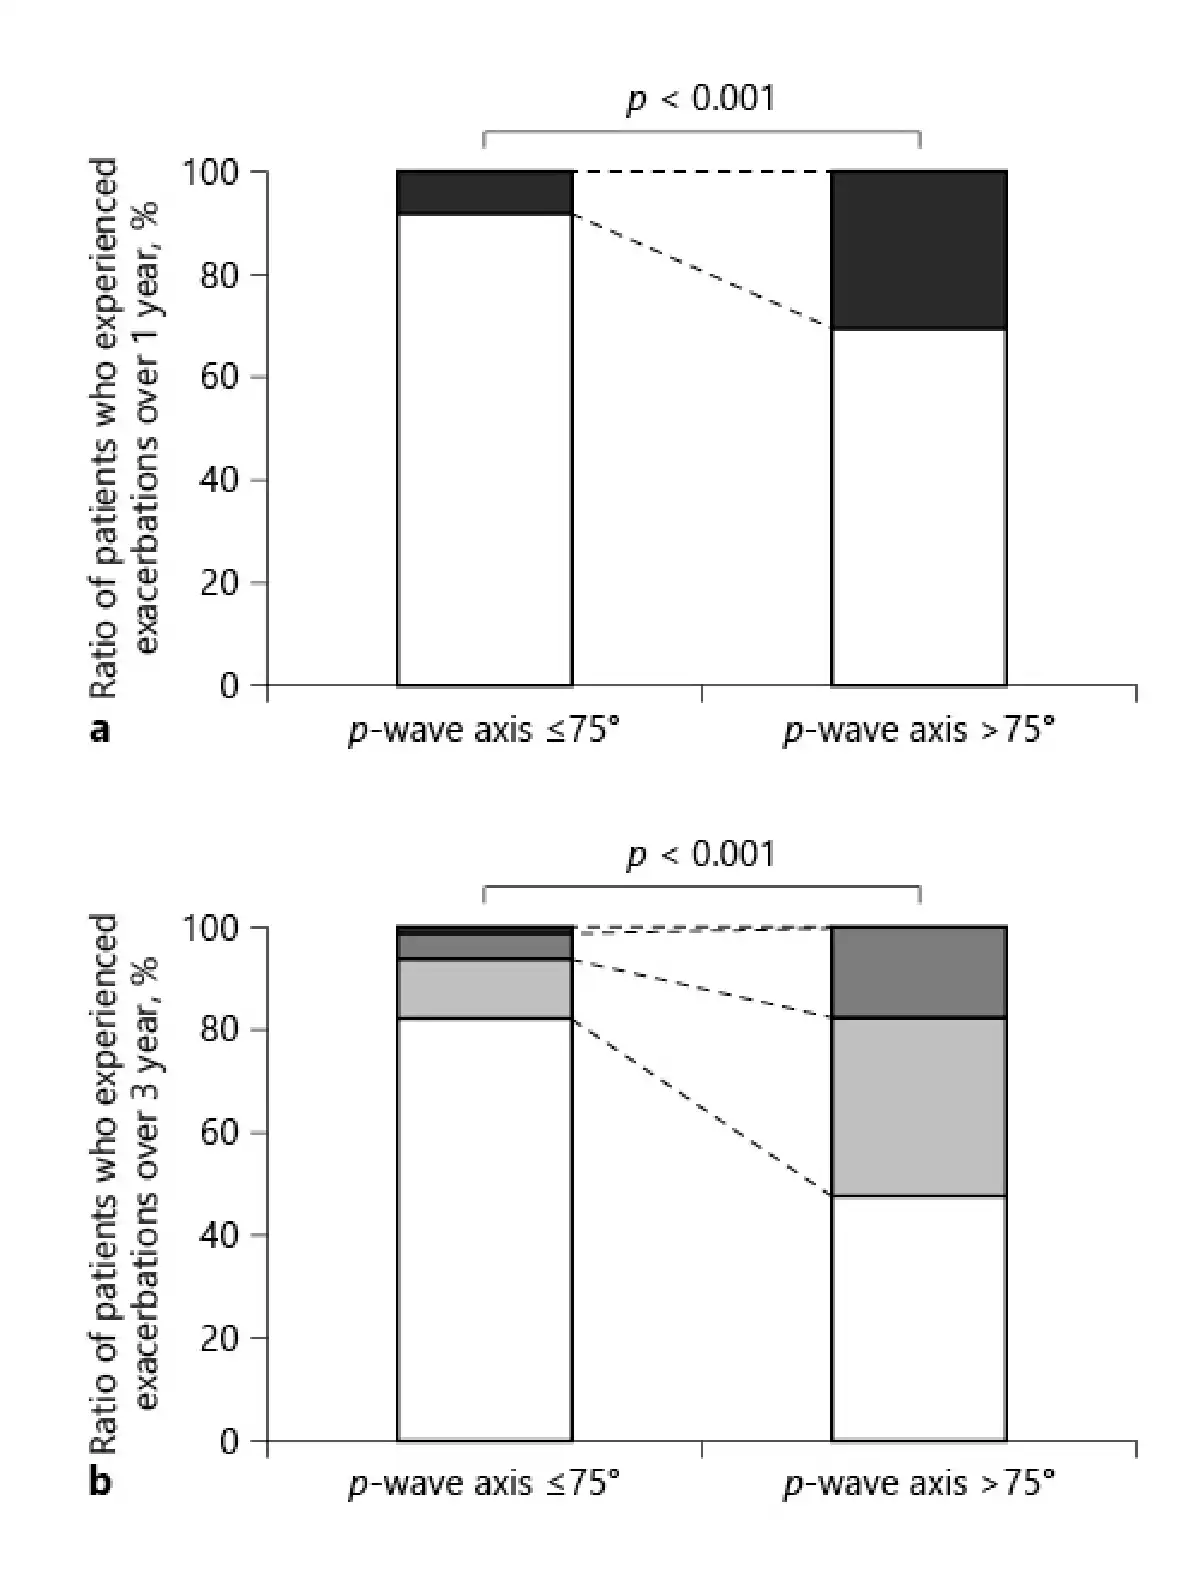
Fig. 1
Comparison of the exacerbation frequency between patients with a P-wave axis ≤75° and a P-wave axis >75°. a Comparison of the ratio of patients who experienced exacerbations between patients with a P-wave axis ≤75° and a P-wave axis >75° over 1 year. White: ratio of patients who experienced no exacerbation over 1 year; black: ratio of patients who experienced exacerbations over 1 year. b Comparison of the ratio of patients who experienced exacerbations between patients with a P-wave axis ≤75° and a P-wave axis >75° over 3 years. White: ratio of patients who experienced no exacerbation over 3 years; light gray: ratio of patients who experienced exacerbations in 1 out of 3 years; dark gray: ratio of patients who experienced exacerbations in 2 out of 3 years; black: ratio of patients who experienced exacerbations in each of the 3 years. One out of 3 years: 11.76% versus 34.78%, p = 0.012; 2 out of 3 years: 4.9% versus 17.39%, p = 0.038; every year: 0.98% versus 0%, p = 1.00.
Comparison of Chest CT and Echocardiography Findings
The LAA% was significantly higher in patients with a P-wave axis >75° than in those with a P-wave axis ≤75° (23.44% [14.26–31.21%] vs. 9.43% [4.77–16.61%], p = 0.001) (Fig. 2a). In contrast, the WA% did not differ between the 2 groups (Fig. 2b). There were no differences in left ventricular ejection fraction, estimated systolic pulmonary artery pressure, and IVC diameter between the 2 groups (online suppl. Fig. 2). Comparison of the P-wave axis and the QRS axis as predictors of airflow obstruction and exacerbation in patients with COPD
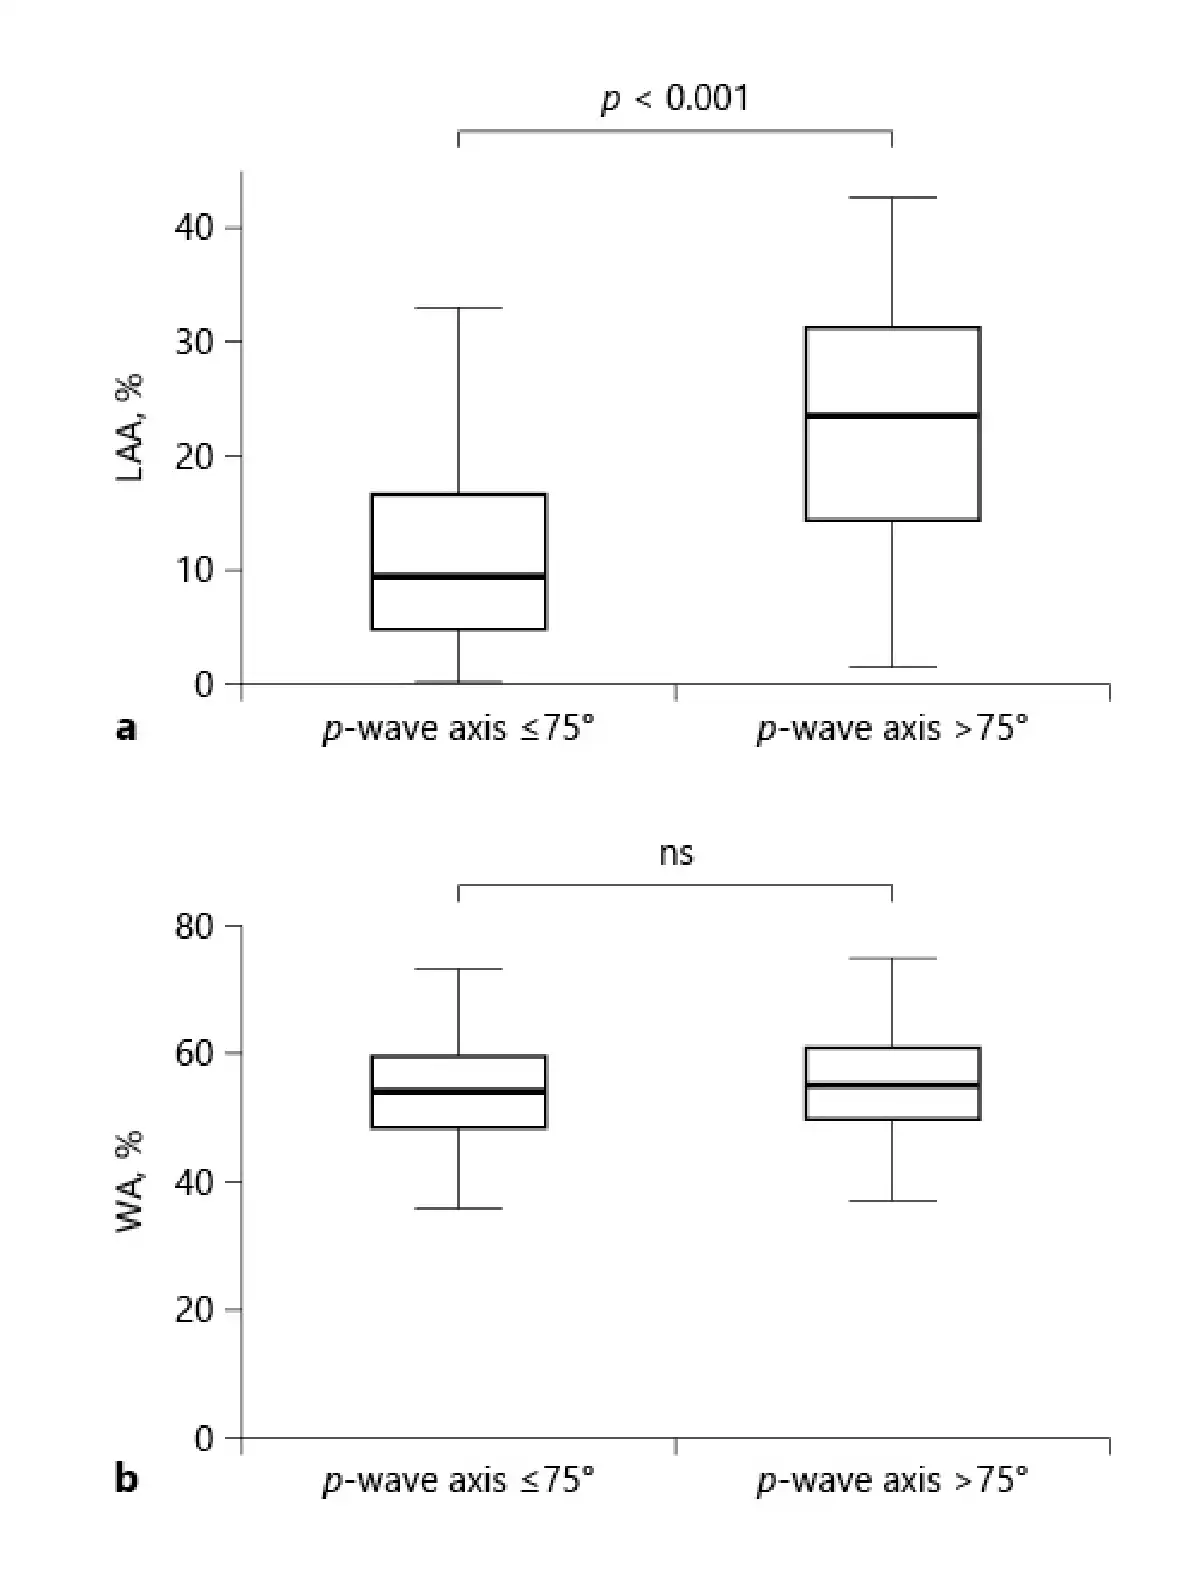
Fig. 2
Comparison of chest CT findings between patients with a P-wave axis ≤75° and a P-wave axis >75°. a Comparison of LAA% between patients with a P-wave axis ≤75° and a P-wave axis >75°. b Comparison of the WA% between patients with a P-wave axis ≤75° and a P-wave axis >75°. CT, computed tomography; LAA%, ratio of low attenuation area; WA%, ratio of airway wall area.
The ROC curves of the P-wave axis and the QRS axis as predictors of moderate-to-severe airway obstruction (%FEV1 <50%) and exacerbations over 3 years are shown in Figure 3. The AUC for the P-wave axis and the QRS axis, predicting moderate-to-severe airway obstruction, were 0.788 and 0.648, respectively. The AUC for the P-wave axis and the QRS axis, predicting exacerbations over 3 years, were 0.642 and 0.525, respectively. The optimal cutoff value on the P-wave axis for moderate-to-severe airway obstruction and future exacerbations over 3 years in COPD patients was 70° (AUC, 0.788; sensitivity, 65.3%; specificity, 78.3%) and 79° (AUC, 0.642; sensitivity, 36.7%; specificity, 92.6%), respectively.
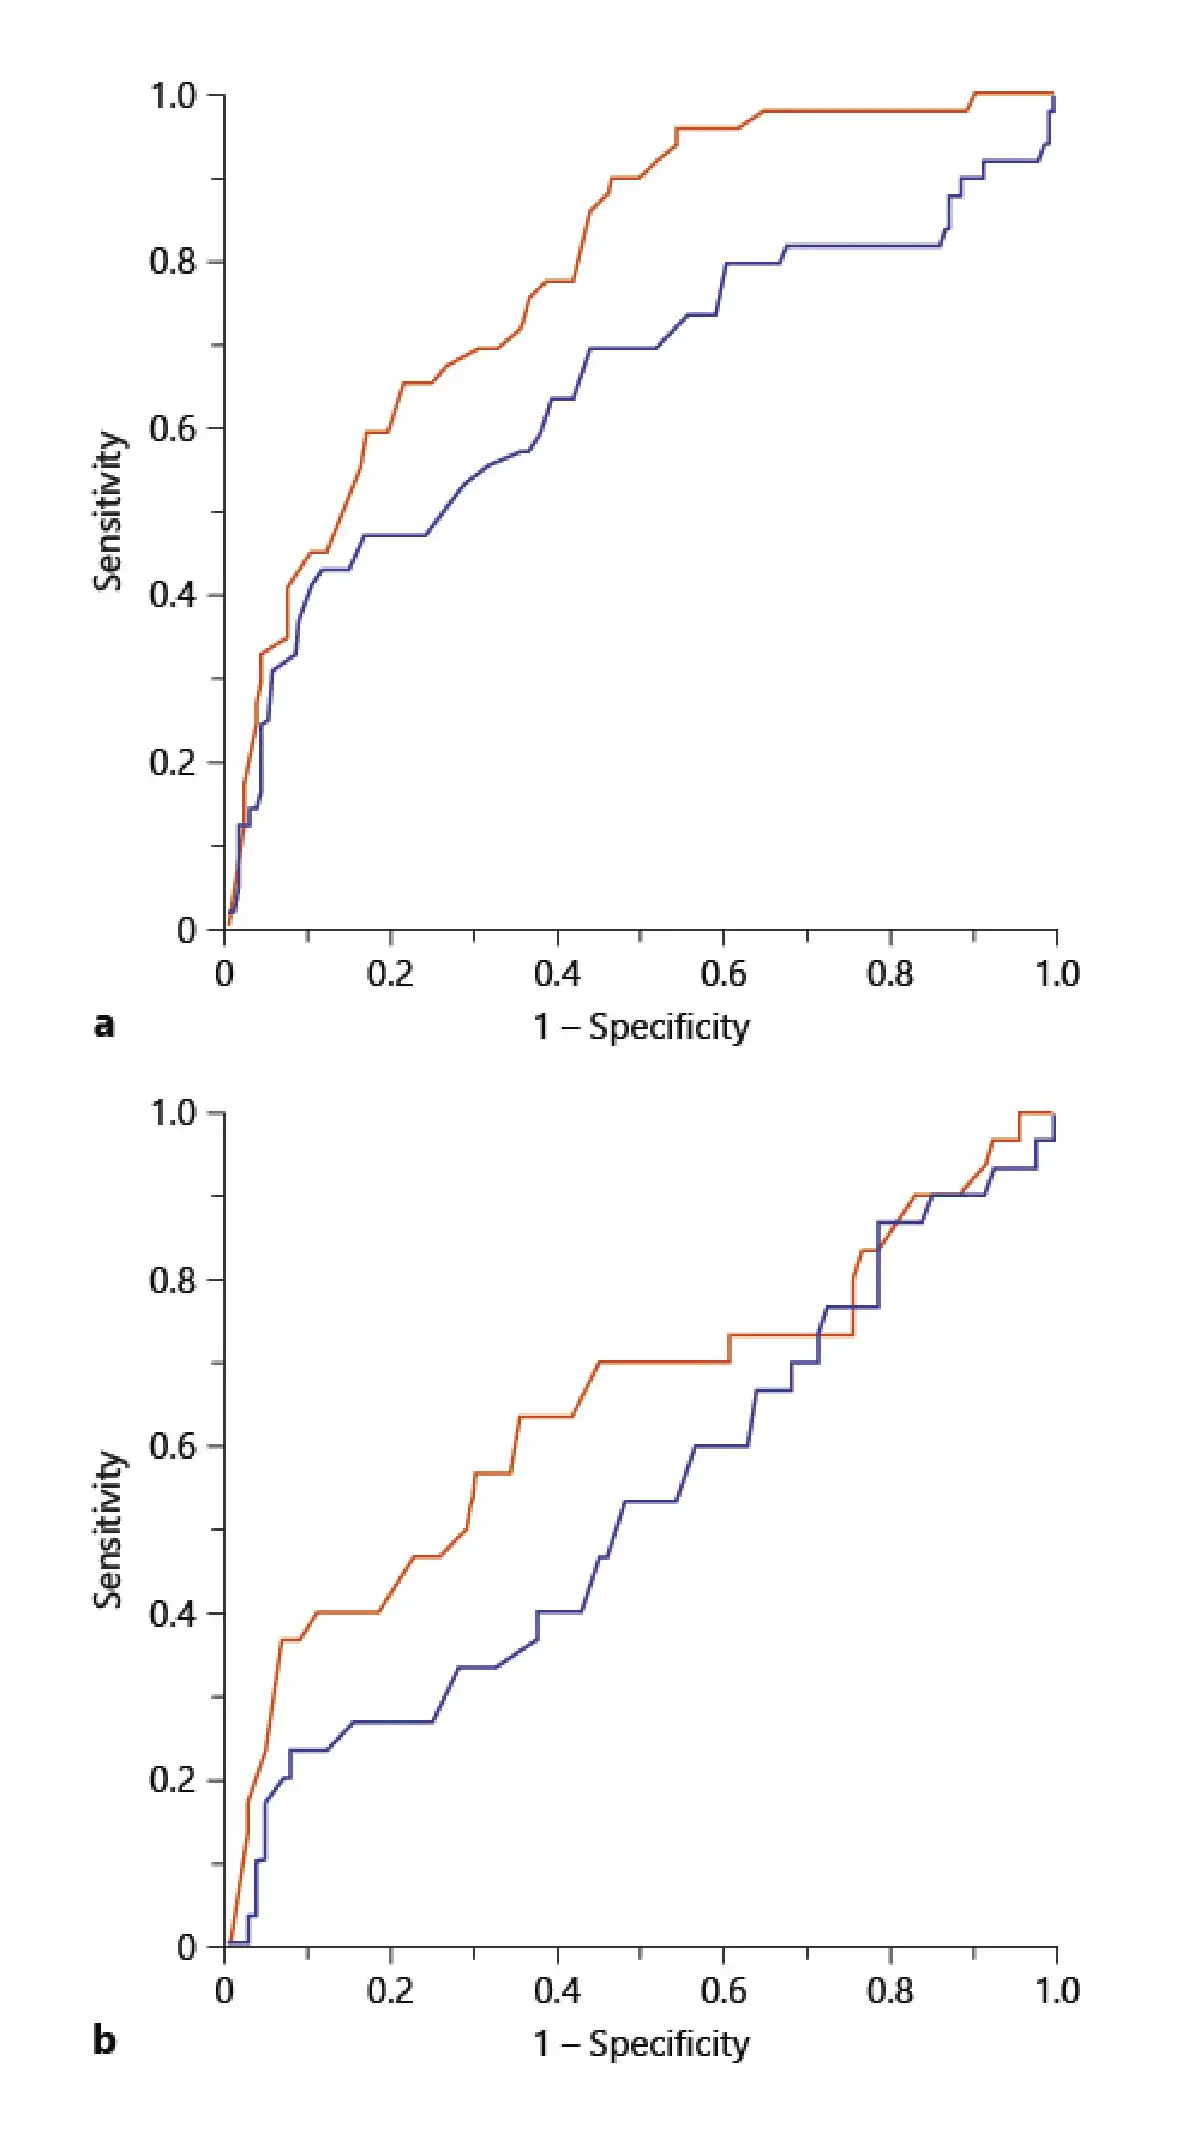
Fig. 3
Comparison of the P-wave axis and the QRS axis as predictors of airflow obstruction and exacerbation. a ROC curves of the P-wave axis (red line) and the QRS axis (blue line) in predicting moderate-to-severe airway obstruction (%FEV1 <50%). P-wave axis: AUC 0.788, cutoff 70°; QRS axis: AUC 0.648, cutoff 74°. b ROC curves of the P-wave axis (red line) and the QRS axis (blue line) in predicting moderate-to-severe exacerbations over 3 years. P-wave axis: AUC 0.642, cutoff 79°; QRS axis: AUC 0.525, cutoff 79°. ROC, receiver operating characteristic; %FEV1, ratio of predicted FEV1; AUC, areas under the curve.
Discussion
To the best of our knowledge, this is the first longitudinal study that compared the clinical characteristics of patients with COPD with the vertical P-wave axis. Our study provides 2 novel observations. First, patients with COPD with a vertical P-wave axis exhibited a worse health status and more frequent exacerbations than those without a vertical P-axis. Second, the P-axis predicted the severity of COPD and the frequency of exacerbations more precisely than the QRS axis. These findings might be clinically relevant because ECG is a noninvasive test, and the P-wave axis measurement is a convenient procedure. Recently, to reduce the spread of SARS-CoV-2, many pulmonary function testing laboratories have been closed or have significantly reduced their testing capacity []. Pulmonary function test is the golden standard for diagnosing COPD []. However, in our humble opinion, P-wave axis measurement has some clinical utility when lung function tests cannot be performed or when patients such as the elderly do not cooperate while performing the lung function test. Furthermore, P-wave axis measurement might be useful for predicting a worse health status than before and future exacerbation in COPD patients.
We first demonstrated that having a vertical P-wave axis was related to a poor health status and frequent exacerbations. The mechanisms underlying these relationships are unknown, but there may be several explanations. First, the predictive ability of the vertical axis for COPD severity may be the reason for predicting a poor health status and frequent exacerbations. It is well known that the severity of airflow obstruction and emphysema is related to the frequency of exacerbation [, ] and declining health status [, ]. On the other hand, previous reports, including ours, have implicated pulmonary hypertension as a risk factor for future exacerbations in patients with COPD [, ]. In this study, the P-wave axis was not associated with left heart failure, pulmonary hypertension, or congestive heart failure on echocardiography, but was associated with the severity of emphysema and COPD. Second, frequent exacerbations may directly cause the vertical P-wave axis. A previous report that compared the ECG findings before and after COPD exacerbations showed that the verticality of the P-wave axis occurs during exacerbations and improves with recovery []. Whether patients with recurrent exacerbations have accumulated abnormalities in the P-wave axis or whether abnormalities in the heart due to emphysema and hyperinflation of the lungs are responsible for the vertical P-wave axis may be the scope of future studies.
In this study, the P-wave axis was associated with the degree of emphysematous lesions but not the degree of airway wall thickness on chest CT. These results are consistent with previous studies []. In addition, there were no differences in the echocardiographic findings and the serum BNP levels between patients with and without a vertical P-wave axis. These results imply that the determining factor of the P-wave axis was the positional change of the heart caused by emphysematous lung hyperinflation, but not by the abnormality of cardiac function. A plausible mechanism for the P-wave axis verticalization in lung hyperinflation is that the right atrium is firmly attached to the diaphragm by a dense pericardial ligament around the IVC []. With progressive flattening of the diaphragm, the right atrium is distorted and displaced inferiorly, causing a significant rightward deviation (verticalization) of the P-wave axis []. This study showed that patients with COPD with a vertical P-wave axis exhibited severe airway obstruction, lung hyperinflation, and diffusion impairment in the pulmonary function test, consistent with this conjecture.
This study showed that both P-wave axis and QRS axis were useful in predicting the degree of airflow obstruction and future exacerbations in patients with COPD. These results are consistent with previous reports, showing an association between the QRS axis and the degree of airway obstruction []. In addition, our study further suggests that the P-wave axis predicts the degree of airflow obstruction and future exacerbations more precisely than the QRS axis. The superiority of the P-wave axis may be explained since the P-wave axis reflects the right atrium displacement by lung hyperinflation more directly than the QRS axis. In this study, BMI was significantly lower in patients with P-wave axis >75° than in those with P-wave axis ≤75°. These results are consistent with that of a previous report that showed the association between BMI and P-wave axis []. Moreover, QRS axis is age-dependent []. Consequently, it is important to know that BMI and age may act as confounding factors during the interpretation of the P-wave and QRS axis. Several cardiac disorders, such as left and right ventricular hypertrophy, and myocardial infarction, cause QRS axis abnormality []. The QRS axis may be influenced by cardiac comorbidities in patients with COPD. In contrast, the QRS axis may be a useful biomarker for predicting COPD severity and exacerbations in patients without discrimination of p waves, such as in those with atrial fibrillation.
Our study had several limitations. First, we could not evaluate the anatomical axis using cardiac tomography or magnetic resonance imaging. Thus, future studies are warranted to determine whether the electrical rotation is parallel to the rotation of the anatomical heart axis using cardiac imaging. Second, the average age of patients who participated in our study was higher than that of other clinical COPD studies conducted in Western countries in the past []. The QRS axis is age-dependent []. Further studies with larger sample sizes and an appropriate number of younger patients are needed.
Conclusion
Patients with COPD with a vertical P-wave axis exhibited severe airflow limitation and emphysema, poor health status, and frequent exacerbation. Furthermore, the P-wave axis predicts the severity of airflow limitation and future exacerbation more precisely than the QRS axis. Detection of the vertical P-wave axis by ECG can help in the clinical management of patients with COPD.
Acknowledgments
The authors would like to acknowledge Tomoko Betsuyaku and Chiyomi Uemura for their contributions to the data collection and analysis. The authors acknowledge all the members of the K-CCR group who participated in this study, including the Saiseikai Utsunomiya Hospital, Eiju General Hospital, Tokyo Saiseikai Central Hospital, Sano Public Welfare General Hospital, Nihon Kokan Hospital, Saitama Social Insurance Hospital, Kawasaki City Ida Hospital, Saitama City Hospital, Tokyo Medical Center, Tokyo Dental College Ichikawa General Hospital, Tokyo Electric Power Company Hospital, and International Medical Welfare College Shioya Hospital.
Statement of Ethics
The protocol was approved by the Ethics Committees of Keio University and its affiliated hospitals. Written informed consent was obtained from all patients. All aspects of the study conformed to the principles of the Declaration of Helsinki.
Conflict of Interest Statement
The authors have no conflicts of interest to declare.
Funding Sources
This work was not funded.
Author Contributions
S.C., Y.I., Y.Y., M.J., M.M., H.N., K.A, and K.F. were responsible for the conception or design of the work; S.C., S.N., K.S., H.I., and M.H. were responsible for the acquisition of the data; S.O., S.C., and H.I. analyzed and interpreted the data; S.O., S.C., S.N., K.S., H.I., M.H., Y.I., Y.Y., M.J., M.M., H.N., K.A., and K.F. drafted or revised the manuscript for important intellectual content and provided a final approval of the data; S.O. and S.C. are accountable for all aspects of the work.
Data Availability Statement
The data that support the findings of this study are not publicly available due to their containing information that could compromise the privacy of research participants but are available from the corresponding author Shotaro Chubachi upon reasonable request.
References
- 1. Vogelmeier CF, Criner GJ, Martinez FJ, Anzueto A, Barnes PJ, Bourbeau J, et al. Global strategy for the diagnosis, management, and prevention of chronic obstructive lung disease 2017 report. GOLD executive summary. Am J Respir Crit Care Med. 2017 Mar 1;195(5):557–82. http://dx.doi.org/10.1164/rccm.201701-0218PP
- 2. Sakai N, Mishima M, Nishimura K, Itoh H, Kuno K. An automated method to assess the distribution of low attenuation areas on chest CT scans in chronic pulmonary emphysema patients. Chest. 1994 Nov;106(5):1319–25. http://dx.doi.org/10.1378/chest.106.5.1319
- 3. Hasegawa M, Nasuhara Y, Onodera Y, Makita H, Nagai K, Fuke S, et al. Airflow limitation and airway dimensions in chronic obstructive pulmonary disease. Am J Respir Crit Care Med. 2006 Jun 15;173(12):1309–15. http://dx.doi.org/10.1164/rccm.200601-037OC
- 4. Sato M, Chubachi S, Sasaki M, Haraguchi M, Kameyama N, Tsutsumi A, et al. Impact of mild exacerbation on COPD symptoms in a Japanese cohort. Int J Chron Obstruct Pulmon Dis. 2016;11:1269–78. http://dx.doi.org/10.2147/COPD.S105454
- 5. Soler-Cataluna JJ, Martinez-Garcia MA, Roman Sanchez P, Salcedo E, Navarro M, Ochando R. Severe acute exacerbations and mortality in patients with chronic obstructive pulmonary disease. Thorax. 2005 Nov;60(11):925–31.
- 6. Lomas DA, Silverman EK, Edwards LD, Miller BE, Coxson HO, Tal-Singer R, et al. Evaluation of serum CC-16 as a biomarker for COPD in the ECLIPSE cohort. Thorax. 2008 Dec;63(12):1058–63. http://dx.doi.org/10.1136/thx.2008.102574
- 7. Mochimaru T, Chubachi S, Irie H, Sakurai K, Okuzumi S, Sunata K, et al. Blood eosinophil and neutrophil counts differentially identify frequent exacerbation in patients with COPD with physician-diagnosed asthma and COPD. Allergol Int. 2021 Apr;70(2):255–57.
- 8. Sakurai K, Chubachi S, Irie H, Tsutsumi A, Kameyama N, Kamatani T, et al. Clinical utility of blood neutrophil-lymphocyte ratio in Japanese COPD patients. BMC Pulm Med. 2018 May 2;18(1):65. http://dx.doi.org/10.1186/s12890-018-0639-z
- 9. Goudis CA, Konstantinidis AK, Ntalas IV, Korantzopoulos P. Electrocardiographic abnormalities and cardiac arrhythmias in chronic obstructive pulmonary disease. Int J Cardiol. 2015 Nov 15;199:264–73. http://dx.doi.org/10.1016/j.ijcard.2015.06.096
- 10. Rodman DM, Lowenstein SR, Rodman T. The electrocardiogram in chronic obstructive pulmonary disease. J Emerg Med. 1990 Sep-Oct;8(5):607–15. http://dx.doi.org/10.1016/0736-4679(90)90458-8
- 11. Maheshwari A, Norby FL, Soliman EZ, Koene RJ, Rooney MR, O’Neal WT, et al. Abnormal P-wave axis and ischemic stroke: the ARIC study (atherosclerosis risk in communities). Stroke. 2017 Aug;48(8):2060–5. http://dx.doi.org/10.1161/STROKEAHA.117.017226.
- 12. Stephen JM, Dhindsa H, Browne B, Barish R. Interpretation and clinical significance of the QRS axis of the electrocardiogram. J Emerg Med. 1990 Nov-Dec;8(6):757–63. http://dx.doi.org/10.1016/0736-4679(90)90290-c
- 13. Alter P, Watz H, Kahnert K, Rabe KF, Biertz F, Fischer R, et al. Effects of airway obstruction and hyperinflation on electrocardiographic axes in COPD. Respir Res. 2019 Mar 27;20:61. http://dx.doi.org/10.1186/s12931-019-1025-y.
- 14. Baljepally R, Spodick DH. Electrocardiographic screening for emphysema: the frontal plane P axis. Clin Cardiol. 1999 Mar;22(3):226–8. http://dx.doi.org/10.1002/clc.4960220313
- 15. Thomas AJ, Apiyasawat S, Spodick DH. Electrocardiographic detection of emphysema. Am J Cardiol. 2011 Apr 1;107(7):1090–2. http://dx.doi.org/10.1016/j.amjcard.2010.11.039
- 16. Chubachi S, Nakamura H, Sasaki M, Haraguchi M, Miyazaki M, Takahashi S, et al. Polymorphism of LRP5 gene and emphysema severity are associated with osteoporosis in Japanese patients with or at risk for COPD. Respirology. 2015 Feb;20(2):286–95. http://dx.doi.org/10.1111/resp.12429
- 17. Miyazaki M, Nakamura H, Chubachi S, Sasaki M, Haraguchi M, Yoshida S, et al. Analysis of comorbid factors that increase the COPD assessment test scores. Respir Res. 2014 Feb 6;15:13. http://dx.doi.org/10.1186/1465-9921-15-13
- 18. Irie H, Chubachi S, Sato M, Tsutsumi A, Nakachi I, Miyao N, et al. Characteristics of patients with increasing COPD assessment test scores within 3 years. Respir Med. 2017 Oct;131:101–8. http://dx.doi.org/10.1016/j.rmed.2017.08.012.
- 19. Nakayama S, Chubachi S, Sakurai K, Irie H, Tsutsumi A, Hashiguchi M, et al. Characteristics of chronic obstructive pulmonary disease patients with pulmonary hypertension assessed by echocardiography in a three-year observational cohort study. Int J Chron Obstruct Pulmon Dis. 2020;15:487–99. http://dx.doi.org/10.2147/COPD.S230952
- 20. Jones PW, Harding G, Berry P, Wiklund I, Chen WH, Kline Leidy N. Development and first validation of the COPD assessment test. Eur Respir J. 2009 Sep;34(3):648–54. http://dx.doi.org/10.1183/09031936.00102509
- 21. Kwon N, Amin M, Hui DS, Jung KS, Lim SY, Ta HD, et al. Validity of the COPD assessment test translated into local languages for Asian patients. Chest. 2013 Mar;143(3):703–10. http://dx.doi.org/10.1378/chest.12-0535
- 22. Hajiro T, Nishimura K, Tsukino M, Ikeda A, Koyama H, Izumi T. Analysis of clinical methods used to evaluate dyspnea in patients with chronic obstructive pulmonary disease. Am J Respir Crit Care Med. 1998 Oct;158(4):1185–9. http://dx.doi.org/10.1164/ajrccm.158.4.9802091
- 23. Hajiro T, Nishimura K, Tsukino M, Ikeda A, Koyama H, Izumi T. Comparison of discriminative properties among disease-specific questionnaires for measuring health-related quality of life in patients with chronic obstructive pulmonary disease. Am J Respir Crit Care Med. 1998 Mar;157(3 Pt 1):785–90. http://dx.doi.org/10.1164/ajrccm.157.3.9703055
- 24. Jones PW, Quirk FH, Baveystock CM, Littlejohns P. A self-complete measure of health status for chronic airflow limitation. The St. george’s respiratory questionnaire. Am Rev Respir Dis. 1992 Jun;145(6):1321–7. http://dx.doi.org/10.1164/ajrccm/145.6.1321
- 25. Chhabra L, Sareen P, Perli D, Srinivasan I, Spodick DH. Vertical P-wave axis: the electrocardiographic synonym for pulmonary emphysema and its severity. Indian Heart J. 2012 Jan–Feb;64(1):40–2. http://dx.doi.org/10.1016/S0019-4832(12)60009-1
- 26. Wagner G, Lim TH. Interpretation of the normal electrocardiogram. In: Wagner G, Strauss D, editors. Marriott’s Practical Electrocardiography. Philadelphia, Pennsylvania: Lippincott Williams&Wilkins;; 2008. p. 44–65.
- 27. Kon SS, Canavan JL, Jones SE, Nolan CM, Clark AL, Dickson MJ, et al. Minimum clinically important difference for the COPD assessment test: a prospective analysis. Lancet Respir Med. 2014 Mar;2(3):195–203. http://dx.doi.org/10.1016/S2213-2600(14)70001-3
- 28. Jones PW, Quirk FH, Baveystock CM. The St george’s respiratory questionnaire. Respir Med. 1991 Sep;85 Suppl B:25–31; discussion 33–7. http://dx.doi.org/10.1016/s0954-6111(06)80166-6.
- 29. Kouri A, Gupta S, Yadollahi A, Ryan CM, Gershon AS, To T, et al. Addressing reduced laboratory-based pulmonary function testing during a pandemic. Chest. 2020 Dec;158(6):2502–10. http://dx.doi.org/10.1016/j.chest.2020.06.065
- 30. Mirza S, Clay RD, Koslow MA, Scanlon PD. COPD guidelines: a review of the 2018 GOLD report. Mayo Clin Proc. 2018 Oct;93(10):1488–502. http://dx.doi.org/10.1016/j.mayocp.2018.05.026
- 31. Donaldson GC, Wedzicha JA. COPD exacerbations.1: epidemiology. Thorax. 2006 Feb;61(2):164–8.
- 32. Han MK, Kazerooni EA, Lynch DA, Liu LX, Murray S, Curtis JL, et al. Chronic obstructive pulmonary disease exacerbations in the COPDGene study: associated radiologic phenotypes. Radiology. 2011 Oct;261(1):274–82. http://dx.doi.org/10.1148/radiol.11110173
- 33. Jones PW. Health status measurement in chronic obstructive pulmonary disease. Thorax. 2001 Nov;56(11):880–7. http://dx.doi.org/10.1136/thorax.56.11.880
- 34. Han MK, Bartholmai B, Liu LX, Murray S, Curtis JL, Sciurba FC, et al. Clinical significance of radiologic characterizations in COPD. COPD. 2009 Dec;6(6):459–67. http://dx.doi.org/10.3109/15412550903341513
- 35. Kessler R, Faller M, Fourgaut G, Mennecier B, Weitzenblum E. Predictive factors of hospitalization for acute exacerbation in a series of 64 patients with chronic obstructive pulmonary disease. Am J Respir Crit Care Med. 1999 Jan;159(1):158–64. http://dx.doi.org/10.1164/ajrccm.159.1.9803117
- 36. Asad N, Johnson VM, Spodick DH. Acute right atrial strain: regression in normal as well as abnormal P-wave amplitudes with treatment of obstructive pulmonary disease. Chest. 2003 Aug;124(2):560–4. http://dx.doi.org/10.1378/chest.124.2.560
- 37. Chhabra L, Sareen P, Gandagule A, Spodick D. Computerized tomographic quantification of chronic obstructive pulmonary disease as the principal determinant of frontal P vector. Am J Cardiol. 2012 Apr 1;109(7):1046–9. http://dx.doi.org/10.1016/j.amjcard.2011.11.036
- 38. Shah NS, Koller SM, Janower ML, Spodick DH. Diaphragm levels as determinants of P axis in restrictive vs obstructive pulmonary disease. Chest. 1995 Mar;107(3):697–700. http://dx.doi.org/10.1378/chest.107.3.697
- 39. Rangel MO, O’Neal WT, Soliman EZ. Usefulness of the electrocardiographic P-Wave axis as a predictor of atrial fibrillation. Am J Cardiol. 2016 Jan 1;117(1):100–4. http://dx.doi.org/10.1016/j.amjcard.2015.10.013