Introduction
Risk assessment is essential for the management of patients with pulmonary arterial hypertension (PAH). Risk stratification scores provide prediction of mortality risk and allow clinicians to determine patient’s prognosis and treatment approach, and optimize lung transplantation timing. The 3 most commonly used scores are the following: the Registry to Evaluate Early and Long-Term PAH Disease Management (REVEAL) risk score [], the score developed by the Swedish/Comparative Prospective Registry of Newly Initiated Therapies for Pulmonary Hypertension (PH) (COMPERA) [], and the score developed by the French PH Network Registry (FPHR).
The original REVEAL score is derived from a cohort of 2,716 patients from 54 centers in the USA []. It includes 12 modifiable (e.g. hemodynamic parameters) and nonmodifiable variables (e.g. age). In order to enhance risk prediction, one variable was recently added and another one was revised in the updated REVEAL score version 2.0 [] (online suppl. Table 1S; for all online suppl. material, see http://www.karger.com/doi/10.1159/000520886). The new variable is the all-cause hospitalization within the last 6 months of diagnosis. The revised one is the kidney function variable (eGFR) with an explicit threshold (<60 mL/min/1.73 m2) or designated as “renal insufficiency” when the eGFR is unavailable. Calculating REVEAL categorizes patients into low-risk (≤6), with 12-month mortality risk of ≤2.6%; intermediate (7 or 8), with 12-month mortality risk of 6.2 and 7.0%, respectively; or high-risk score group (≥9), with 12-month mortality risk of ≥10.7%.
Boucly et al. [] elaborated a simpler risk assessment tool derived from the 2015 ERS/ECS guidelines risk table [] using data from the French registry. The FPHR includes 4 low-risk criteria: World Health Organization (WHO)/New York Heart Association (NYHA) Functional Class (FC) I or II, 6-min walk distance (6MWD) >440 m, right atrial pressure <8 mm Hg, and cardiac index ≥2.5 L min−1 m−2 (online suppl. Table 1S). Patients have a <5%, 5–10%, or >10% 1-year mortality risk if they have 3 or 4 low-risk criteria, 1 or 2 low-risk criteria, or no low-risk criteria, respectively [].
On top of the 4 criteria used for the FPHR, 2 additional variables are included in the COMPERA score: brain natriuretic peptide (BNP) <50 ng L−1 or N-terminal pro-BNP <300 ng L−1 plasma levels and mixed venous oxygen saturation >65% (online suppl. Table 1S). According to specific thresholds defined for each variable by 2015 ESC/ERS guidelines [], the available variables are mapped to low (=1), intermediate (=2), or high (=3) risk grade. To calculate the score, the mean of the risk grades is summed up and divided by the number of available variables. The result is rounded to the next integer to define the risk group from 1 to 3 (1 = low, 2 = intermediate, and 3 = high). These risk assessment tools and their predictivity have been well described in the literature [, , ].
The main objective of our study was to assess and compare the predictive value of the 3 PAH scores at 3 and 5 years after diagnosis in a cohort of 50 patients from a single center. Another aim was to analyze whether the initial risk stratification was altered after 1 year of treatment.
Material and Methods
Study Participants
This retrospective observational monocentric study was conducted at the PH center of Lausanne University Hospital (CHUV, Switzerland). We identified 52 patients diagnosed with PAH Group 1 [] confirmed by a right heart catheterization between January 1, 1996 and May 31, 2020. According to the Fifth World Symposium on PH, PAH was defined as a mean pulmonary arterial pressure (mPAP) >25 mm Hg at rest with pulmonary capillary wedge pressure <15 mm Hg and no significant airflow limitation, lung restriction, or signs of chronic thromboembolic disease on imaging [, ]. If pulmonary capillary wedge pressure was unavailable, patients were included only if the mPAP was >25 mm Hg at rest and the left ventricular end-diastolic pressure <15 mm Hg. Additional inclusion criteria were as follows: age over 16 years at diagnosis and follow-up by consecutive visits in our institution for at least 1 year from diagnosis. Patients were excluded if they had explicitly refused to sign the consent for retrospective studies.
Score Assessment
Patients included were divided into 2 groups. The first group consists of the transplant-free survivors (TFS, n = 37, 74%) and the second one of the deceased or transplanted (DoT, n = 13, 26%) until May 31, 2020. All patients started a specific medical treatment at diagnosis. We applied the 3 scores to each patient at baseline and at 1 year of treatment, and categorized them as low, intermediate, or high risk. Of note, we applied the FPHR score to all subgroups of PAH Group 1 patients, whereas the FPHR 2005 model was restricted to patients with idiopathic, heritable, or drug-induced PAH.
In case of missing variables, appropriate adjustments were made. No point was added or subtracted in REVEAL calculation in case of missing variable, except for the 6MWD which was set to 0 with one additional point scored. In case of absence of hemodynamic variables at 1 year, the values of baseline were used. The way COMPERA score is calculated allows its use even in case of missing parameters. For the FPHR, NYHA/FC was always available. If 6MWD, cardiac index, and right atrial pressure were missing, they were set to 0. This implied the addition of one low-risk criterion.
Statistics
For each risk score, median and interquartile range (IQR) were calculated at baseline and after 1 year of treatment. The probability distribution curves (PDC) were constructed for all scores for both groups (TFS and DoT). The Mann-Whitney rank-sum test was applied to verify if the PDC of the 2 groups for each score were significantly different.
Specific score thresholds were defined for each score to create 2 patients’ categories, the one with high- and intermediate-risk patients (H-I R) and the other with low-risk (LR) ones according to each score. Transplant-free survival (TFs) was evaluated by the Kaplan-Meier method. Survival curves were evaluated according to scores measured at baseline and at 1 year. Kaplan-Meier curves were compared using the log-rank test. The level of discrimination of the 3 PAH tools was determined by receiver operating characteristic (ROC) curves at 3 and 5 years from baseline. The ROC curves were constructed using the scores calculated at baseline and at 1 year, and the, respective, area under the curve (AUC) were compared using the Hanley and McNeil [] method. Finally, the Kruskal-Wallis test was used to compare the deltas of each score measured at baseline and at 1 year for TFS and DoT, respectively.
Results
Patient Characteristics
Two patients of the initial group of 52 were excluded for not fulfilling the aforementioned criteria. Patients included had a mean (±SD) age of 54.8 (18.1) years at diagnosis, and 68% were female (Table 1). The majority (54%) was diagnosed with idiopathic PAH Group 1.1, and 60% were classified as NYHA/WHO FC III at baseline. The mean PAP was 47.4 (13.7) mm Hg and the mean pulmonary vascular resistance was 9.6 (5.1) Wood units.
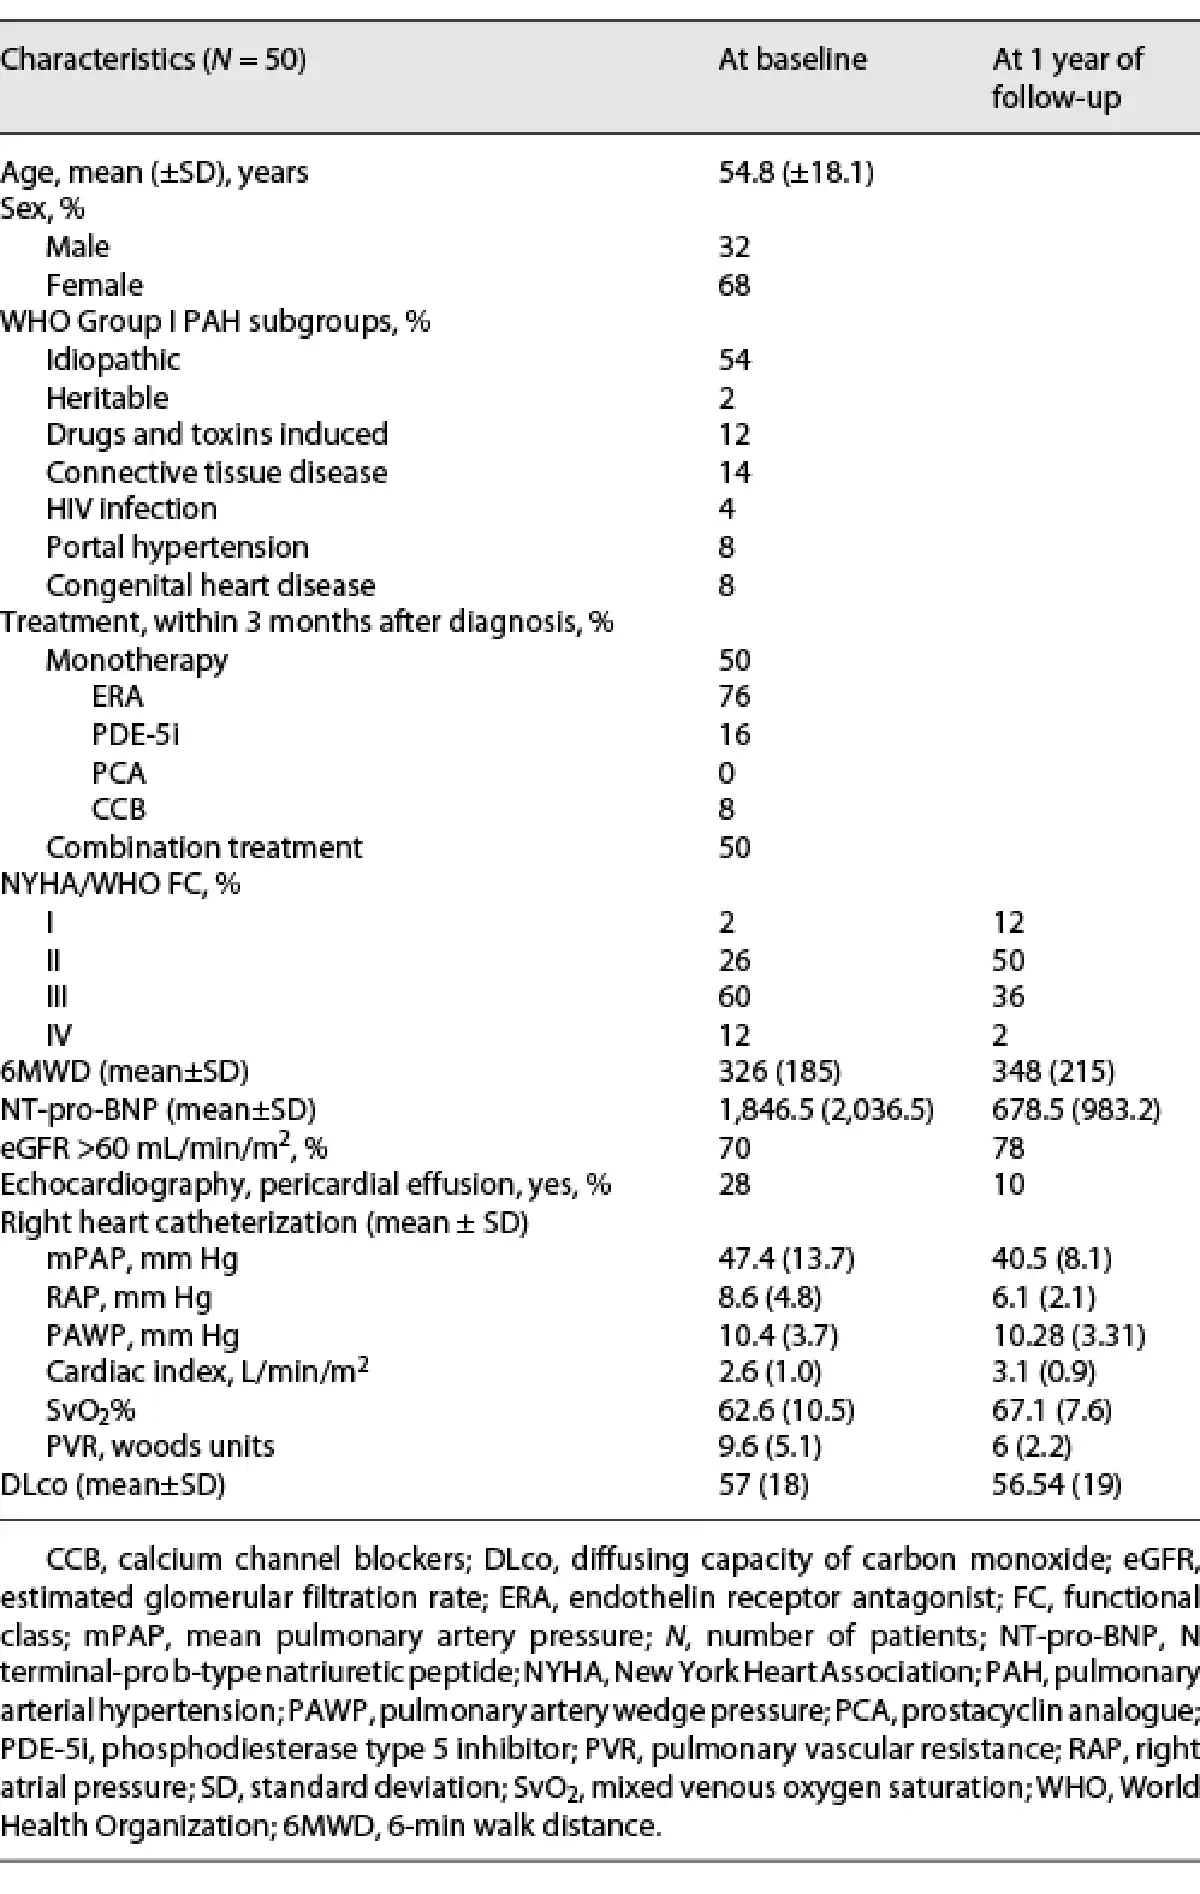
PAH-specific treatment within 3 months of diagnosis is outlined in Table 1. Half of the cohort received a monotherapy (76% endothelin receptor antagonist, 16% phosphodiesterase type 5 inhibitor, 0% prostacyclin analogue, and 8% calcium channel blockers) [-] and the other half an upfront combination treatment.
At 1 year of follow-up, NYHA/WHO FC improved in 23 patients; 38% were classified as NYHA class III/IV at 1 year comparing to 72% at baseline (Table 1). The mean BNP value and the percentage of patients with pericardial effusion had a relative improvement of 63% and 64%, respectively. There was a slight improvement of the available values of mPAP and PVR at 1 year.
Overall TFs was 88% and 82% at 3 and 5 years, respectively (Fig. 1). No death or transplantation occurred during the first year. At 3 years, 4 patients died and 2 were transplanted. At 5 years, these numbers increased to 6 and 3, respectively.
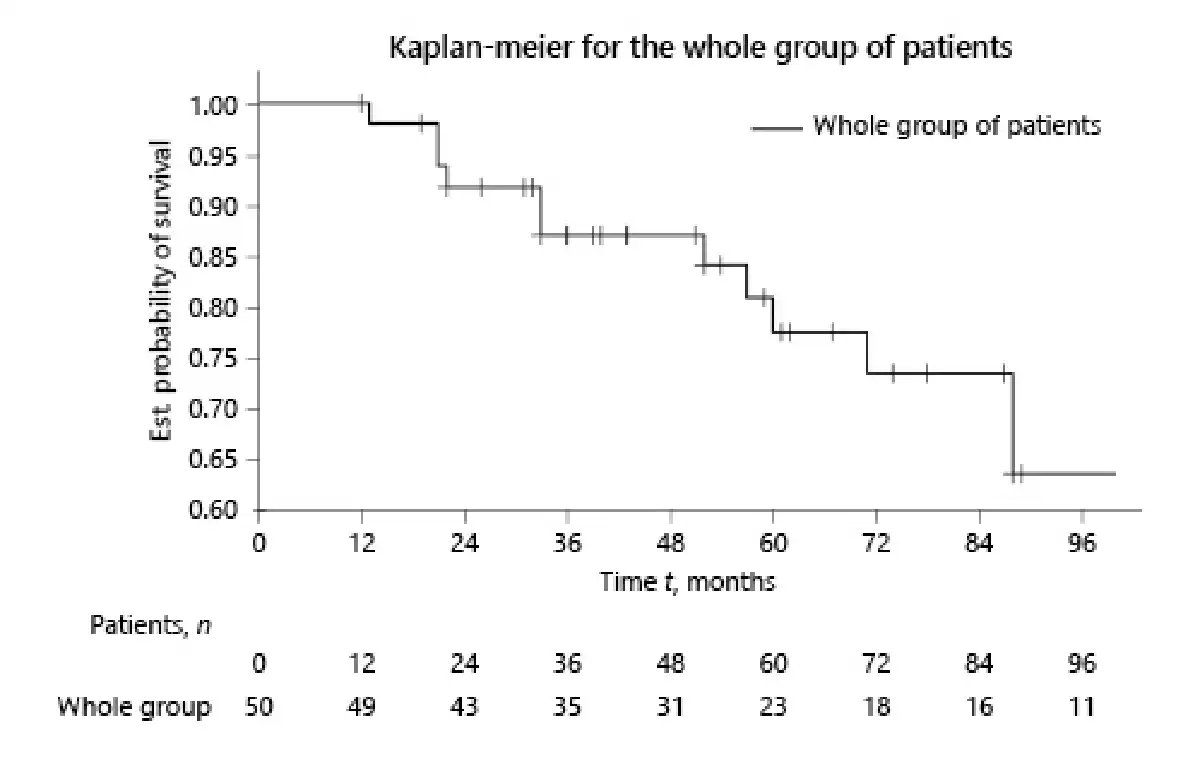
Fig. 1
Kaplan-Meier survival curve of the whole group of patients at baseline.
Risk Stratification at Baseline
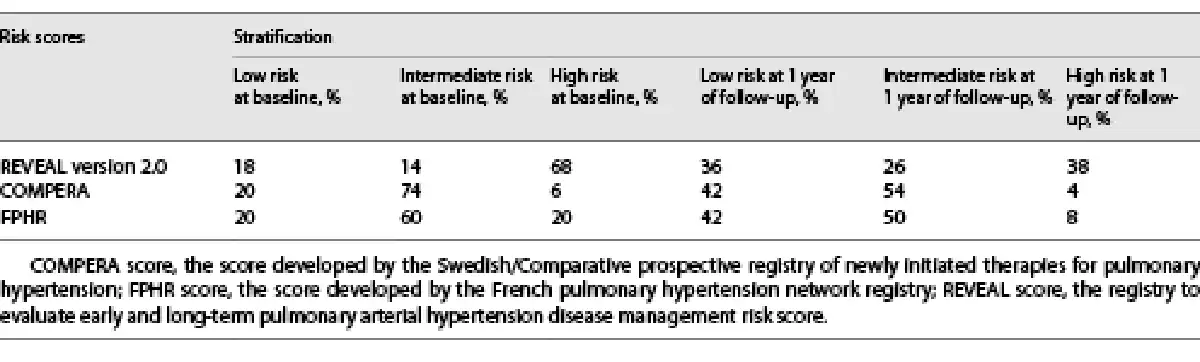
At baseline, all variables were available for 90%, 86%, and 92% of patients for REVEAL 2.0, COMPERA, and FPHR, respectively. Two-thirds of the cohort (68%) were categorized as high risk according to REVEAL 2.0. Most patients were classified as low or intermediate risk according to the COMPERA (94%) and FPHR (80%) (Table 2).
Interestingly, both TFS (median score [IQR]; 9.0 [3, 14]) and DoT (11.0 [8, 15]) were categorized as high risk according to REVEAL 2.0 with a significant difference between their PDC (p value 0.018). On the other hand, the COMPERA and FPHR categorized them as intermediate risk, and their PDC remained significantly different (p value 0.002 and 0.003, respectively, as shown in Fig. 2).
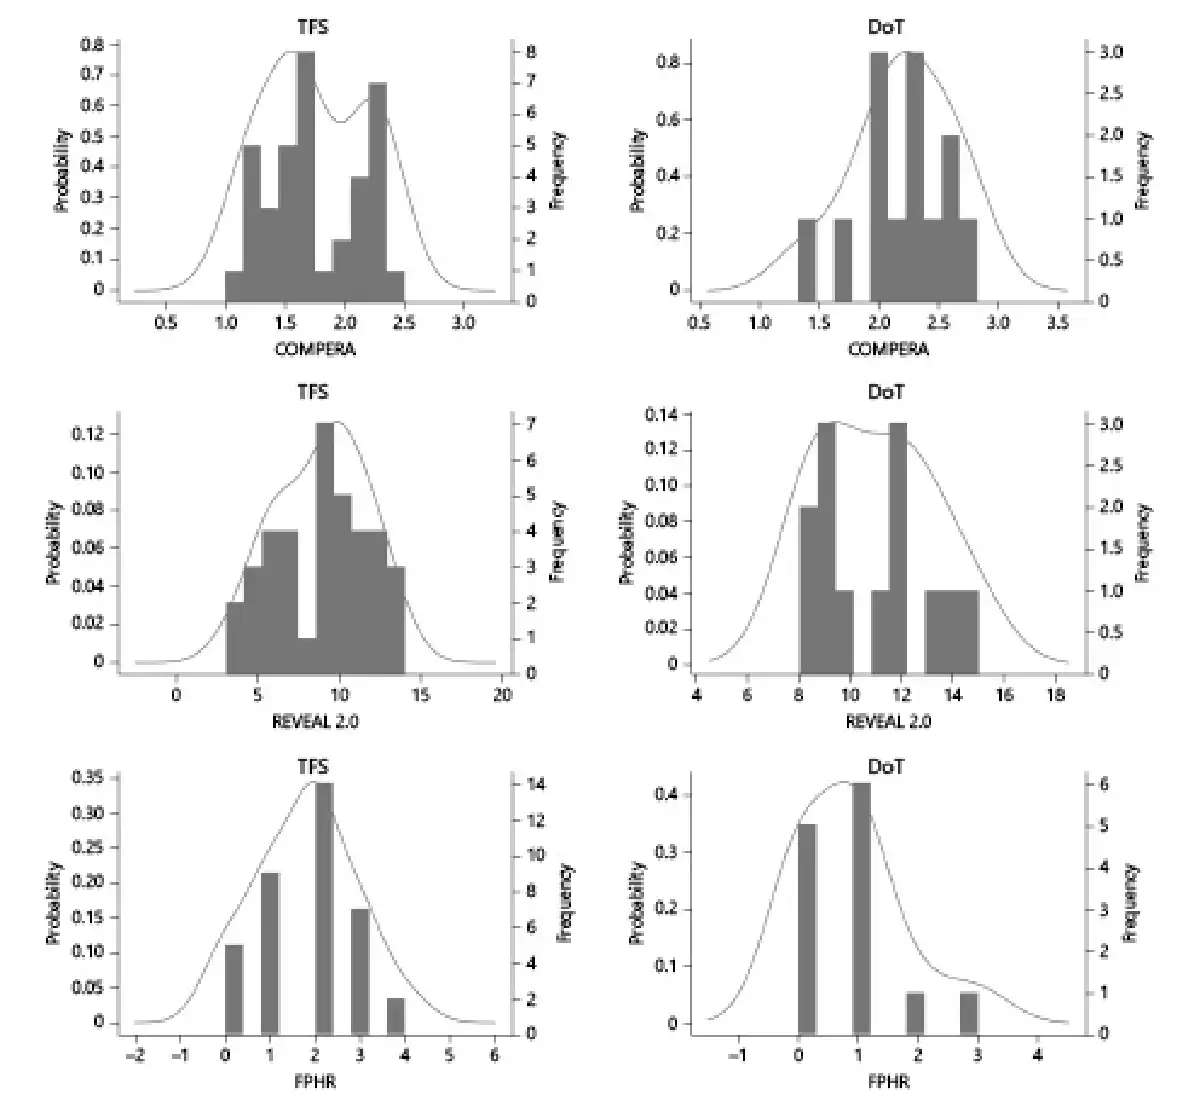
Fig. 2
Probability distribution curves at baseline for TFS and DoT. Axis x: risk stratification score, axis y: probability density function. Narrow and pointy distribution shapes indicate a small spread of score values (e.g. COMPERA score), whereas broader and flatter curves indicate more widespread score values (e.g. REVEAL 2.0 and FPHR scores).
TFs for H-I R versus LR categories for each score is depicted in Figure 3. The statistical comparison of Kaplan-Meier curves indicates no significant difference between the 2 categories for REVEAL 2.0, COMPERA, and FPHR (p value 0.0852, 0.3625, and 0.2882, respectively).
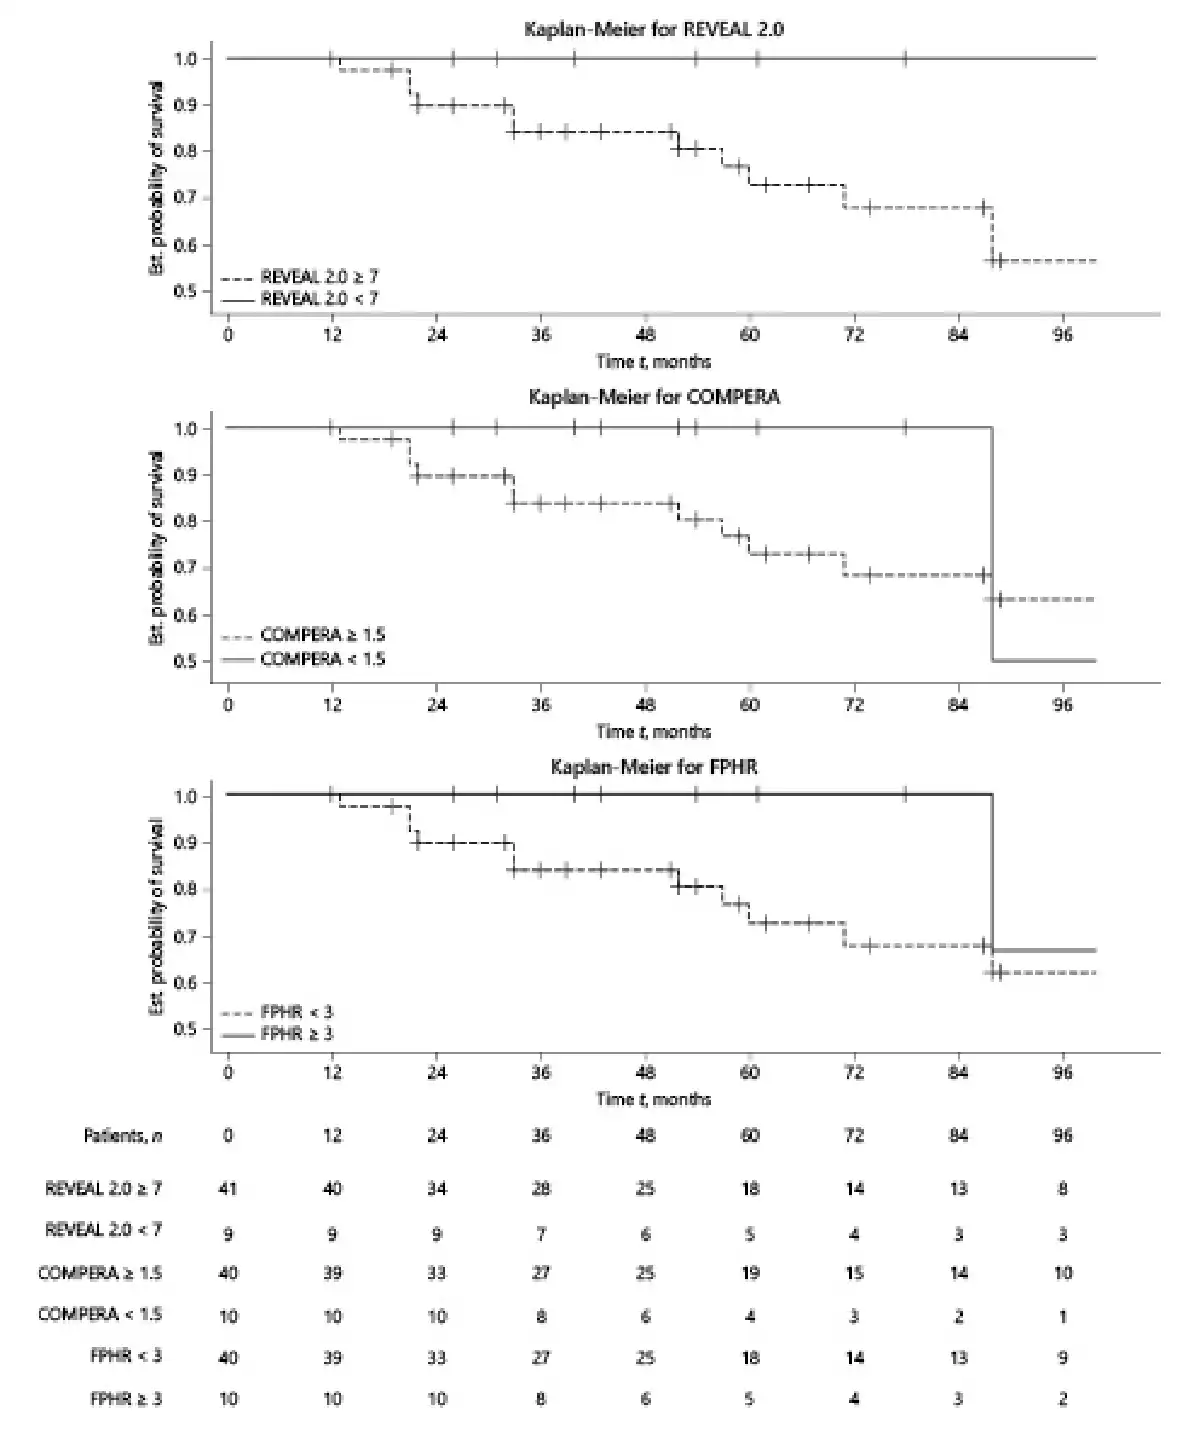
Fig. 3
Kaplan-Meier survival curves according to the stratification scores at baseline.
Risk Stratification at 1 Year Follow-Up
Compared to baseline, the number of low risk-patients increased and high-risk patients decreased according to the 3 scores calculated at 1 year (Table 2). Improvement from high- to intermediate- or low-risk status occurred more often in REVEAL 2.0 where high-risk patients at baseline were most prevalent (Table 2).
Prognosis of the TFS group after 1 year of treatment improved from high mortality risk to intermediate (median score [IQR]; 7.0 [1, 15]) according to REVEAL 2.0 and from intermediate to low for the COMPERA and FPHR (1.4 [1, 2] and 3 [0, 4], respectively). Interestingly, the prognostic category remains unchanged at 1 year for the DoT group according to the 3 scores. PDC for both groups were evaluated at 1 year (shown in Fig. 4). Their comparison shows significant differences between TFS and DoT for the 3 risk stratification tools (p value 0.001, 0.0004, and 0.008 for REVEAL 2.0, COMPERA, and FPHR, respectively).
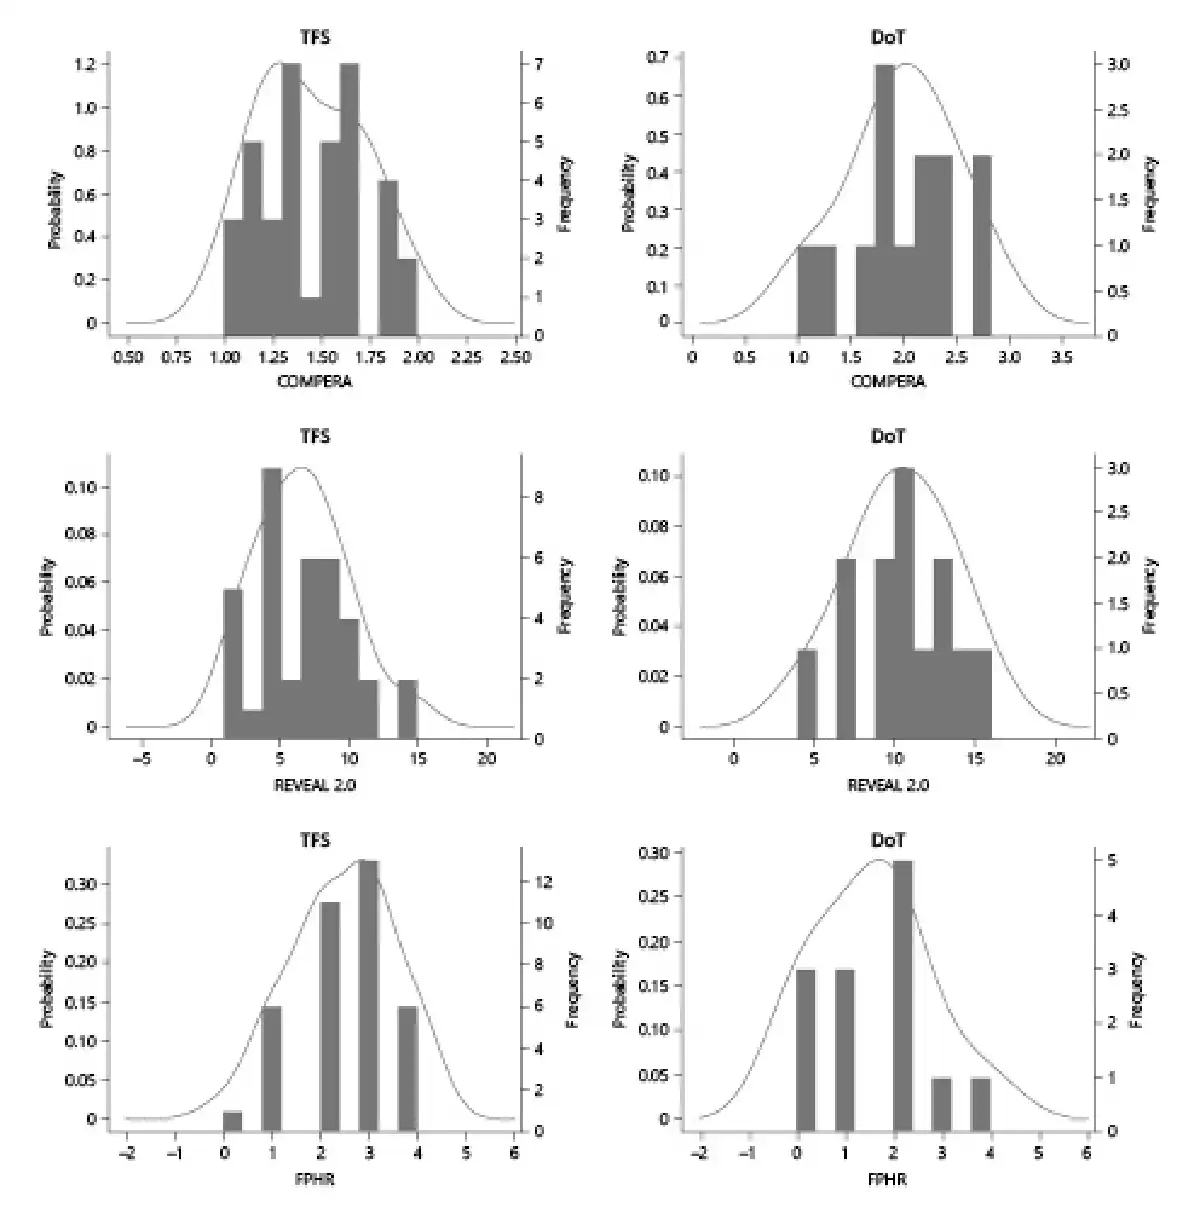
Fig. 4
Probability distribution curves at 1-year follow-up for TFS and DoT.
TFs according to stratification at 1 year is presented in Figure 5. LR patients had a better survival than the H-I R ones with a significant difference for REVEAL 2.0 (p value 0.0273) but not for the COMPERA and FPHR (p values 0.1125 and 0.0503, respectively). We compared the deltas of the scores at baseline and at 1 year (shown in online suppl. Fig. 1S) using the Kruskal Wallis test, and we observed a statistically significant improvement of the 3 PAH scores at 1 year for the TFS group but not for the DoT group.
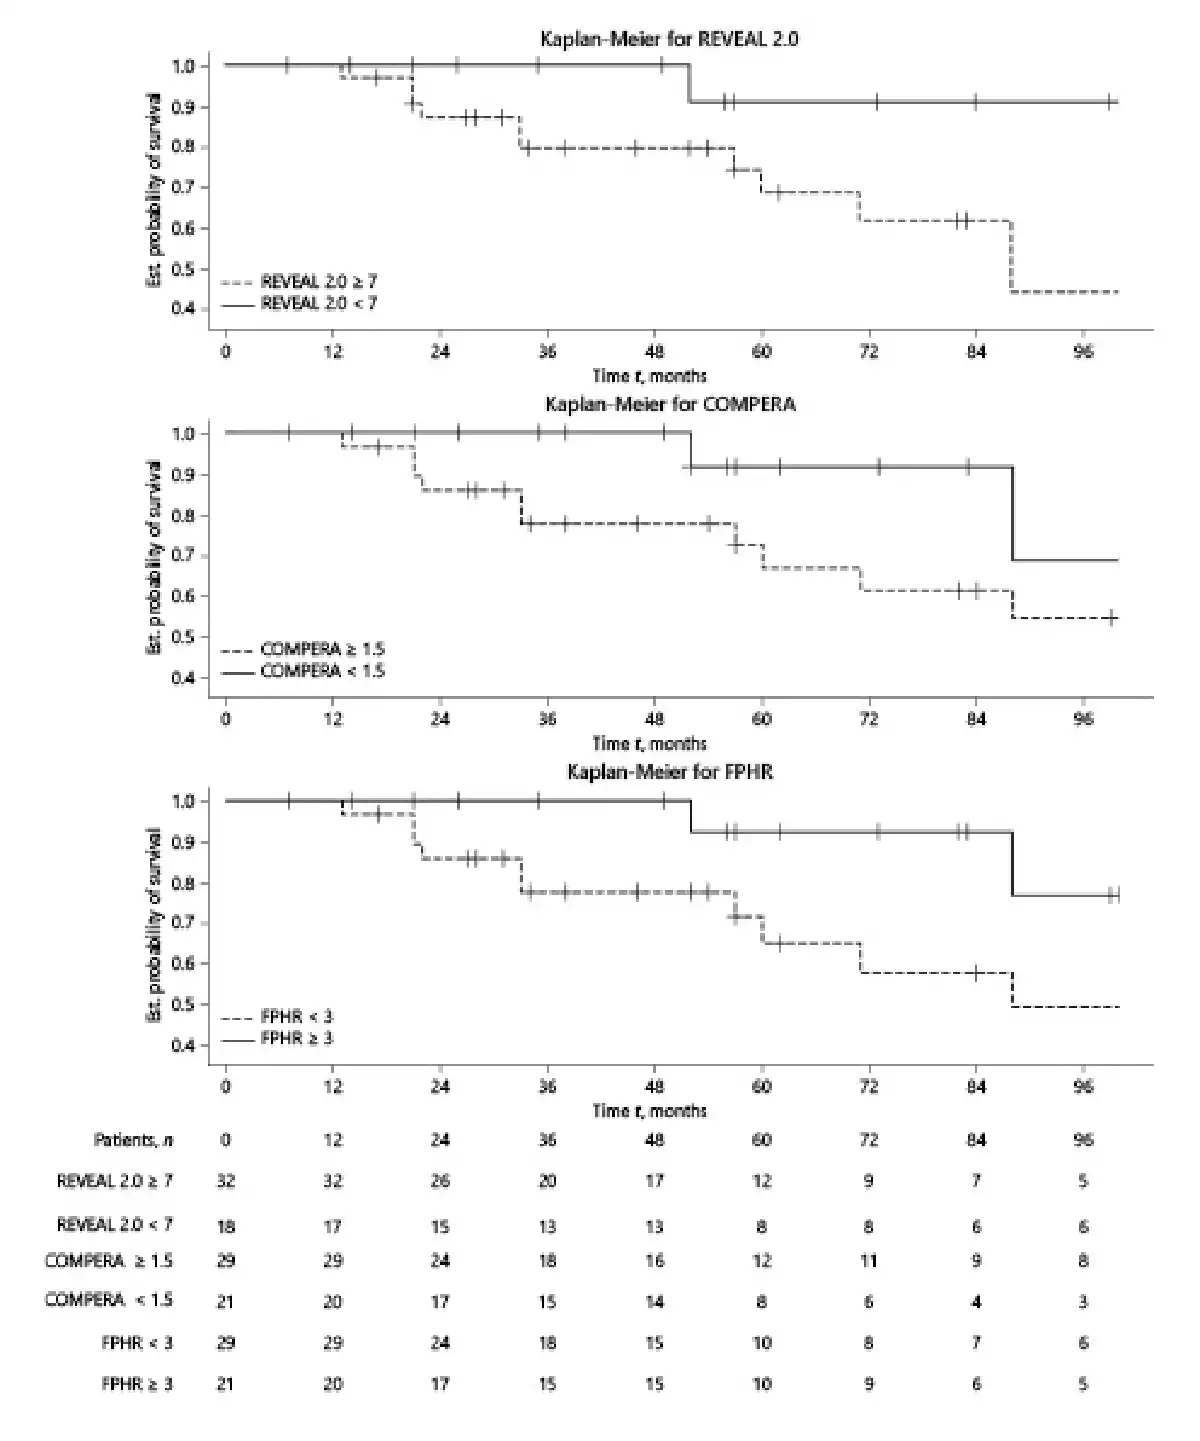
Fig. 5
Kaplan-Meier survival curves according to stratification scores at 1-year of follow-up.
Predictive Value at 3 and 5 Years
ROC curves for the 3 years’ prognosis estimated at baseline/1 year showed an AUC at 0.73/0.91 for REVEAL 2.0, 0.73/0.89 for COMPERA, and 0.77/0.78 for the FPHR (Fig. 6). The AUC for the 5 years’ prognosis estimated again at baseline/1 year was 0.69/0.76 for REVEAL 2.0, 0.85/0.82 for COMPERA, and 0.85/0.72 for the FPHR (online suppl. Fig. 2S). Therefore, TFs at 3 years post-enrollment was better predicted by the scores calculated at 1 year than by those at baseline for REVEAL and COMPERA. However, at 5 years of follow-up, this was the case only for REVEAL. Statistical comparison of ROC curves showed a significant difference at 3 and 5 years between REVEAL calculated at baseline and at 1 year as also for the FPHR at 5 years.
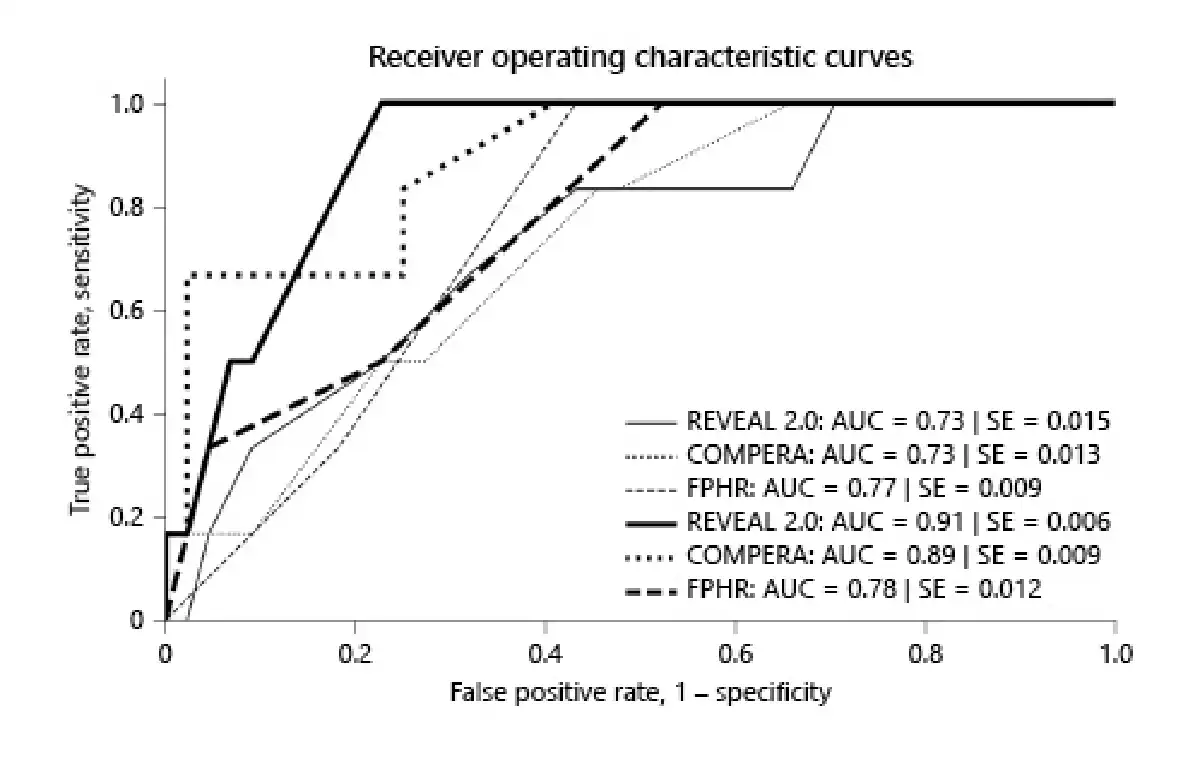
Fig. 6
ROC curves for REVEAL 2.0, COMPERA, and FPHR scores, and the respective AUC at 3 years of follow-up with scores calculated at baseline and at 1 year. Thin lines indicate scores at baseline and thick lines scores at 1 year.
Discussion
The main objective of our study was to evaluate TFs at 3 and 5 years as predicted by the 3 PAH scores calculated either at diagnosis or after 1 year of treatment. The 3-year prediction for TFs was similar among REVEAL 2.0, COMPERA, and FPHR scores calculated at baseline (Fig. 6). The performance of REVEAL 2.0 in our study is quite comparable to the 1-year prediction published by Benza et al. [], with an AUC of 0.76.
The 5-year prediction was inferior for REVEAL 2.0 compared to COMPERA and FPHR computed at baseline (online suppl. Fig. 2S) despite that REVEAL includes more variables and thus would be expected to be more accurate in risk assessment. We could hypothesize that the additional variables of REVEAL might have a confounding influence on the predictive accuracy after 3 years. On a closer look at the risk assessment by the REVEAL at baseline for the DoT group (N = 13), we notice that 11 patients had a high-risk score, while 2 had an intermediate score. Hence, the REVEAL score of the high-risk DoT group at baseline was indeed predictive of their bad prognosis. This observation emphasizes the high specificity of REVEAL 2.0 in an unselected PAH cohort.
In contrast to our results, Zelt et al. [] found in a cohort of 211 treatment naive patients a superior predictive value of REVEAL 2.0 compared to the FPHR and the ESC 2015 risk algorithm from 1 to 5 years of follow-up. In that study, the time-dependent AUC was 0.7 for REVEAL 2.0, which is quite similar to our data but was inferior for both FPHR and ESC 2015. Comparing our cohort to the original REVEAL one [], we observed an important difference in patients’ number, as well as in the time frame which was 5 years in the present report compared to 1 year for the REVEAL cohort. In our case, it was not possible to evaluate the 1-year survival prediction as no patient died or was transplanted during the first year of follow-up. Nevertheless, the mean age and the diagnostic repartition were similar in both cohorts.
When comparing the score performance from different cohorts, it is important to consider the impact of medical therapy on long-term survival which seems to be uncertain according to Boucly et al. [, ]. Prognosis is expected to be altered by treatment, and this is not accounted by any score applied at baseline.
Another objective of our study was to detect if the scores calculated at diagnosis were altered after 1 year of treatment. As outlined in current guidelines, clinicians’ aim at diagnosis is to reduce the initial high/intermediate-risk score by using an aggressive medication in order to improve morbidity and mortality [, ]. Therefore, it was reasonable to hypothesize that scores at 1 year would be improved or at least remain stable compared to those at baseline. We observed an increase of LR patients for all scores at 1 year and a decrease of high-risk ones (Table 2) suggesting a favorable effect of the treatment. However, >50% patients remained in the intermediate-risk group, whatever the scoring system. We observed a statistically significant improvement of the 3 risk assessment scores at 1 year compared to baseline for the TFS group (shown in online suppl. Fig. 1S). Moreover, the AUC at 3 years’ follow-up from scores at 1 year of treatment showed improvement of performance for the REVEAL 2.0 and COMPERA comparing to the scores at baseline, whereas FPHR prediction remained stable (shown in Fig. 6). These findings support the affirmation that disease severity could be modified by targeted therapy.
Another observation of our study was that the choice of treatment at diagnosis was partially correlated to the initial severity of the disease. Half of our patients received a monotherapy and the other half a combination treatment within the first 3 months after diagnosis. High-risk score patients classified by REVEAL 2.0 received either monotherapy or a combination treatment in an equal proportion, whereas the less numerous group of high-risk patients classified by the FPHR and COMPERA was mainly under monotherapy. On the other hand, the majority of patients classified as low risk at baseline according to the 3 scores received a monotherapy. To put these results in perspective, it should be reminded that we observed patients diagnosed >15 years ago, when the options for PH treatment were limited in contrast to nowadays treatment [, , , ]. As a consequence, monotherapy was the choice by default even in high-risk patients. Furthermore, none of the 3 scores nor practice guidelines were established, so the decision of the treatment strategy was based on clinical evaluation and medical experience.
Limitations
Our study has several limitations. The small cohort size arises concerns of the potential generalization of our results to larger populations. As such, the present data should essentially be considered as confirmatory in nature. However, the repartition of PAH subgroups, and the distribution of FC, sex, and mean age were similar to larger published cohorts. Second, because of the retrospective nature of this study, not all variables were available, especially invasive hemodynamic parameters at 1 year of follow-up. However, the majority of them were obtained at baseline, and a well-defined strategy for handling missing values was used. Thirdly, potential bias exists for FPHR calculation when missing variables automatically move the score to a lower risk. However, this situation occurred only for one DoT and 2 TFS patients. As a consequence, we do not think the overall conclusion is altered. Another limitation is the long time frame of the study with the meanwhile licensing of new drugs and publication of updated clinical guidelines. While this had a clear impact on the treatment strategy, we did not observe a cluster of death or transplantation in the earlier study period.
Conclusion
We showed that the 3 PAH scores are applicable and useful in daily practice of a tertiary PH clinic. Some differences of performance among REVEAL 2.0, COMPERA, and FPHR were observed; however, a low risk status was consistently associated with an excellent TFs, whatever the scoring used. These results are in agreement with previously published analysis from large registries. A reassessment of the stratification risk after 1 year of treatment is particularly useful for redefining the treatment strategy for those patients who remain in the intermediate- or high-risk group.
Further investigation is necessary for the evaluation of potential new variables that could improve the prediction of the 3 risk assessment tools. For example, peak oxygen uptake measured during cardiopulmonary exercise testing would be a potential candidate marker. Finally, as individual response to treatment has a major impact for prognosis, score calculation after 6 and/or 12 months should be strongly recommended.
Acknowledgment
We thank Dr. Benoît Lechartier MD, PhD, Paris, for his valuable comments on the manuscript.
Statement of Ethics
This study was approved by the Swiss Ethics Committee (Project ID, 2020-02140). We used the medical data of a group of 52 patients followed up at CHUV. Data of interest are those defined in the published severity scores; we accessed their medical files to search for medical information such as the right heart catheterization report, echocardiographic images and reports, biochemical results (BNP, renal function, and mixed venous oxygen saturation), exercise testing (6MWD), and pulmonary function reports. The study required no use of any biologic material. Three patients died before having the opportunity to sign any consent. A group of 4 surviving patients has not expressed any decision, so oral consent was obtained. All other patients have signed either the consent of Swiss Pulmonary Hypertension Registry or the general consent form from our hospital. As research team of this study, we confirm that we did not make use of any medical data or personal information from patients who have specifically refused the use of their data for research.
Conflict of Interest Statement
The authors have no conflicts of interest to declare.
Funding Sources
No funding was needed for this study.
Author Contributions
Argyro Vraka contributed to investigation, data curation, formal analysis, and writing – original draft, review, and editing; John-David Aubert contributed to study’s design, methodology, project administration, data curation, and writing – review and editing; Patrick Yerly contributed to writing – review and editing.
Data Availability Statement
The original medical data that support the findings of this study are not publicly available because this information could compromise the privacy of the patients. However, anonymized raw data are available upon request from the first author: Vraka Argyro.
References
- 1. Benza RL, Gomberg-Maitland M, Miller DP, Frost A, Frantz RP, Foreman AJ, et al. The REVEAL registry risk score calculator in patients newly diagnosed with pulmonary arterial hypertension. Chest. 2012:354–2.
- 2. Hoeper MM, Kramer T, Pan Z, Eichstaedt CA, Spiesshoefer J, Benjamin N, et al. Mortality in pulmonary arterial hypertension: prediction by the 2015 European pulmonary hypertension guidelines risk stratification model. Eur Respir J. 2017;50(2):1700740.
- 3. Benza RL, Gomberg-Maitland M, Elliot CG, Farber HW, Foreman AJ, Frost AE, et al. Predicting survival in patients with pulmonary arterial hypertension: the REVEAL risk score calculator 2.0 and comparison with ESC/ERS-based risk assessment strategies. Chest. 2019 Aug;156(2):323–37.
- 4. Boucly A, Weatherald J, Savale L, Jaïs X, Cottin V, Prevot G, et al. Risk assessment, prognosis and guideline implementation in pulmonary arterial hypertension. Eur Respir J. 2017 Aug;50(2).
- 5. Galiè N, Humbert M, Vachiery J-L, Gibbs S, Lang I, Torbicki A, et al. “2015 ESC/ERS Guidelines for the diagnosis and treatment of pulmonary hypertension. The Joint Task Force for the Diagnosis and Treatment of Pulmonary Hypertension of the European Society of Cardiology (ESC) and the European Respiratory Society (ERS)”. Eur Respir J. 2015;46:903–75. Eur Respir J. 2015;46:1855–6. http://dx.doi.org/10.1183/13993003.51032-2015.
- 6. Humbert M, Sitbon O, Chaouat A, Bertocchi M, Habib G, Gressin V, et al. Pulmonary arterial hypertension in France: results from a national registry. Am J Respir Crit Care Med. 2006;173(9):1023–30.
- 7. Sitbon O, Benza RL, Badesch DB, Barst RJ, Elliott CG, Gressin V, et al. Validation of two predictive models for survival in pulmonary arterial hypertension. Eur Respir J. 2015;46(1):152–64.
- 8. Kanwar M, Raina A, Lohmueller L, Kraisangka J, Benza R. The use of risk assessment tools and prognostic scores in managing patients with pulmonary arterial hypertension. Curr Hypertens Rep. 2019 Apr;2521(6):45.
- 9. Frost A, Badesch D, Gibbs SJ, Gopalan D, Khanna D, Manes A, et al. Diagnosis of pulmonary hypertension. Eur Respir J. 2019;53:1801904.
- 10. Galiè N, Simonneau G. The fifth world symposium on pulmonary hypertension. J Am Coll Cardiol. 2013 Dec 24;62(25 Suppl):D1–3. http://dx.doi.org/10.1016/j.jacc.2013.10.030.
- 11. Simonneau G, Montani D, Celermajer DS, Denton CP, Gatzoulis MA, Krowka M, et al. Haemodynamic definitions and updated clinical classification of pulmonary hypertension. Eur Respir J. 2019.
- 12. Hanley JA, McNeil BJ. A method of comparing the areas under receiver operating characteristic curves derived from the same cases. Radiology. 1983 Sep;148(3):839–43. http://dx.doi.org/10.1148/radiology.148.3.6878708.
- 13. Vazquez ZGS, Klinger JR. Guidelines for the treatment of pulmonary arterial hypertension. Lung. 2020 July;198:581–96. http://dx.doi.org/10.1007/s00408-020-00375-w.
- 14. Humbert M, Sitbon O, Simonneau G. Treatment of pulmonary arterial hypertension. N Engl J Med. 2004;351(14):1425–36. http://dx.doi.org/10.1056/NEJMra040291.
- 15. Klinger JR, Elliott CG, Levine DJ, Bossone E, Duvall L, Fagan K, et al. Therapy for pulmonary arterial hypertension in adults: update of the CHEST guideline and expert panel report. Chest. 2019;55(3):565–86.
- 16. Zelt JGE, Hossain A, Sun LY, Mehta S, Chandy G, Davies RA, et al. Incorporation of renal function in mortality risk assessment for pulmonary arterial hypertension. J Heart Lung Transplant. 2020 Jul;39(7):675–85.
- 17. Boucly A, Savale L, Weatherald J, Montani D, Jevnikar M, Jaïs X, et al. Impact of initial treatment strategy on long-term survival in pulmonary arterial hypertension. Eur Respir J. 2018;52:OA271. (meeting abstract).
- 18. Boucly A, Savale L, Jaïs X, Bauer F, Bergot E, Bertoletti L, et al. Association between initial treatment strategy and long-term survival in pulmonary arterial hypertension. Am J Respir Crit Care Med. 2021 Oct 1;204(7):842–85.
- 19. Galiè N, Channick RN, Frantz RP, Grünig E, Jing ZC, Moiseeva O, et al. Risk stratification and medical therapy of pulmonary arterial hypertension. Eur Respir J. 2019 Jan;53:1801889.
- 20. Yaghi S, Novikov A, Trandafirescu T. Clinical update on pulmonary hypertension. J Investig Med. 2020 Apr;68(4):821–7. http://dx.doi.org/10.1136/jim-2020-001291.