INTRODUCTION
Geological and seismic studies indicate that the transition from extensional to contractional deformation promoted the reactivation of normal faults in back-arc extensional basins behind the Eurasian Plate on the eastern side of the Sea of Japan, transforming them into reverse faults around 2 to 3 million years ago (, ). The process of reactivation resulted in a complex network of fault-oriented southwest-northeast (SW-NE) with varying dip and strike directions (). These faults are seismically active structures, as evidenced by several devastating earthquakes with magnitude (M) ~ 7 that have struck the western coast of Japan since the 20th century. Notable events include the 1940 M7.5 Shakotan-Oki earthquake, the 1983 M7.7 Central Japan Sea earthquake, the 1939 M6.8 Oga earthquake, and the 1964 Niigata earthquake (Fig. 1A) (). These occurrences indicate the region’s susceptibility to catastrophic earthquakes capable of triggering tsunamis.
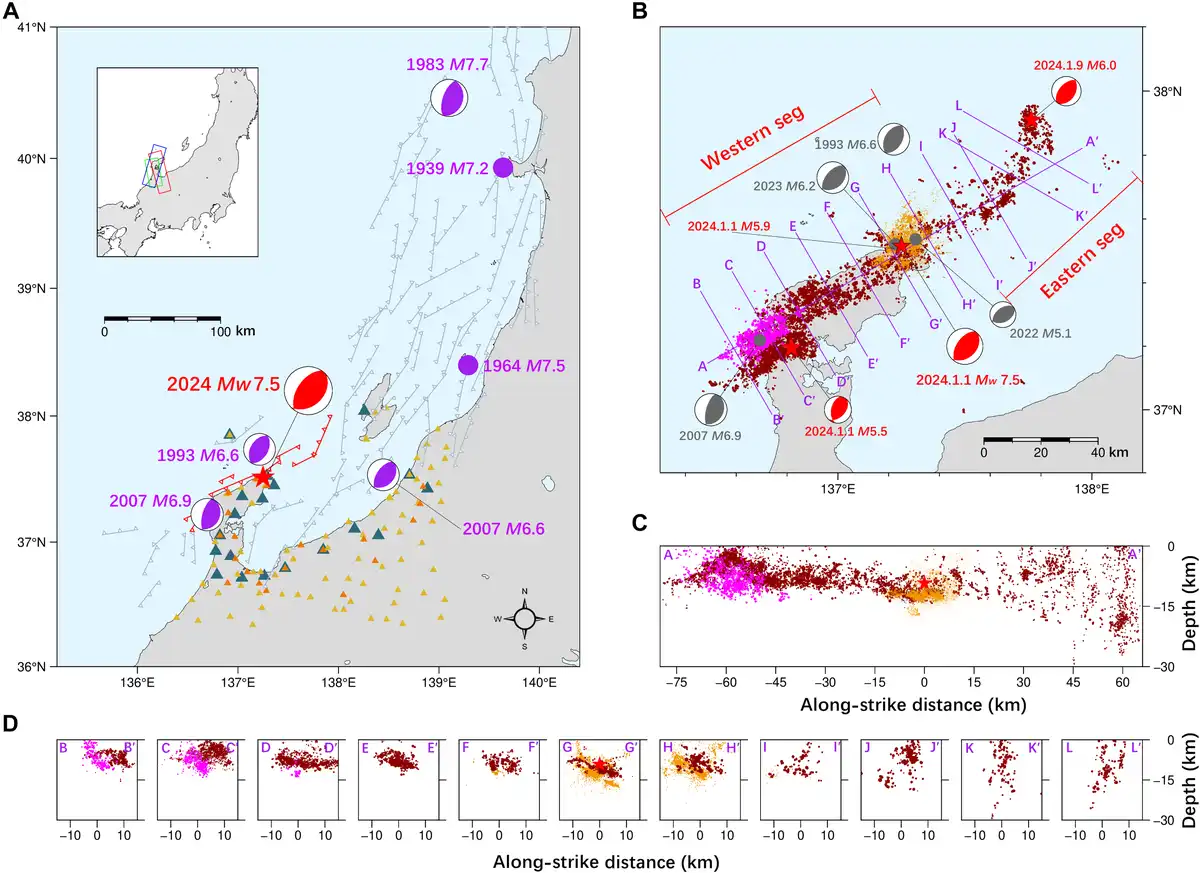
Fig. 1
Tectonic setting and location of the 2024 Noto Mw 7.5 earthquake.
(A) Red beach ball represents the focal mechanism of the 2024 Noto Mw 7.5 earthquake from the Japan Meteorological Agency (JMA). Purple circles and beach balls represent the locations of large historical earthquakes and their focal mechanisms, respectively. Gray lines denote active faults, with serrations indicating the fault’s dip direction (). The faults marked in red indicate those likely involved in the 2024 Noto earthquake. Yellow and orange triangles represent GNSS stations and SM stations, respectively, while dark green triangles represent broadband seismic stations used for aftershock relocation. The inset shows the study region with a colored rectangle, indicating the spatial coverage of ALOS-2 data used in this study. (B) Distribution of relocated aftershocks of the 2024 Noto Mw 7.5 earthquake during 2024.1.1–2024.1.28 (dark red circles) and earthquake swarms during 2020–2023 (yellow circles) (). Magenta circles represent the aftershocks of the 2007 M6.9 Noto earthquake (). The red focal mechanisms represent the epicenters of the 2024 Mw 7.5 Noto earthquake and its two largest aftershocks. Gray focal mechanisms represent other large-magnitude earthquakes in the region over the past 30 years. Purple lines indicate the locations of twelve fault-perpendicular profiles (AA′-LL′), shown in (C) and (D). (C and D) The projections of the 2024 Noto aftershocks, the 2020–2023 earthquake swarms, and the 2007 relocated aftershocks are shown at the position of the purple profile lines in (B) profile AA′ represents the projection of seismic events onto the along-strike profile section, from within 5-km distance from the line. The remaining profiles represent the projection of seismic events onto profiles perpendicular to the strike direction.
On 1 January 2024, a moment magnitude (Mw) 7.5 earthquake struck the Noto Peninsula, an area recently known for earthquake swarms and associated deformation transients from 2020 through 2023 (–). According to the Japan Meteorological Agency (JMA), aftershocks of the 2024 Noto earthquake extended ~160 km along a SW-NE direction and suggest a southeast (SE)–dipping rupture geometry (). Fifteen events with M > 5 occurred during 1 to 30 January 2024. The aftershocks triggered by the 2024 earthquake overlap with those of the 2007 Noto M6.9 event (Fig. 1B). The epicenter of the 2024 Noto earthquake was located within the earthquake swarm zone, with a focal depth of ~9.2 km, similar to the depth of the swarm activity. This implies a potential connection between the initiation of the 2024 Noto event and the preceding earthquake swarm. Two large earthquakes (2022 M5.1 and 2023 M6.2) occurred on different preexisting fault structures within the earthquake swarm area, reflecting the structural complexity of the earthquake swarm region ().
The fault database from the National Institute of Advanced Industrial Science and Technology shows that there is a northwest (NW)–dipping fault to the east of the epicenter and an SE-dipping fault on the west side, suggesting that the 2024 Noto earthquake may have involved two complex, opposite dipping faults (). Okuwaki et al. () analyzed the rupture process of the 2024 Noto earthquake on the basis of teleseismic P-wave data and found a low-energy initial rupture phase coinciding with the earthquake swarm area in the first 10 s. Due to the high uncertainty of aftershock locations reported by the JMA, it is difficult to independently determine the dip of the eastern fault segment. As a result, their inversion uses two models to determine the dip of this section of the fault. Ma et al. () found that the 2024 Noto earthquake experienced a very slow rupture velocity lasting from 15 to 20 s, along with a strong release of high-frequency energy. They suggested that the complex evolution of rupture was controlled by low fault strength and variability in the fault’s properties. Xu et al. () found that an initial slow rupture followed by a delayed rupture of an asperity located southwest of the hypocenter, indicating that a notable asperity impeded the slip. Yoshida et al. () analyzed the spatiotemporal relationship between the mainshock and foreshocks by relocating aftershocks and found that several earthquake swarm faults are located beneath the main fault of the 2024 Noto earthquake. Yang et al. () used Global Navigation Satellite System (GNSS) data to invert for coseismic slip and early postseismic afterslip, suggesting an overlap between coseismic slip, afterslip, and aftershocks. They proposed that the early afterslip might have triggered subsequent aftershocks. Fuji et al. () used tsunami wave and GNSS data for a uniform slip inversion and concluded that the 2024 Noto earthquake only affected the SE-dipping fault, leaving the NW-dipping fault in the eastern segment unruptured. Liu et al. () analyzed near-field waveforms of four earthquakes in the swarm region and found evidence of gradual fluid accumulation, highlighting the role of fluids in earthquake nucleation. However, the role of one or more fluid-weakened, stress-sensitive swarm faults in the 2024 Noto rupture sequence remains unclear.
The 2024 Noto earthquake is the largest instrumentally recorded earthquake in the swarm areas (). Seismic and geodetic evidence suggest that the Noto earthquake swarm during 2020–2023 involved slip on multiple faults and substantial volume strain, associated with aseismic creep and upward fluid migration (–, –). This indicates that the reactivation of preexisting fault systems and fluid enrichment have contributed to the complex seismic environment in the Noto Peninsula region. Numerous laboratory experiments and seismological studies suggest that seismic swarms associated with fluid migration and aseismic creep consist predominantly of small earthquake events associated with the weakening of faults and large earthquakes above M7 are rare in swarm areas (, –). The 2024 Noto earthquake, due to its well-constrained seismological and geodetic observations, provides an excellent opportunity to better understand how a major seismic event can nucleate and evolve from a previously active earthquake swarm. In particular, this cascading event sequence illuminates how earthquake swarm faults, characterized by complex structures and the weakening effect of fluids, affect the dynamics of the subsequent mainshock rupture.
Here, we investigate the fault geometry and rupture characteristics of the 2024 Noto earthquake using relocated aftershocks, geodetic and near- and far-field seismic data. We use near-field broadband seismic stations to relocate aftershocks to better constrain the fault geometry and evolution of aftershocks. Then, we obtain the spatiotemporal evolution of high-frequency radiators using slowness-enhanced back projection (SEBP) of teleseismic data collected by North American (NA) and Australian (AU) seismic arrays. Last, we constrain the spatiotemporal evolution of fault slip using finite fault inversion on the basis of synthetic aperture radar (SAR) pixel offsets, teleseismic, GNSS, and strong-motion (SM) data. The complementary constraints of multiple datasets enabled us to obtain a more detailed understanding of the kinematic rupture evolution. Our results reveal the complex rupture characteristics of this large earthquake in an earthquake swarm area, including its slow initial rupture phase involving multiple faults, delayed and intense rupture of strong asperities, and triggering of an aftershock sequence and a distinct small earthquake swarm. These findings contribute to a better understanding of the nature of cascading rupture mechanisms of large earthquakes in structurally complex regions.
RESULTS
Relocated aftershocks
We used broadband seismic data from 21 near-field stations (Fig. 1A) to relocate earthquake events between 1 and 28 January 2024, as detailed in Materials and Methods. Using the HypoDD software () and conducting four iterations (), we ultimately identified 13,053 earthquake events. A comparison with the earthquake catalog released by JMA revealed a sharpened spatial clustering in our locations, leading to a more robust depiction of the underlying fault geometries. The aftershock distribution notably differentiates between the western (profile BB′-HH′ in Fig. 1D) and eastern segments (profile II′-LL′ in Fig. 1D) separated at about 137.5°E (Fig. 1C). Most aftershocks in the western section are focused at depths of up to 13 km, following a trend of around 50°. In contrast, aftershocks in the eastern section reach depths of up to 30 km and are spread out along a trend of ~40°. Oppositely dipping trends are observed in profiles HH′ and II′ (~25 km northeast of the epicenter). Profile HH′ and its western counterparts exhibit southeastward dipping bands of seismicity, whereas profile II′ and its eastern counterparts show northwestward dips (Fig. 1). The aftershocks of the 2024 Noto earthquake notably overlap with the 2020–2023 earthquake swarm, indicating that the 2024 Noto earthquake induced rerupture of earthquake swarm–related faults (profile GG′ in Figs. 1D and 2D). We also find that the 2007 M6.9 event likely occurred on different faults from the 2024 Mw 7.5 rupture (profile BB′-CC′ in Fig. 1D), reflecting the complexity of the fault distribution in this area. The substantial overlap between the distribution of 2024 Noto aftershocks and the earthquake swarm, with the hypocenter located in the gap between four clusters of the earthquake swarm, suggests a connection between the nucleation of the 2024 Noto Mw 7.5 earthquake and the earthquake swarms and associated fluids.
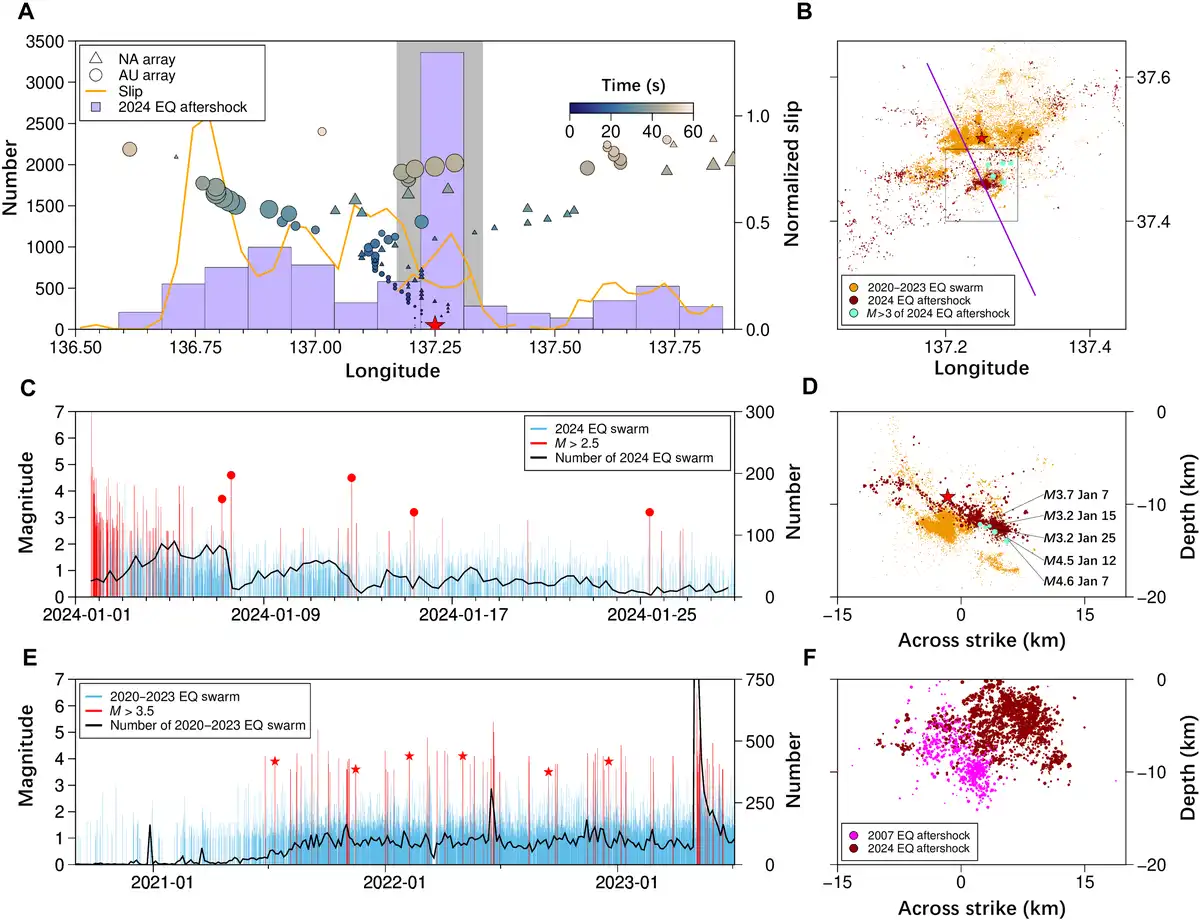
Fig. 2
Aftershocks, normalized coseismic slip, and SEBP energy of 2024 Mw 7.5 Noto earthquake compared with the pre-earthquake earthquake swarm.
(A) Circles and triangles, color-coded by rupture times, represent the longitude of high-frequency radiators determined with data from North American (NA) and Australian (AU) arrays. Orange lines show the depth-averaged and normalized along-longitude slip distribution inverted from this study. Purple bars represent the M > 0.5 aftershock distribution in 12-km intervals along longitude between 1 and 28 January 2024. The gray-shaded area indicates the region of the 2020–2023 earthquake swarm. The red star represents the epicenter of the 2024 Noto Mw 7.5 earthquake. (B) Spatial relationship between the 2020–2023 earthquake swarm (yellow circles) and the 2024 earthquake swarm (dark red circles). Cyan circles represent M ≥ 3 events that are accompanied by decreases in the rate of events in the 2024 swarm shown in (C). (C) Magnitude-time plot of the earthquake swarm triggered by the 2024 Mw 7.5 aftershock. Blue sticks represent the occurrence time and magnitudes of M > 0.5 events within the black rectangle shown in (B). The black line indicates the rate of the triggered earthquake swarm (number of events per 6 hours). Red sticks represent events with M > 2.5, and red circles represent the M ≥ 3 events marked by blue circles in (B) and (D). (D) Vertical cross section along the purple line in (B). (E) Magnitude-time plot (blue and red sticks) and event rate (black line) of the 2020–2023 earthquake swarm (number of events per 4 days). Red stars represent the events that are not accompanied by abundant aftershocks. (F) Profiles CC′ in Fig. 1D. EQ, earthquake.
A high number of aftershocks is found near 137.25°E, with more than 3000 events around M1 occurring within a 0.05° to 0.1° region (Fig. 2A). Our analysis reveals the presence of a small earthquake swarm triggered by the mainshock, located at a depth of about 13 km (Fig. 2, B and D). This swarm lasted about 1 month, reaching a maximum magnitude of M4.6 (Fig. 2C). The earthquake swarm began on 1 January 2024, with a generally decreasing trend in the frequency of seismic events, effectively concluding around 25 January 2024. Notably, larger seismic events in the swarm area did not generate the usual number of secondary aftershocks, which are commonly seen with typical seismic activity (Fig. 2, B to D). For instance, a M4.6 earthquake on 7 January 2024 occurred during a notable drop in swarm activity.
Slowness-enhanced back projection
Using the SEBP method, we used teleseismic data from the AU and NA arrays to perform a rupture process inversion for the 2024 Noto earthquake (). Additionally, we used six aftershock events (M > 4.5) to correct for velocity structure heterogeneity, ensuring more robust results (). The SEBP results effectively illuminate the complex spatiotemporal evolution of the high-frequency radiation of the 2024 Noto earthquake. As shown in Fig. 3, the high-frequency radiations of the Mw 7.5 mainshock indicate that the bilateral rupture mainly occurred in two stages. During the initial 18 s, the rupture propagated slowly southwestward at ~0.6 km/s, showing good consistency in both arrays. Notably, the locations of high-frequency radiations in the first stage overlap well with the earthquake swarm region (Fig. 3A). In the second stage, the rupture began to accelerate bilaterally. From 20 to 40 s, it continued to rupture southwestward at ~2.7 km/s. Between 20 and 56 s, the rupture propagated northeastward at a speed of ~3.1 km/s. Given the resolution limitations of SEBP and the bilateral rupture, particularly in the complex geometry of the swarm-fault region, the apparent back-propagating rupture observed between 0 and 18 s is likely an artifact rather than a real physical process. However, the slow rupture evolution is a reliable feature. It is noteworthy that the strongest high-frequency radiations at the AU array appeared between 30 and 37 s, accompanied by deceleration of the rupture.
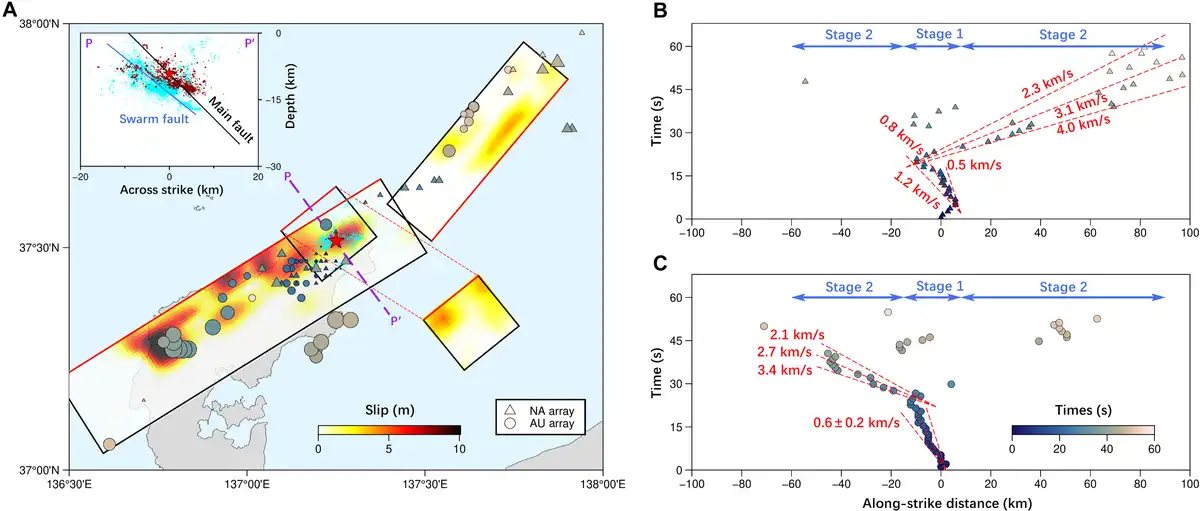
Fig. 3
SEBP result of the 2024 Noto Mw 7.5 earthquake.
(A) Circles and triangles represent high-frequency radiators determined with the AU and NA arrays, respectively, which are color-coded by rupture time and scaled proportionally to the normalized back projection power. The red star indicates the epicenter of 2024 Noto earthquake. Red lines represent the top edge of the model faults. The cyan circles are the 2020–2023 earthquake swarm events. The inset shows a vertical cross section along the purple dashed line PP′, showing the spatial relationships between the main fault (black line), the swarm fault used for inversion (blue line), the 2024 Noto aftershocks (dark red circles), and the 2020–2023 earthquake swarm (cyan circles). (B and C) Along-strike distances from the epicenter versus times of high-frequency radiators for the NA (B) and AU (C) arrays. Dashed lines indicate reference rupture velocities. Positive distance values on the x axis are toward 40° (B) and toward 58° (C) from the epicenter.
Coseismic deformation
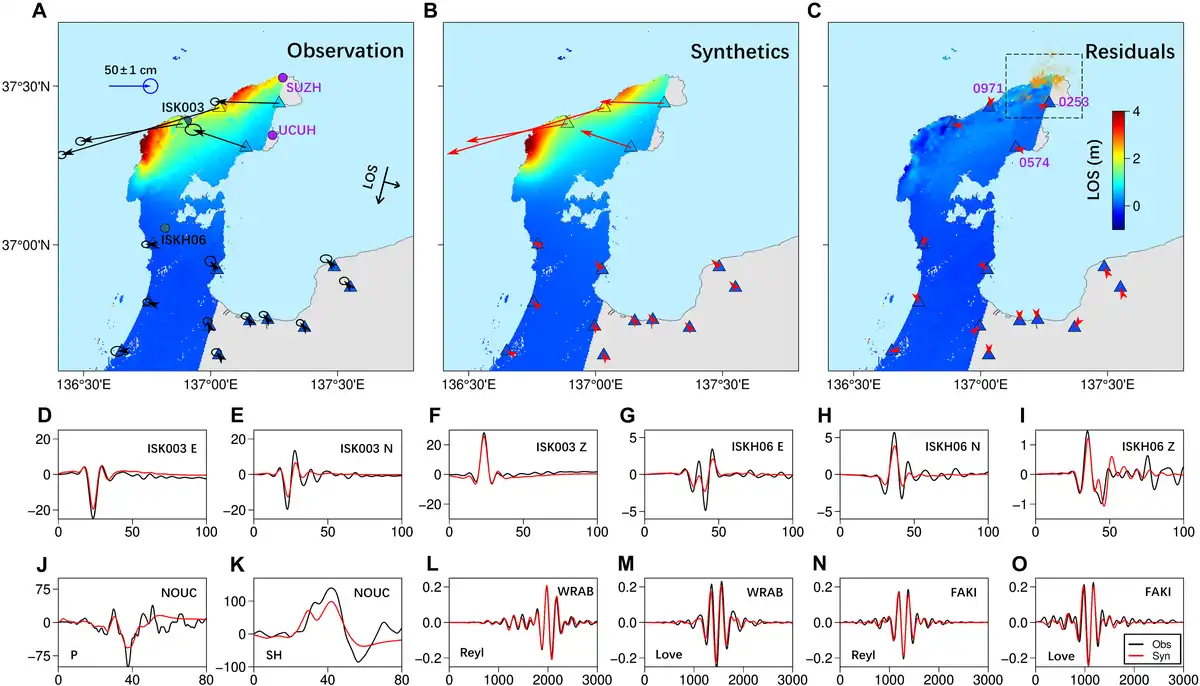
We used the pixel offset method on ALOS-2 SAR (Stripmap) data from three tracks to obtain the coseismic line-of-sight deformation field. Additionally, we used differential measurements from 71 GNSS stations within 200 km of the epicenter to obtain three-dimensional coseismic displacements (). The range pixel-offset maps derived from the ALOS-2 data indicate that the deformation observed in the Noto Peninsula is mainly characterized by uplift, with line-of-sight decreases of up to 4 m at the northwestern end (Fig. 4). The GNSS coseismic displacement field reveals that the nearby stations are predominantly displaced toward the west and uplifting, with a 2-m southwestward displacement near the epicenter and prevailing northwestward movements in the southeastern part of the source region (fig. S1). The general deformation pattern is consistent with a thrust mechanism, coupled with a minor right-lateral component (figs. S1 and S2). The deformation fields obtained from the SAR and GNSS data exhibit a high degree of consistency, indicating the reliability of our observations (Fig. 4, A to C).
Data fitting of SAR pixel offsets, GNSS data, and seismic waveform data.
Fig. 4. (A to C) From left to right are observation data from descending orbit Path 26 from ALOS2, simulated data based on the optimal coseismic slip distribution, and residuals. The colors of the triangles represent the three-component GNSS displacements projected into the corresponding SAR data line of sight. The arrows represent observations (black), simulations (red), and residuals (red) of the horizontal GNSS displacements. Purple circles represent broadband seismic stations in (A). The purple labels indicate the three GNSS stations closest to the 2020–2023 earthquake swarm in (C). (D to I) Observed and simulated SM data, where the black line represents observational values and the red line represents simulated waveforms. Specifically, (D) to (F) denote the east-west, north-south, and vertical components at station ISK003, while (G) to (I) denote station ISKH06. (J and K) Teleseismic P wave and SH wave at station NOUC, respectively. (L to O) Teleseismic Rayleigh waves and Love waves at stations WRAB and FAKI, respectively. Seismic station locations are shown in fig. S3 and additional waveform data and model fits are shown in figs. S4 to S8.
Finite fault inversion
Guided by the relocated aftershocks, we performed an inversion using three faults with opposing dips. In the western section, west of 137.5°E, the main model fault dips 45° to the SE. We use a fault that dips 38° to the SE to approximate one or more closely spaced faults that fit the 2020–2023 earthquake swarm. The swarm faults are located beneath the main fault of the 2024 Noto earthquake and are nearly parallel to it (Fig. 2D). While there are apparently multiple subparallel swarm faults, in the inversion, the slip is only inverted for a single planar fault. In the eastern section, the model fault dips 53° to the NW. The hypocenter was placed on the main fault. Our finite fault inversion results fit well with both seismic and geodetic data. The fitting of the horizontal GNSS data is excellent (fig. S1). The SM data are also well fit, but the peak values of simulated ground motions at some stations are slightly lower than the observed values, which may be due to simplifications in the fault and velocity models. Some near-field stations exhibit large errors, possibly because our inversion uses displacement data, and the baseline drift at near-field stations is too large, making it difficult to accurately integrate acceleration into displacement, as seen in station ISK001 (Fig. 4, D to I, and fig. S4). The fitting of the first-order features of the teleseismic waveforms is also good (Fig. 4, J to O, and figs. S5 to S8), although the fitting of high-frequency information is slightly worse, possibly due to limitations in the velocity model (fig. S9). Overall, the simulated and observed data from the optimal model are consistent. A static checkerboard test indicates that the resolution above a depth of ~15 km is high (fig. S10), noting that the slip from the 2024 Noto Mw 7.5 earthquake mainly occurs above 15 km. The geodetic data provide very weak constraints on the eastern fault, so we rely on the SEBP results to analyze the rupture characteristics of the eastern segment. There is certainly some trade-off between slip on the swarm fault and the main fault. However, our resolution test demonstrates that the model and data have sufficient resolution to distinguish between slip on these closely spaced faults and the sequential order of their rupture. This provides a robust foundation for subsequent analyses of the involvement of these faults in the rupture process (fig. S11).
Our preferred finite fault slip model suggests that the total energy released during the 2024 Noto earthquake is equivalent to an event of Mw 7.54. Initially, early bilateral rupture growth occurs within the 2020–2023 earthquake swarm zone, consistent with the findings from the SEBP (Figs. 3 and 5). The initial rupture during the first ~18 s was almost fully confined to within the swarm region. Notably, the initial rupture took place on the main fault of the 2024 Noto earthquake, while the nearby swarm fault started to rupture about 6 s afterward. After 18 s, the slip on the main fault overlapping with the 2020–2023 earthquake swarm area nearly stopped, but the slip on the swarm fault persisted until 36 s. Subsequent rupture of the western segment of the fault involved four main asperities, with the largest one located 40 to 55 km southwest of the epicenter, having a slip value of up to 10 m. The seismic moment (assuming a shear modulus of 30 GPa) of the largest asperity is equivalent to an Mw 7.1 earthquake. The energy release reached its peak between 30 and 35 s, corresponding to the rupture of this largest asperity. Notably, the southwestern rupture also extended to the edge of the asperity located 25 km southwest of the hypocenter at 27 s, leaving a gap of ~10 km by 5 km. Subsequently, this asperity ruptured the gap within 9 s, with the asperity’s shape outlined by the 1-m slip contour (Fig. 5M). During this period, the westernmost asperity ruptured from bottom to top, with a maximum slip exceeding 10 m, accompanied by a surge in the energy release rate of the earthquake (Fig. 5M and figs. S12 and S13). On the eastern segment, there is a shallower asperity above 10-km depth, with a seismic moment equivalent to an Mw 7.0 earthquake. This is consistent with the primary features of the rupture along this segment identified through potency-density tensor inversion results by Okuwaki et al. (). In the inversion without swarm fault, early slow rupture and delayed asperity rupture were still observed, suggesting the stability of these phenomena (fig. S14). To evaluate the necessity of including swarm fault in the rupture modeling, we compared the two-fault and three-fault models. We found that the three-fault model shows a better SAR data fitting in the swarm fault region (within the black rectangle in Fig. 4C), with the root mean square (RMS) misfit decreased from 14.5 to 12.9 cm, an 11% reduction. This indicates that the swarm fault might have slipped aseismically, eluding detection by seismic data. This provides further evidence for the involvement of earthquake swarm–related fault in the rupture of the 2024 Noto earthquake.
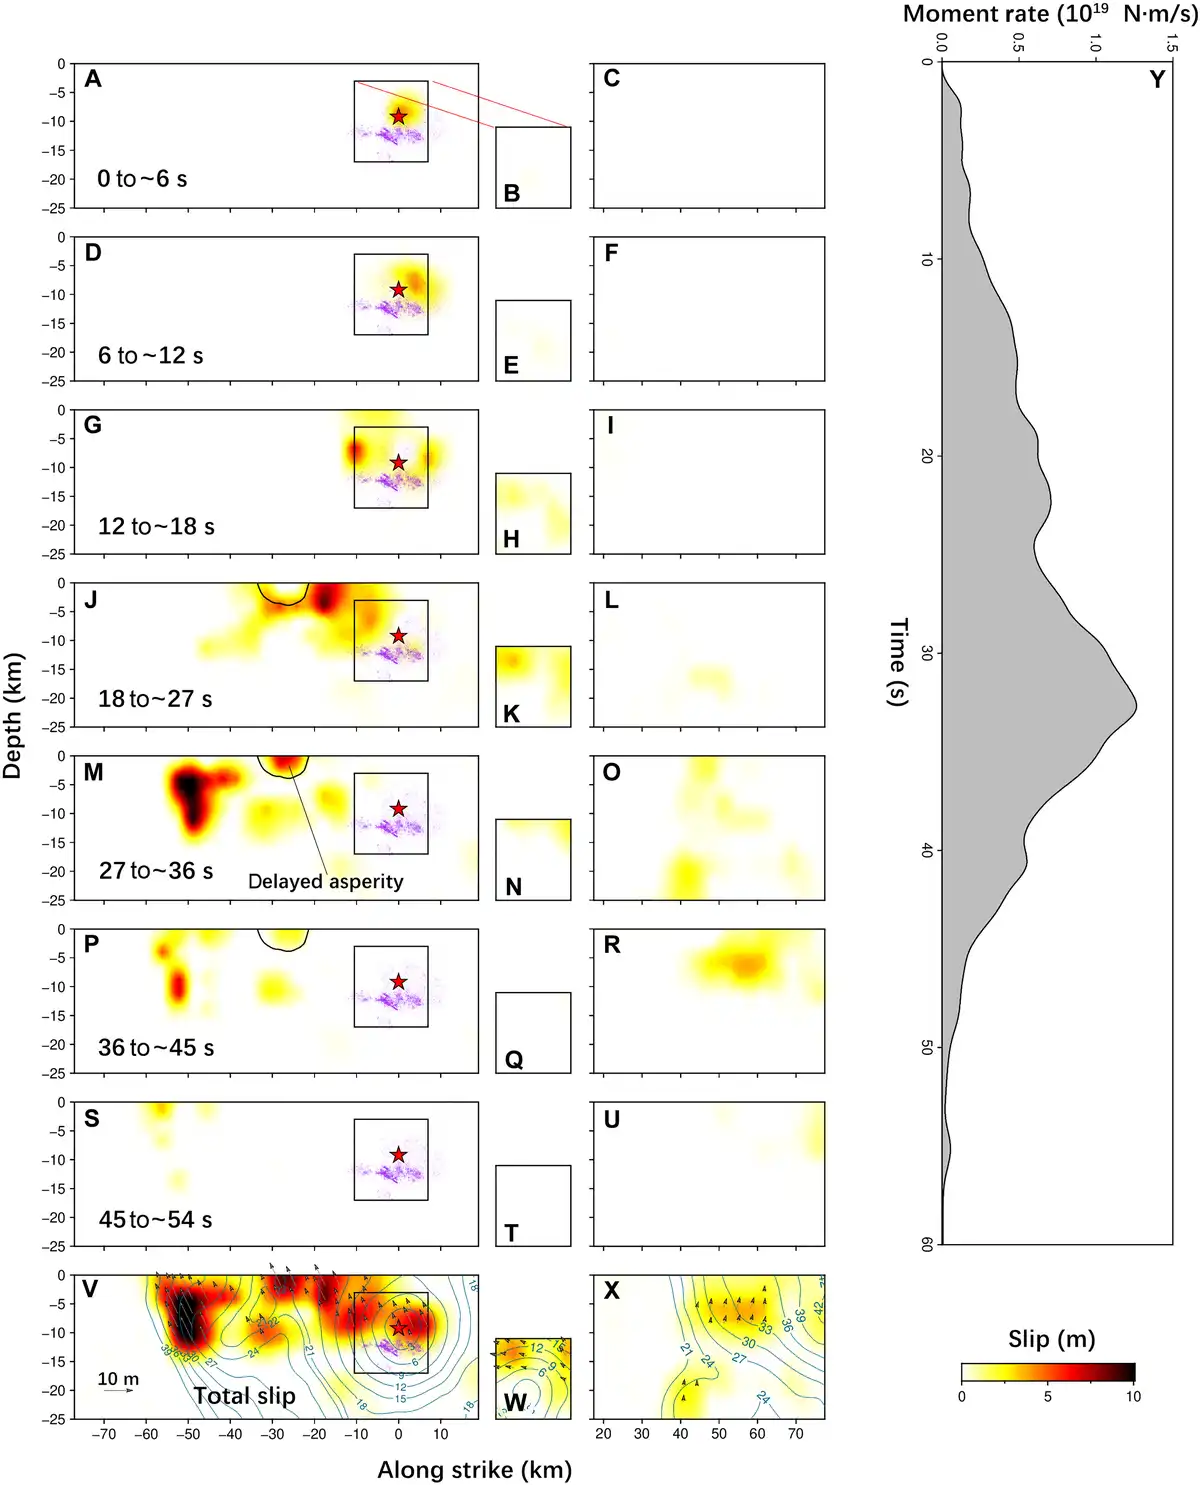
Fig. 5
Finite fault inversion results based on SAR, GNSS, SM, and teleseismic data.
Snapshots of the rupture process at 6-s intervals are shown in (A) to (I) and at 9-s intervals in (J) to (U). [(A), (D), (G), (J), (M), (P), (S), and (V)] The SE-dipping fault of the southwest segment, where the black square on the main fault represents the position of the swarm fault projected onto the main fault in map view. [(B), (E), (H), (K), (N), (Q), (T), and (W)] The SE-dipping swarm fault within the 2020–2023 swarm activity, and [(C), (F), (I), (L), (O), (R), (U), and (X)] the NW-dipping fault of the northeast segment. (V to X) Total slip, and arrows show slip direction. The blue lines represent the rupture time contours. [(J), (M), and (P)] Black line outlines the position of the asperity with delayed rupture. Purple dots represent the 2020–2023 earthquake swarm. (Y) The moment rate function.
DISCUSSION
The role of complex swarm faults in initial rupture and aftershock activity
Preexisting complex swarm faults played an important role in the initial slow rupture and post–earthquake aftershock activity. Including the swarm fault in the inversion reduced the SAR data RMS misfit by 11% and relocated aftershocks align along swarm fault (Fig. 2D). By calculating the stress changes on the swarm fault plane induced by either the early slip or the total slip on the main fault, the results consistently indicate that shear, normal, and Coulomb stress changes in the up-dip portion of the swarm fault promote fault slip. This region experiences a Coulomb stress loading of ~1.5 MPa, with a strong spatial correlation between the slip area and the stress-loaded region (fig. S15). This indicates that the swarm fault might have slipped aseismically. These findings support the involvement of swarm fault in the 2024 Noto earthquake rupture. The inversion of the rupture process, using SAR pixel offsets, GNSS, SM, and teleseismic data, reveals that only the main fault experienced rupture in the first 6 s. Following this, the swarm fault began to slip, with both swarm fault and main fault exhibiting bilateral and up-dip rupturing at a very slow speed (~0.6 km/s). This indicates that the rupture of the main fault likely triggered the rupture of the swarm fault, possibly accompanied by aseismic slip. The earthquake swarm activity since 2020 is notably related to fluid influence, revealing that fluid-weakened faults are highly sensitive to stress perturbations and are easily triggered to slip together by nearby fault ruptures. Earlier research also observed slow initial rupture phase (, , , ). In the swarm region, aftershocks of the 2022 M5.1 and 2023 M6.2 events continued migrating upward along the swarm faults after the mainshock, possibly reflecting pore pressure diffusion (, ). Liu et al. () provided direct evidence of fluid accumulation through initial rupture analyses of four events in the swarm region. The initial rupture point corresponds to the upper edge of the 2020–2023 earthquake swarm, where fluid accumulation occurred, also implying a possible link between earthquake nucleation and fluid triggering. By using the SEBP technique, we identified strong high-frequency radiators in the earthquake swarm area, which is generally associated with fault strength and geometry changes. In the swarm region, we found that slip on the main fault nearly stopped after 18 s, while slip on the swarm fault persisted for almost 36 s. Resolution tests indicate some uncertainty in the rupture duration of the swarm fault (fig. S11), but the pronounced differences suggest a likely presence of this trend. The slip on the swarm fault likely reflects the combined contributions of one or more small faults within the swarm region, and the extended duration may be attributed to fault weakening. Yoshida et al. (), on the basis of aftershock relocation, identified several foreshocks occurring on the swarm faults before the mainshock and suggested that rupture on the swarm faults triggered the rupture of the overlying main fault. We propose that smaller foreshocks may have occurred on the swarm fault, which did not exhibit notable slip. The slip on the main fault could have triggered slip on the swarm faults through dynamic and static stress transfer.
Aftershock relocation revealed that the aftershocks from the 2024 Mw 7.5 Noto earthquake were closely aligned with the preexisting faults in the swarm area (Fig. 2D), indicating rerupture of these structures, further underscoring the swarm fault’s role in the earthquake rupture. According to the earthquake catalog provided by JMA, the Mw 7.5 main shock occurred at 16:10:22, but a M5.9 seismic event occurred 2 km west of the main shock 13 s earlier. Due to the overlap of the P-wave arrivals of the main shock and the wave of M5.9 event at near-field stations (fig. S16), we cannot accurately determine the initial time of the Mw 7.5 event. The contribution of the M5.9 event is included in the rupture process inversion and SEBP, which may also be one reason for the unusually slow initial rupture. The 2024 Mw 7.5 earthquake involved multiple faults during its initial rupture phase, with complex fault geometry, fluid-induced fault weakening, and interactions among multiple faults being crucial factors in the slow rupture observed in the first 18 s.
Delayed rupture behavior of strong asperity
Our finite fault inversion findings indicate a fascinating rupture process involving delayed failure of an asperity during the 2024 Noto earthquake. Before 27 s, the southwestward rupture left a gap measuring 10 km by 5 km, located about 25 km southwest of the epicenter. Between 27 and 36 s, the asperity within this gap experienced a delayed rupture. Initially, the robust asperity notably impeded the slip, causing the rupture to navigate around it from 18 to 27 s after the rupture began. During this time, the strong asperity acted as a barrier, but the slip occurring around it increased stress on the asperity. Eventually, the dynamic and static stress loading overcame the rock strength, resulting in rapid failure of the strong asperity. The delayed rupture of strong asperities can be a secondary source of powerful ground motions, sometimes referred to as compound rupture (). Xu et al. () also found another delayed rupture asperity located 10 km southwest of the epicenter, to the east of the asperity identified in this study. We believe that there may be more than one instance of compound rupture behavior in that heterogeneous area, but the different fault geometries used have varying levels of analytical capability. Numerical simulations have indicated that increasing local fault strength can lead to such delayed ruptures (). This compound model suggests that barriers not only can arrest ruptures but also can create additional sources, which can exacerbate earthquake damage.
We found that the rupture mechanism of the peak-slip asperity at the far western end was a bottom-to-top rupture instead of a lateral rupture in the horizontal direction of propagation (fig. S13). This could again be due to stronger locking at the shallower asperity, with the shallow asperity following along after slip had already occurred below. This can also be referred to as a compound rupture.
Cascading rupture mechanism in complex earthquake swarm region
Elucidating the mechanisms of large cascading ruptures in earthquake swarm regions allows for a better understanding of the large-scale seismic failure of complex fracture networks. Earthquake swarms are often linked to the movement of fluids and/or aseismic slip and are generally characterized by small to moderate earthquakes, with only a few experiencing larger events. For instance, the largest earthquake of the Matsushiro earthquake swarm in central Japan, lasting over 5 years, was a M5.4 event, and the L’Aquila earthquake swarm in Italy had a seismic event of Mw 6.3 (, ). However, earthquakes larger than M7 are rare in earthquake swarm areas. To enhance our understanding of the mechanisms behind this large earthquake, we conducted a comprehensive analysis of fault structures and rupture processes of the 2024 Noto earthquake event. First, both finite fault inversion and SEBP results indicate that the earthquake rupture is mainly divided into two stages. The first phase is largely confined to the 2020–2023 earthquake swarm area, during which the rupture on the main fault triggered the rupture of underlying swarm fault segments. This prolonged slow rupture includes the contribution from the M5.9 foreshock and may also involve the M5.9 foreshock triggering the onset of the Mw 7.5 main shock through dynamic stress. After 18 s, the event transitioned into the second stage. The slow rupture further triggers the main asperity in the southwest direction by stress changes, also triggering another fault in the northeast direction, representing an Mw 7.0 subevent. This forms a typical cascading rupture event involving multiple faults, which is observed in several large earthquakes, such as the 2016 Mw 7.8 Kaikoura Earthquake and the 2021 Mw 7.4 Maduo earthquake (, ). In summary, complex fault structures and inhomogeneous asperities played a crucial role in the extensive cascading rupture of the Mw 7.5 Noto earthquake in 2024.
Characteristics of the 2024 earthquake swarm and its distinct aftershock patterns
We find that the 2024 Mw 7.5 Noto mainshock triggered a small earthquake swarm located 3 km above the 2020–2023 swarm (Fig. 2, B and D). We assumed the receiver fault geometry of the modeled swarm fault and adopted a generic effective coefficient of friction of 0.4 to calculate the stress changes on the swarm fault. Although the normal stress change derived from the mainshock’s slip distribution is compressive, the shear stress loading is relatively high. As a result, the Coulomb stress change indicates that stress loading exceeding 1 MPa occurred at the location of the 2024 swarm (see Materials and Methods and fig. S17), providing direct evidence that the 2024 Noto mainshock statically triggered the small earthquake swarm. This recent swarm began on 1 January 2024 and subsided around 25 January. After 6 January, the number of earthquakes started to decay. Notably, the larger quakes in this swarm did not produce many aftershocks, which is unusual compared to typical earthquake sequences. Until 25 January, the swarm events released energy comparable to an Mw 5.4 earthquake. Figure 2C shows the earthquake frequency in an area of 0.1° × 0.1° within the 2024 swarm region. Two notable events (M4.6 on 7 January and M4.5 on 12 January) occurred during declines in earthquake rate, and the event rate continued to drop afterward. To verify whether larger events do not produce a rich aftershock sequence due to noise levels, station outages, or during times of frequent events, we used the maximum curvature method to calculate the daily changes in the minimum completeness magnitude (Mc) for the 28 days following the Mw 7.5 Noto earthquake in 2024 (). Our findings indicate that, aside from the first 3 days—when a higher number of seismic events during early aftershock activity resulted in a larger Mc—Mc remained relatively stable around M1 for the remainder of the period (figs. S18 and S19). This suggests that the phenomenon of larger seismic events occurring without a rich aftershock sequence is a valid observation. A similar pattern was noted in the 2020–2023 swarm (Fig. 2E), where many events greater than M3.5 also did not lead to numerous aftershocks. Lei et al. () used the epidemic-type aftershock sequence (ETAS) model and found that earthquakes caused by hydraulic fracturing do not produce as many aftershocks as tectonic earthquakes do. This may be due to the absence of preexisting fault damage zones in fluid-induced earthquakes, which are typically found in tectonic events. Consequently, fluid-induced seismic events may not trigger aftershocks in the same way as conventional earthquakes.
MATERIALS AND METHODS
Aftershock relocation
To compile a precise catalog of aftershocks following the 2024 Noto earthquake, seismic data were gathered from 21 broadband stations with an epicentral distance of 100 km. These data were obtained from Hi-net, F-net, and JMA networks operated by the National Research Institute for Earth Science and Disaster Resilience (NIED). The data collection period spanned from 1 to 28 January 2024. The aftershock zone was divided into a western segment beneath the Noto Peninsula with dense station coverage and an eastern segment offshore with less station coverage, primarily concentrated on the landward side in the SE direction. Notably, a station was also positioned on an island to the NW. The seismic waveform data were processed using the PALM code through a two-step procedure (). First, a joint algorithm using STA/LTA and kurtosis was used to identify pairs of P and S arrivals. This involved band-pass filtering continuous waveforms between 1 and 20 Hz, followed by a search for S waves within a 16-s window after the P arrivals. Second, a matched-filter detection technique was applied with a cross-correlation threshold of 0.2. For differential travel time calculation, we used a cross-correlation threshold of 0.3. To ensure accurate association of the same seismic event, a minimum of four stations with an original time deviation of less than 2.0 s and a P travel time residual of less than 1.5 s were required. We adopted the one-dimensional (1D) velocity model by JMA for the analysis (fig. S9).
Slowness-enhanced back projection
Back projection is a method of array processing that relies on the similarity of seismic waveforms within the same array. It can elucidate the kinematic characteristics of rupture, such as rupture direction, velocity, and energy release size, with minimal prior knowledge of fault geometry or rupture velocity. Traditional back projection assumes a uniform velocity structure within the source region, which may lead to errors in cases of large and laterally heterogeneous source regions. To address this limitation, the SEBP method is used, which incorporates spatially varying slowness correction terms derived from aftershock events to better account for the heterogeneous structure and provide more accurate source process information ().
The AU array to the southwest and the NA array to the northeast of the study area were selected because of their good constraints on the rupture process. Teleseismic distances between 30° and 90° were chosen to mitigate the influence of strong depth phases. A total of 121 and 322 broadband seismograms from the AU and NA arrays, obtained from the Incorporated Research Institutions for Seismology (IRIS), were separately analyzed (fig. S20). The Multiple Signal Classification back projection method was applied, aligning P arrivals through band-pass filtering across multiple frequency bands (). Six aftershocks with magnitudes above M4.5 distributed throughout the aftershock zone were selected to evaluate the accuracy of the velocity structure.
We found that the average spatial bias of back projection–inferred locations for the AU and NA arrays, based on a uniform velocity structure, was 11.1 and 12.1 km, respectively. To mitigate spatial bias caused by crustal heterogeneity, slowness correction terms were derived from the spatial bias of the six selected aftershock events (tables S1 and S2). After applying spatially variable slowness corrections across the entire source region, the average spatial bias improved notably to 5.2 km for the AU array and 7.7 km for the NA array (fig. S21). This enhanced accuracy allows for a more detailed understanding of the spatiotemporal evolution process of the earthquake rupture.
SAR pixel offsets and GNSS observations
We used SAR data obtained from the L-band ALOS-2 satellite operated by the Japan Aerospace Exploration Agency. Three pairs of SAR images were processed from ascending tracks 121 and 127, as well as descending track 26, as outlined in table S3. We processed the data to obtain pixel range offset maps of the 2024 Noto earthquake through the pixel offset-tracking (POT) method (). Due to the considerable coseismic deformation causing severe decorrelation, a matching window size of 120 pixels in range and 84 pixels in azimuth was used, with a moving step of 30 × 21 pixels. The POT method was implemented on each of the three consecutive frames, and the resulting frames were combined to create a comprehensive deformation map. To improve efficiency in the finite fault inversion, a quadtree method was used to downsample the deformation field, resulting in 944, 701, and 721 points for inversion ().
Japan maintains a dense GNSS network operated by Geospatial Information Authority of Japan. To study coseismic deformation, 71 stations located within 200 km of the earthquake epicenter were chosen on the basis of data quality and proximity. Data from these stations were collected at 30-s intervals. GNSS data recorded on 1 January 2024, underwent processing using precise point positioning with ambiguity resolution software (). This processing involved using final orbits from the Center for Orbit Determination in Europe, phase clocks reestimated by Wuhan University, and phase bias products, with a cutoff elevation angle of 10°. Thirty-second time series on a single day were generated for the 71 selected stations in the International Terrestrial Reference Frame 2014. Following established methodologies, coseismic displacements were determined by subtracting the average preseismic position from the postseismic position within a 50-min time frame before and after the rupture (fig. S22) (, ).
Local SM and far-field teleseismic data
Japan maintains a closely spaced network of SM stations, known as k-net and kik-net, overseen by NIED. We identified 18 SM stations located within a 150-km radius. These stations, unlike broadband seismometers, do not experience instrument clipping and offer high-frequency sampling rates, enabling detailed examination of rupture processes (, ). For inversion efficiency, acceleration data from SM stations typically need to be integrated twice to derive displacement time series for rupture process inversion. However, SM data often suffer from substantial baseline drift. To mitigate this effect, we applied band-pass filtering in the frequency range of 0.02 to 0.125 Hz. Nevertheless, for some near-field stations with severe baseline drift, integration to displacement may still introduce certain errors, as observed at station ISK001 (fig. S4).
We chose broadband teleseismic waveforms from 48 stations at epicentral distances spanning 30° to 90° sourced from the IRIS database, ensuring a comprehensive azimuthal distribution. Subsequent to the removal of instrument response, the body waves (P and SH waves) were subjected to bandpass filtering with corner frequencies set at 0.005 to 1 Hz, while the surface waves (Rayleigh and Love waves) underwent similar bandpass filtering with corner frequencies ranging from 0.005 to 1 Hz.
Inversion method and model parameters
We used the methodology introduced by Ji et al. () to conduct a joint inversion of SAR pixel offsets, static GNSS, SM, and teleseismic data for the detailed rupture characterization of the 2024 Noto Mw 7.5 earthquake. This approach involves nonlinear inversion techniques to optimize the agreement between observed and simulated data to derive parameters such as slip amplitude, rake, rupture time, and duration for individual subfaults (). The optimization process is carried out using simulated annealing. A source time function was constructed for each subfault using an asymmetric cosine function with eight half-durations of 1.5 s to account for variable rupture velocity and duration. The configuration of fault geometry was determined from the relocated aftershocks. The western segment was defined as centered on the epicenter, extending 98 km along a 58° strike and 35 km along a 45° dip angle, with the upper edge of the fault positioned close to the surface. The eastern segment extends 55 km along a 40° strike and 30 km along a 53° dip angle. To enhance our understanding of the relationship between the initial rupture, the main fault, and the faults associated with the earthquake swarm, we incorporated the swarm fault into the inversion analysis. By analyzing the earthquake swarm from 2020 to 2023, we found that two main fault planes are situated closely together in a vertical alignment, which are both positioned beneath the main fault (Fig. 2D). Accordingly, our inversion uses a single fault plane to represent the contribution of one or more swarm-related faults (Fig. 3A). The fault was discretized into subfaults of dimensions 3.5 km by 3.4 km. For the inversion of the regional data, we adopted the 1D velocity model proposed by JMA and used the frequency–wave number integration method to compute Green’s functions (). The propagator matrix approach was used for teleseismic data to calculate Green’s functions (). Laplacian regularization was applied over the fault plane to ensure the spatiotemporal stability of slip evolution. We set the rupture velocity range to 0.3 to 3.5 km/s, with a reference velocity of 2.5 km/s. We use moment magnitude as the target in the inversion process, automatically searching for an appropriate smoothing parameter that matches the target magnitude. Different observational data have different uncertainties. Given that SH waves have a lower signal-to-noise ratio and greater arrival time errors, we assign P waves a weight twice that of SH waves. The Green’s function of long-period surface waves is more reliable than that of body waves (), so we assign surface waves a weight twice that of P waves. Because near-field data provide higher resolution, we give SAR pixel offsets, horizontal GNSS, and SM data the same weight as surface waves. Vertical GNSS, which is less accurate than horizontal GNSS, is assigned one-quarter the weight of horizontal components (). Thus, the data are weighted as follows: SAR pixel offsets:horizontal GNSS:vertical GNSS:SM:P:SH:Rayleigh:Love = 4:4:1:4:2:1:4:4.
Resolution tests
To assess the resolution capability of the data and model in capturing rupture evolution, we conducted three resolution tests using the aforementioned parameters. First, static data (SAR, GNSS, and static SM offsets) were used to evaluate the ability of the data and model to constrain the static slip distribution (fig. S10). Second, to investigate the resolution capability of the dataset in distinguishing slip on two closely spaced parallel faults (main fault and swarm fault), we performed a resolution test using all available datasets (SAR, GNSS, SM, and teleseismic data). In the synthetic test, two 6.5-m slip asperities were assigned to the main and swarm fault, respectively. The asperity on the main fault ruptured between 5 and 11 s, while the asperity on the swarm fault ruptured between 13 and 17 s. In the inversion, we imposed two separate nucleation points on the main fault and the swarm fault. This test aimed to evaluate the ability of the data and model to resolve the sequential rupture of the two faults (fig. S11). Third, to evaluate the necessity of including a swarm fault in the rupture inversion, we performed an additional rupture inversion excluding the swarm fault while using the same dataset as the three-fault inversion (SAR, GNSS, SM, and teleseismic data) (fig. S14).
Stress change calculation
We calculated the shear stress, normal stress, and Coulomb stress changes on the swarm fault using the slip distribution on the main fault to evaluate the triggering effect of the rupture on the swarm fault. The stress changes of each subfault were computed at its center to evaluate the distribution of stress changes encouraging slip in the coseismic slip direction. Snapshots of the rupture process indicate that notable slip on the swarm fault occurred after 18 s (Fig. 5). Therefore, we estimated the stress changes imparted to the swarm fault by the slip on the main fault within the first 18 s. To further assess whether the stress changes remained encouraging and comparably high after the rupture had completed, we also calculated the stress changes on the swarm fault induced by the total slip on the main fault. The rake angle of each subfault was set according to its coseismic slip vector (strike, 51; dip, 38; and rake, 120). We assume an effective coefficient of friction of 0.4. The results consistently reveal a relatively high Coulomb stress loading in the up-dip direction of the swarm fault (fig. S15).
To assess the triggering effect of the 2024 Noto mainshock on the 2024 earthquake swarm, we calculated shear stress, normal stress, and Coulomb stress changes induced by the mainshock slip. As shown in Fig. 2D, the triggered swarm events are primarily concentrated at depth of 13 km. Therefore, we computed stress changes at depth of 13 km using the slip distributions of the three faults. Given the proximity of the 2024 earthquake swarm to the swarm fault and the possibility of rupture on a smaller fault within the swarm fault, the receiver fault was set with the swarm fault parameters (strike, 51°; dip, 38°; rake, 120°) and adopted a generic effective coefficient of friction of 0.4. The results indicate that the 2024 earthquake swarm at depths of 13 km is located within the Coulomb stress loading region (fig. S17).
Acknowledgments
We thank D. Goldberg and D. Zhao for early discussion on this manuscript.
Funding: This research was supported by National Natural Science Foundation of China (42388102, 42174023, and 42304037), National Key Research and Development Program (2022YFB3903602), Natural Science Foundation of Hunan Province (2024JJ3031), the Frontier Cross Research Project of Central South University (2023QYJC006), and the Fundamental Research Funds for Central Universities of Central South University (2024ZZTS0057).
Author contributions: Conceptualization: C.H., W.X., R.B., and Y.A. Methodology: C.H., W.X., L.X., G.F., B.S., Z.L., Y.Z., and J.Z. Software: C.H. Validation: C.H., W.X., G.F., and Y.A. Formal analysis: C.H., W.X., and X.L. Investigation: C.H., W.X., and Y.A. Resources: W.X. and G.F. Data curation: C.H., W.X., and Y.A. Writing—original draft: C.H., W.X., and G.F. Writing—review and editing: C.H., W.X., R.B., L.X., G.F., Z.L., Y.A., Y.Z., J.Z., and X.L. Visualization: C.H. Supervision: W.X. and Y.A. Project administration: C.H. and W.X. Funding acquisition: C.H. and W.X.
Competing interests: The authors declare that they have no competing interests.
Data and materials availability: All data needed to evaluate the conclusions in the paper are present in the paper and/or the Supplementary Materials. All teleseismic data used for finite-fault inversion and back projection were downloaded through the IRIS Wilber 3 system (https://ds.iris.edu/wilber3/find_stations/11786236). The local SM data were downloaded from the National Research Institute for Earth Science and Disaster Resilience (www.kyoshin.bosai.go.jp/kyoshin/search/index_en.html). GNSS data are from Geospatial Information Authority of Japan (https://terras.gsi.go.jp/data_service.php) and Nevada Geodetic Laboratory (https://geodesy.unr.edu/NGLStationPages/gpsnetmap/GPSNetMap.html). The ALOS-2 SAR data form the Japan Aerospace Exploration Agency (www.eorc.jaxa.jp/ALOS/jp/dataset/alos_open_and_free_j.htm). Broadband seismic waveforms are from the National Research Institute for Earth Science and Disaster Resilience (www.hinet.bosai.go.jp/farfield/ffmap.php?_index=202401010710090_7.5&LANG=en). The 1D velocity model is from the Japan Meteorological Agency (www.data.jma.go.jp/eqev/data/bulletin/catalog/appendix/trtime/trt_j.html). The results of the 2024 Noto Mw 7.5 earthquake in this study (including the kinematic slip model, SEBP results, and aftershock relocation) and the raw data (SM and GNSS data) are available at Zenodo (https://doi.org/10.5281/zenodo.15227417).
REFERENCES AND NOTES
- 1. T. Ishiyama, H. Sato, N. Kato, S. Koshiya, S. Abe, K. Shiraishi, M. Matsubara, Structures and active tectonics of compressionally reactivated back-arc failed rift across the Toyama trough in the Sea of Japan, revealed by multiscale seismic profiling. Tectonophysics 710-711, 21–36 (2017).
- 2. Y. Ishikawa, L. Bai, The 2024 Mj 7.6 Noto Peninsula, Japan earthquake caused by the fluid flow in the crust. Earthq. Res. Adv. 4, 100292 (2024).
- 3. Y. Okamura, K. Satake, K. Ikehara, A. Takeuchi, K. Arai, Paleoseismology of deep-sea faults based on marine surveys of northern Okushiri ridge in the Japan Sea. J. Geophys. Res. 110, B09105 (2005).
- 4. K. Yoshida, M. Uno, T. Matsuzawa, Y. Yukutake, Y. Mukuhira, H. Sato, T. Yoshida, Upward earthquake swarm migration in the northeastern Noto Peninsula, Japan, initiated from a deep ring-shaped cluster: Possibility of fluid leakage from a hidden magma system. J. Geophys. Res. Solid Earth 128, e2022JB026047 (2023).
- 5. K. Yoshida, N. Uchida, Y. Matsumoto, M. Orimo, T. Okada, S. Hirahara, S. Kimura, R. Hino, Updip fluid flow in the crust of the northeastern Noto Peninsula, Japan, triggered the 2023 Mw 6.2 Suzu earthquake during swarm activity. Geophys. Res. Lett. 50, e2023GL106023 (2023).
- 6. T. Nishimura, Y. Hiramatsu, Y. Ohta, Episodic transient deformation revealed by the analysis of multiple GNSS networks in the Noto Peninsula, central Japan. Sci. Rep. 13, 8381 (2023).
- 7. R. Okuwaki, Y. Yagi, A. Murakami, Y. Fukahata, A multiplex rupture sequence under complex fault network due to preceding earthquake swarms during the 2024 Mw 7.5 Noto Peninsula, Japan, Earthquake. Geophys. Res. Lett. 51, e2024GL109224 (2024).
- 8. National Institute of Advanced Industrial Science and Technology, Active Fault Database of Japan (2012), https://gbank.gsj.jp/activefault/index_e_gmap.html.
- 9. Z. Ma, H. Zeng, H. Luo, Z. Liu, Y. Jiang, Y. Aoki, W. Wang, Y. Itoh, M. Lyu, Y. Cui, S.-H. Yun, E. M. Hill, S. Wei, Slow rupture in a fluid-rich fault zone initiated the 2024 Mw 7.5 Noto earthquake. Science 385, 866–871 (2024).
- 10. L. Xu, C. Ji, L. Meng, J.-P. Ampuero, Z. Yunjun, S. Mohanna, Y. Aoki, Dual-initiation ruptures in the 2024 Noto earthquake encircling a fault asperity at a swarm edge. Science 385, 871–876 (2024).
- 11. K. Yoshida, R. Takagi, Y. Fukushima, R. Ando, Y. Ohta, Y. Hiramatsu, Role of a hidden fault in the early process of the 2024 Mw7.5 Noto Peninsula earthquake. Geophys. Res. Lett. 51, e2024GL110993 (2024).
- 12. S. Y. Yang, C. F. Sang, Y. Hu, K. Wang, Coseismic and early postseismic deformation of the 2024 Mw7.45 Noto Peninsula Earthquake. Geophys. Res. Lett. 51, e2024GL108843 (2024).
- 13. Y. Fujii, K. Satake, Slip distribution of the 2024 Noto Peninsula earthquake (MJMA 7.6) estimated from tsunami waveforms and GNSS data. Earth Planets Space 76, 44 (2024).
- 14. C. Liu, Y. Bai, T. Lay, P. He, Y. Wen, X. Wei, N. Xiong, X. Xiong, Shallow crustal rupture in a major MW 7.5 earthquake above a deep crustal seismic swarm along the Noto Peninsula in western Japan. Earth Planet. Sci. Lett. 648, 119107 (2024).
- 15. D. R. Shelly, Examining the connections between earthquake swarms, crustal fluids, and large earthquakes in the context of the 2020–2024 Noto Peninsula, Japan, Earthquake sequence. Geophys. Res. Lett. 51, e2023GL107897 (2024).
- 16. A. Kato, Implications of fault-valve behavior from immediate aftershocks following the 2023 Mj6.5 earthquake beneath the Noto Peninsula, Central Japan. Geophys. Res. Lett. 51, e2023GL106444 (2024).
- 17. Y. Amezawa, Y. Hiramatsu, A. Miyakawa, K. Imanishi, M. Otsubo, Long-living earthquake swarm and intermittent seismicity in the northeastern tip of the Noto Peninsula, Japan. Geophys. Res. Lett. 50, e2022GL102670 (2023).
- 18. J. D. Bedford, D. R. Faulkner, M. J. Allen, T. Hirose, The stabilizing effect of high pore-fluid pressure along subduction megathrust faults: Evidence from friction experiments on accretionary sediments from the Nankai Trough. Earth Planet. Sci. Lett. 574, 117161 (2021).
- 19. F. Cappa, M. M. Scuderi, C. Collettini, Y. Guglielmi, J.-P. Avouac, Stabilization of fault slip by fluid injection in the laboratory and in situ. Sci. Adv. 5, eaau4065 (2019).
- 20. F. Wang, S. S. Wei, C. Drooff, J. L. Elliott, J. T. Freymueller, N. A. Ruppert, H. Zhang, Fluids control along-strike variations in the Alaska megathrust slip. Earth Planet. Sci. Lett. 633, 118655 (2024).
- 21. F. Waldhauser, W. L. Ellsworth, A double-difference earthquake location algorithm: Method and application to the northern Hayward fault, California. Bull. Seismol. Soc. Am. 90, 1353–1368 (2000).
- 22. Y. Zhou, H. Yue, L. Fang, S. Zhou, L. Zhao, A. Ghosh, An earthquake detection and location architecture for continuous seismograms: Phase picking, association, location, and matched filter (PALM). Seismol. Res. Lett. 93, 413–425 (2022).
- 23. L. Meng, A. Zhang, Y. Yagi, Improving back projection imaging with a novel physics-based aftershock calibration approach: A case study of the 2015 Gorkha earthquake. Geophys. Res. Lett. 43, 628–636 (2016).
- 24. T. Sagiya, A decade of GEONET: 1994–2003 —The continuous GPS observation in Japan and its impact on earthquake studies—. Earth Planets Space 56, Xxix-Xli (2004).
- 25. G. Zhang, M. Vallée, X. Shan, B. Delouis, Evidence of sudden rupture of a large asperity during the 2008 Mw7.9 Wenchuan earthquake based on strong motion analysis. Geophys. Res. Lett. 39, L17303 (2012).
- 26. H. Zhang, X. Chen, Dynamic rupture on a planar fault in three-dimensional half-space – II. Validations and numerical experiments. Geophys. J. Int. 167, 917–932 (2006).
- 27. F. Cappa, J. Rutqvist, K. Yamamoto, Modeling crustal deformation and rupture processes related to upwelling of deep CO2-rich fluids during the 1965–1967 Matsushiro earthquake swarm in Japan. J. Geophys. Res. Solid Earth 114, B10304 (2009).
- 28. F. Di Luccio, G. Ventura, R. Di Giovambattista, A. Piscini, F. R. Cinti, Normal faults and thrusts reactivated by deep fluids: The 6 April 2009 Mw 6.3 L’Aquila earthquake, central Italy. J. Geophys. Res. Solid Earth 118, 5596 (2013).
- 29. W. Xu, G. Feng, L. Meng, A. Zhang, J. P. Ampuero, R. Bürgmann, L. Fang, Transpressional rupture cascade of the 2016 Mw 7.8 Kaikoura Earthquake, New Zealand. J. Geophys. Res. Solid Earth 123, 2396–2409 (2018).
- 30. H. Yue, Z.-K. Shen, Z. Zhao, T. Wang, B. Cao, Z. Li, X. Bao, L. Zhao, X. Song, Z. Ge, C. Ren, W. Lu, Y. Zhang, J. Liu-Zeng, M. Wang, Q. Huang, S. Zhou, L. Xue, Rupture process of the 2021 M7.4 Maduo earthquake and implication for deformation mode of the Songpan-Ganzi terrane in Tibetan Plateau. Proc. Natl. Acad. Sci. U.S.A. 119, e2116445119 (2022).
- 31. S. Wiemer, M. Wyss, Minimum magnitude of completeness in earthquake catalogs: Examples from Alaska, the western United States, and Japan. Bull. Seismol. Soc. Am. 90, 859–869 (2000).
- 32. X. Lei, D. Huang, J. Su, G. Jiang, X. Wang, H. Wang, X. Guo, H. Fu, Fault reactivation and earthquakes with magnitudes of up to Mw4.7 induced by shale-gas hydraulic fracturing in Sichuan Basin, China. Sci. Rep. 7, 7971 (2017).
- 33. L. Meng, A. Inbal, J.-P. Ampuero, A window into the complexity of the dynamic rupture of the 2011 Mw 9 Tohoku-Oki earthquake. Geophys. Res. Lett. 38, L00G07 (2011).
- 34. R. Michel, J.-P. Avouac, J. Taboury, Measuring near field coseismic displacements from SAR images: Application to the Landers earthquake. Geophys. Res. Lett. 26, 3017–3020 (1999).
- 35. H. Gao, M. Liao, G. Feng, An improved quadtree sampling method for InSAR seismic deformation inversion. Remote Sens 13, 1678 (2021).
- 36. J. Geng, X. Chen, Y. Pan, S. Mao, C. Li, J. Zhou, K. Zhang, PRIDE PPP-AR: An open-source software for GPS PPP ambiguity resolution. GPS Solut. 23, 91 (2019).
- 37. C. Huang, C. Xie, G. Zhang, W. Wang, M.-C. Tsai, J.-C. Hu, Revealing the kinematic characteristics and tectonic implications of a buried fault through the joint inversion of GPS and strong-motion data: The case of the 2022 Mw7.0 Taiwan earthquake. Remote Sens 15, 4868 (2023).
- 38. H. Liu, L. Xie, G. Zhao, E. Ali, W. Xu, A joint InSAR-GNSS workflow for correction and selection of interferograms to estimate high-resolution interseismic deformations. Satell. Navig. 4, 14 (2023).
- 39. C. Huang, G. Zhang, D. Zhao, X. Shan, C. Xie, H. Tu, C. Qu, C. Zhu, N. Han, J. Chen, Rupture process of the 2022 Mw6.6 Menyuan, China, earthquake from joint inversion of accelerogram data and InSAR measurements. Remote Sens. 14, 5104 (2022).
- 40. C. Ji, D. J. Wald, D. V. Helmberger, Source description of the 1999 Hector Mine, California, earthquake, part I: Wavelet domain inversion theory and resolution analysis. Bull. Seismol. Soc. Am. 92, 1192–1207 (2002).
- 41. D. E. Goldberg, P. Koch, D. Melgar, S. Riquelme, W. L. Yeck, Beyond the teleseism: Introducing regional seismic and geodetic data into routine USGS finite-fault modeling. Seismol. Res. Lett. 93, 3308–3323 (2022).
- 42. L. Zhu, L. A. Rivera, A note on the dynamic and static displacements from a point source in multilayered media. Geophys. J. Int. 148, 619–627 (2002).
- 43. M. Kikuchi, H. Kanamori, Inversion of complex body waves. Bull. Seismol. Soc. Am. 72, 491–506 (1982).
- 44. G. Shao, X. Li, C. Ji, T. Maeda, Focal mechanism and slip history of the 2011 Mw 9.1 off the Pacific coast of Tohoku Earthquake, constrained with teleseismic body and surface waves. Earth Planets Space 63, 559–564 (2011).
- 45. Y. Bock, D. Melgar, B. W. Crowell, Real-time strong-motion broadband displacements from collocated GPS and accelerometers. Bull. Seismol. Soc. Am. 101, 2904–2925 (2011).