Highlight box
Key findings
• Cardiometabolic index (CMI) is positively associated with the incidence of overactive bladder (OAB) in U.S. adults, and CMI may be a predictor of OAB occurrence, according to data from the National Health and Nutrition Examination Survey 2017–2020.
What is known and what is new?
• OAB is a prevalent urinary disorder that significantly impacts quality of life, leading to economic losses and increased medical costs. The CMI is a novel marker of visceral obesity and dyslipidemia. Previous studies have pointed out that OAB is related to lipid metabolism.
• Higher CMI scores are significantly associated with an increased risk of OAB in a representative US cohort.
What is the implication, and what should change now?
• Clinicians ought to recognize CMI as a potential predictor of OAB. Additional research can be carried out to validate the predictive value of CMI for OAB and investigate the feasibility of integrating CMI into routine health evaluations. In the future, large-scale prospective studies can be conducted to comprehensively explore the association between CMI and OAB, and it is anticipated that more profound research can be carried out in the future to elucidate the biological correlation between CMI and OAB.
Introduction
In 2002, the International Continence Society (ICS) defined overactive bladder (OAB) as a storage symptom characterized by “urgency, with or without urgency urinary incontinence (UUI), usually accompanied by increased daytime urinary frequency and nocturia” (). OAB represents a global public health challenge as a chronic functional bladder disorder that significantly impairs patients’ physical health and quality of life (). In addition, OAB imposes substantial economic burdens on both individuals and society. A previous study has shown that OAB patients in the United States incur healthcare costs of more than 2.5 times higher than those without OAB (). However, the specific pathophysiological mechanisms underlying OAB remain unclear. Emerging evidence suggests that OAB may be associated with obesity, alcohol consumption, diabetes, nutritional status, and lifestyle factors (). We present this article in accordance with the TRIPOD reporting checklist (available at https://tau.amegroups.com/article/view/10.21037/tau-2025-304/rc).
Methods
Data source and study population
The National Health and Nutrition Examination Survey (NHANES) is a program of surveys designed and administered by the National Center for Health Statistics (NCHS) to collect health-related data from the civilian, non-institutionalized population in the U.S. Informed consent was secured from all participants for these surveys, and ethical clearance was granted by the institutional review board of the NCHS. The research employed standardized interviews, physical examinations, and laboratory assessments to gather data on the present health status of the U.S. population. All data are publicly available on the NHANES website (https://www.cdc.gov/nchs/nhanes/). This study was conducted in accordance with the Declaration of Helsinki and its subsequent amendments.
Selection criteria for study population
This retrospective study utilized data from the 2017–2020 NHANES cycles. From 2017 to 2020, a total of 15,560 individuals participated in the study, with 13,829 being excluded for the reasons outlined below: (I) missing data for cardiometabolic index (CMI) assessment (n=6,528); (II) missing data for OAB evaluation (n=7,264); and (III) incomplete covariate data, including educational level, marital status, pregnancy status, hypertension, cholesterol levels, sleep disorders, coronary heart disease, smoking and alcohol consumption, physical activity, family poverty-to-income ratio (PIR), cotinine, blood urea nitrogen (BUN), creatinine, and uric acid (n=28). After applying these exclusion criteria, a total of 1,740 participants were included in the final analysis (Figure 1).
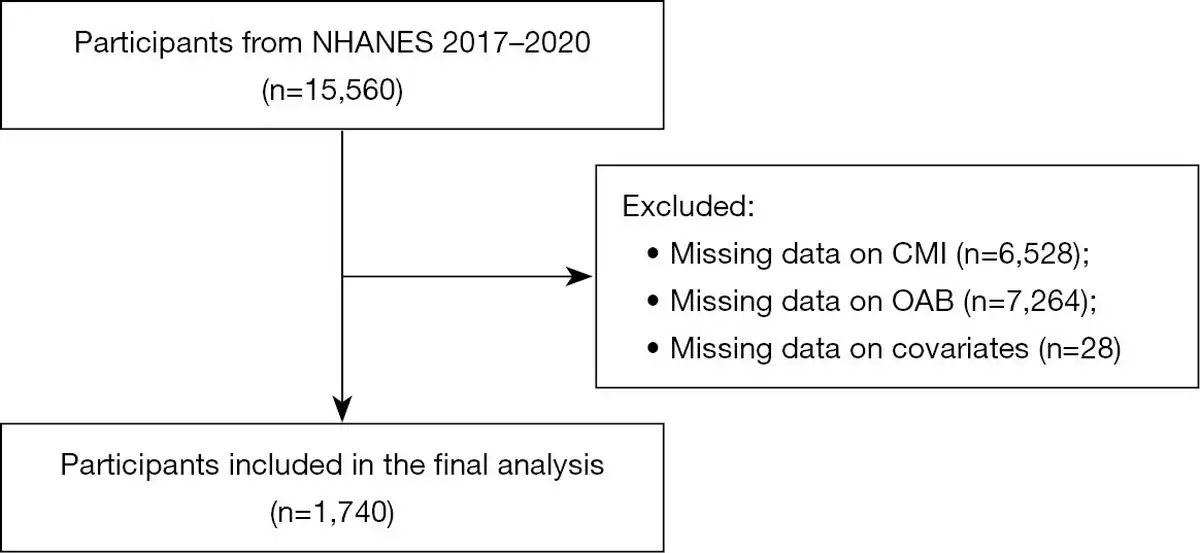
Figure 1
Flow chart for inclusion of participants in this study. CMI, cardiometabolic index; NHANES, National Health and Nutrition Examination Survey; OAB, overactive bladder.
Assessment of CMI and other indicators
CMI is the exposure variable in our study, calculated using the following formula:
Other indicators included in this study were calculated using the following formula:
Assessment of OAB symptoms
OAB served as the primary outcome variable in this study. The medical history of OAB, encompassing urge urinary incontinence and nocturia, was assessed using the Kidney Disease-Urology Questionnaire completed by the participants. The question utilized to evaluate urge urinary incontinence was: “In the past 12 months, has the standardized patient (SP) leaked or lost control of a small amount of urine due to urgency or stress and been unable to reach the toilet promptly?”. For those SPs who responded affirmatively, an additional inquiry was posed: “How frequently did this situation occur?”. The severity of nocturia was gauged based on the question: “Over the past 30 days, from the time you went to bed at night to the time you got up in the morning, how often did you need to get out of bed to urinate?”.
We then quantified OAB using the modified shortened Overactive Bladder Symptom Score (OABSS) questionnaire developed by Blaivas and his colleagues (). We then calculated the OABSS for each subject by summing the scores for urge incontinence and nocturia. In this study, we classified participants with a total score of ≥3 as having OAB. Subsequently, we categorized those with OAB into the OAB group, while the rest were grouped into the non-OAB group.
Other covariates
Other covariates included gender, age, ethnicity, family PIR, education level, and marital status, hypertension, sleep disorders, coronary heart disease, smoking status, alcohol consumption, the intensity of work-related activities, recreational activities of varying intensities, cotinine levels, BUN, creatinine, and uric acid.
Statistical analysis
To enhance the precision of our data analysis, we employed weighted analytical methods in strict accordance with the guidelines set forth by the NHANES. This approach effectively mitigates the biases inherent in the intricate multi-stage sampling protocol characteristic of NHANES studies. The Shapiro-Wilk test was employed to assess the normality of continuous variable distributions. Normally distributed continuous variables were represented by the mean ± standard deviation (SD), whereas non-normally distributed continuous variables were characterized by median and interquartile range (IQR). Categorical variables were analyzed using Chi-squared tests to determine statistical differences. For between-group comparisons, weighted Student’s t-tests were performed for continuous variables. Univariate and multivariate logistic regression models were employed to assess the adjusted odds ratios (ORs) and 95% confidence intervals (CIs) of variables related to the prevalence of OAB.
In our investigation of the association between CMI and OAB, we constructed weighted multivariable regression models across three distinct models to account for varying degrees of covariate adjustment. Model 1 was unadjusted, providing a baseline assessment of the relationship. Model 2 integrated a comprehensive set of covariates, encompassing age, gender, race, education level, family PIR, pregnancy status, and marital status, to control for potential confounding factors. Model 3 further refined our analysis by including an extended list of variables: age, gender, race, education level, family PIR, pregnancy status, marital status, hypertension, sleep disorders, coronary heart disease, smoking status, alcohol consumption, the intensity of work-related activities, recreational activities of varying intensities, cotinine levels, BUN, creatinine, and uric acid.
To address the potential nonlinearity in the data, we employed smooth curve fitting techniques to model the relationships more accurately. When nonlinear associations were detected, we applied piecewise regression models to each identified interval, allowing for a more nuanced understanding of the data. The threshold effects were subsequently quantified, providing insights into the critical points at which changes in CMI significantly impact the likelihood of OAB. The breakpoint (K) that delineates the segments of our piecewise regression models was determined through a two-step recursive method. This method is grounded in the principle of maximizing the likelihood function, ensuring that our model selections are statistically optimal. To systematically compare the predictive performance of anthropometric indicators for OAB incidence, we included the CMI and five widely used metabolic-related indicators [body mass index (BMI), visceral adiposity index (VAI), weight-adjusted waist index (WWI), triglyceride glucose index (TyG), and lipid accumulation product (LAP)] for a comprehensive receiver operating characteristic (ROC)-based analysis.
All data were analyzed by R (version 4.2.3) and SPSS software (version 26.0), and P<0.05 was used as the standard of statistically significant difference for all statistical analyses.
Results
Basic characteristics of participants
In this study, 1,740 adults were included according to the inclusion and exclusion criteria, and the mean age of the participants was 52.62±16.45 years. Among these participants, 8.70% were male, 91.30% were female, 70.69% were non-Hispanic white, 7.38% were non-Hispanic black, 7.78% were Mexican American, 6.12% were other Hispanic, and 8.03% were from other races. In this study group, 1,139 respondents (65.46%) had OAB symptoms, and 601 respondents (34.54%) had no OAB symptoms. The average concentrations of cotinine, BUN, creatinine, and uric acid were 48.92±117.82 ng/mL, 5.37±2.05 mmol/L, 70.22±22.07 µmol/L, and 294.18±80.22 µmol/L. Participants with OAB were significantly more likely to be older (P<0.001), possess higher levels of education (P<0.001), and be married or cohabiting (P<0.001). Additionally, they exhibited lower family PIR (P<0.001), a lower prevalence of hypertension (P<0.001), no sleep disorders (P<0.001), and no coronary heart disease (P=0.03). Furthermore, OAB patients reported alcohol consumption of less than once a week (P=0.002) and were more engaged in moderate to heavy recreational activities (P<0.001). Furthermore, concentrations of BUN, creatinine, and uric acid were significantly elevated in individuals with OAB compared to those without OAB symptoms (P<0.001). Detailed information is presented in Table 1.
Table 1
Basic characteristics of participants
| Characteristics | All (n=1,740) | Non-OAB (n=601) | OAB (n=1,139) | P value |
|---|---|---|---|---|
| Age (years) | 52.62±16.45 | 47.04±15.54 | 56.31±16.00 | <0.001 |
| Gender | 0.10 | |||
| Male | 8.70 | 7.35 | 9.59 | |
| Female | 91.30 | 92.65 | 90.41 | |
| Race | 0.27 | |||
| Mexican American | 7.78 | 8.19 | 7.51 | |
| Other Hispanic | 6.12 | 5.09 | 6.79 | |
| Non-Hispanic White | 70.69 | 71.71 | 70.02 | |
| Non-Hispanic Black | 7.38 | 6.23 | 8.14 | |
| Other races | 8.03 | 8.77 | 7.54 | |
| Education level | <0.001 | |||
| Lower than 12th grade | 10.38 | 7.46 | 12.31 | |
| High school grade | 26.63 | 24.03 | 28.34 | |
| College grade | 62.99 | 68.50 | 59.35 | |
| Marital status | <0.001 | |||
| Married/living with partner | 62.99 | 67.06 | 60.31 | |
| Widowed/divorced/separated | 25.02 | 17.76 | 29.82 | |
| Never married | 11.98 | 15.18 | 9.88 | |
| Pregnancy status | 0.90 | |||
| Yes | 5.42 | 5.34 | 5.48 | |
| No | 94.58 | 94.66 | 94.52 | |
| Family PIR | 3.04±1.60 | 3.28±1.57 | 2.87±1.60 | <0.001 |
| Hypertension | <0.001 | |||
| Yes | 39.41 | 29.74 | 45.80 | |
| No | 60.59 | 70.26 | 54.20 | |
| Sleep disorders | <0.001 | |||
| Yes | 40.30 | 33.35 | 44.89 | |
| No | 59.70 | 66.65 | 55.11 | |
| Coronary heart disease | 0.03 | |||
| Yes | 4.65 | 3.32 | 5.53 | |
| No | 95.35 | 96.68 | 94.47 | |
| Smoking status | 0.58 | |||
| Every day | 28.30 | 28.52 | 28.16 | |
| Some days | 8.63 | 9.43 | 8.09 | |
| Not at all | 63.07 | 62.05 | 63.75 | |
| Alcohol consumption | 0.002 | |||
| Once weekly or more | 31.64 | 36.01 | 28.76 | |
| Less than once weekly | 68.36 | 63.99 | 71.24 | |
| Vigorous work activity | 0.17 | |||
| Yes | 21.32 | 22.97 | 20.22 | |
| No | 78.68 | 77.03 | 79.78 | |
| Moderate work activity | 0.95 | |||
| Yes | 48.67 | 48.59 | 48.73 | |
| No | 51.33 | 51.41 | 51.27 | |
| Vigorous recreational activities | <0.001 | |||
| Yes | 21.17 | 27.39 | 17.07 | |
| No | 78.83 | 72.61 | 82.93 | |
| Moderate recreational activities | <0.001 | |||
| Yes | 44.55 | 51.13 | 40.21 | |
| No | 55.45 | 48.87 | 59.79 | |
| Cotinine (ng/mL) | 48.92±117.82 | 50.45±127.51 | 47.91±110.95 | 0.66 |
| BUN (mmol/L) | 5.37±2.05 | 5.00±1.57 | 5.61±2.28 | <0.001 |
| Creatinine (μmol/L) | 70.22±22.07 | 67.53±14.90 | 72.00±25.58 | <0.001 |
| Uric acid (μmol/L) | 294.18±80.22 | 280.63±67.86 | 303.13±86.27 | <0.001 |
Associations between CMI and OAB
In our study, we employed multivariate logistic regression analysis to investigate the association between CMI and OAB. After adjusting for potential confounders across three models, we found a positive association between CMI and OAB in all three models (Model 1: OR =1.41; 95% CI: 1.20–1.65; P<0.001; Model 2: OR =1.34; 95% CI: 1.14–1.57; P<0.001; Model 3: OR =1.25; 95% CI: 1.06–1.47; P=0.008), as shown in Table 2. The detailed covariates included in these models were shown in Table S1. Especially, in the comprehensively adjusted Model 3, the OR was 1.25 (95% CI: 1.06–1.47), which signifies a 25% increase in OAB odds for each unit increase in CMI. This positive correlation was further corroborated by the quartile analysis of CMI, where a significant trend was identified (P for trend =0.01). The association was most pronounced in the highest quartile (Q4), with an OR of 1.38 (95% CI: 1.00–1.91; P=0.053), indicating an increased odds of OAB in this group.
Table 2
Weighted regression models and trend tests elucidating the association between CMI and OAB
| Exposure | Model 1 | Model 2 | Model 3 | |||||
|---|---|---|---|---|---|---|---|---|
| β (95% CI) | P value | β (95% CI) | P value | β (95% CI) | P value | |||
| CMI value (per 1 unit increase) | 1.41 (1.20, 1.65) | <0.001 | 1.34 (1.14, 1.57) | <0.001 | 1.25 (1.06, 1.47) | 0.008 | ||
| Quartiles of CMI | ||||||||
| Q1 | Reference | Reference | Reference | |||||
| Q2 | 1.11 (0.85, 1.46) | 0.45 | 0.99 (0.74, 1.32) | 0.95 | 0.93 (0.69, 1.25) | 0.62 | ||
| Q3 | 1.78 (1.35, 2.36) | <0.001 | 1.49 (1.11, 2.01) | 0.009 | 1.34 (0.98, 1.84) | 0.07 | ||
| Q4 | 1.82 (1.38, 2.42) | <0.001 | 1.61 (1.19, 2.18) | 0.002 | 1.38 (1.00, 1.91) | 0.053 | ||
| P for trend | 1.26 (1.15, 1.38) | <0.001 | 1.20 (1.09, 1.32) | <0.001 | 1.14 (1.03, 1.26) | 0.01 | ||
To evaluate whether the correlation between CMI and OAB was non-linear, we conducted a smooth curve fitting analysis. The results confirmed that the prevalence of OAB increased with rising CMI, demonstrating a nonlinear positive correlation between the two, as illustrated in Figure 2. The relationship was further analyzed by piecewise regression (P for log-likelihood ratio =0.50), as shown in Table 3. On the left side of the turning point, the odds of OAB increased by 32% with a one-unit increase in CMI (OR =1.32, 95% CI: 1.05–1.66, P=0.02).
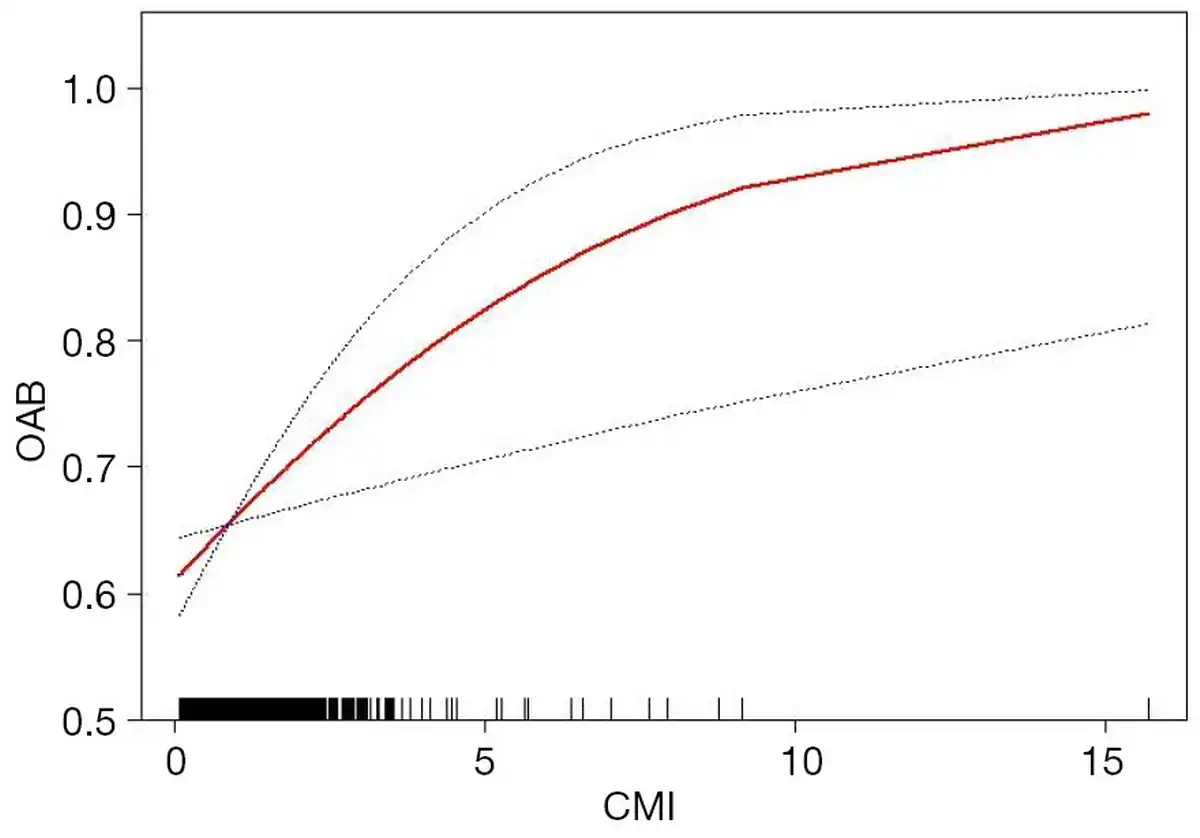
Figure 2
The association between CMI and OAB. The red line represents the curve fitting between variables. Blue bands represent the 95% CI from the fit. Model adjusted for age, gender, race, education level, family PIR, pregnancy status, marital status, hypertension, sleep disorders, coronary heart disease, smoking status, alcohol consumption, the intensity of work-related activities, recreational activities of varying intensities, cotinine levels, BUN, creatinine, and uric acid. BUN, blood urea nitrogen; CI, confidence interval; CMI, cardiometabolic index; OAB, overactive bladder; PIR, poverty-to-income ratio.
Table 3
Association between CMI and OAB using piecewise linear regression
| Characteristics | Adjusted β (95% CI) | P value |
|---|---|---|
| Model 1 (linear regression) | 1.25 (1.06, 1.47) | 0.008 |
| Model 2 (segmented regression) | ||
| Turning point (K) | 2.12 | – |
| CMI < K effect | 1.32 (1.05, 1.66) | 0.02 |
| CMI > K effect | 1.13 (0.83, 1.53) | 0.44 |
| P for log-likelihood ratio | – | 0.50 |
Subgroup analysis
To further confirm the association between OAB and CMI in different subgroups, subgroup analysis was performed. As shown in Figure 3, the association between OAB and CMI remained consistent in different subgroups of variables such as gender, age, race, education level, marital status, pregnancy status, PIR, hypertension, coronary heart disease, sleep disorders, smoking, drinking, heavy physical labor, and moderate to severe recreational activities (P>0.05). Among the respondents who worked moderately, there was a significant between-group difference in the correlation between CMI and OAB (P=0.02). In addition, we found that CMI was positively correlated with OAB except for participants with heart disease (OR =0.93; 95% CI: 0.48–1.80). We also conducted subgroup analysis on cotinine, BUN, creatinine, and uric acid, as shown in Table S2.

Figure 3
Subgroup analysis for the association between CMI and OAB. Each symbol represents the strength of the correlation between the different variables and the outcome. ***, P<0.001. CI, confidence interval; CMI, cardiometabolic index; OAB, overactive bladder; OR, odds ratio; PIR, poverty-to-income ratio.
Evaluation of diagnostic tests using ROC curves
We assessed the predictive efficacy of CMI against various anthropometric indicators (BMI, VAI, WWI, TyG, and LAP) for the incidence of OAB by calculating the area under the curve (AUC) as depicted in Figure 4. The ROC analysis indicated that the AUC values for CMI, LAP, VAI, BMI, TyG, and WWI were 0.719, 0.715, 0.713, 0.712, 0.712, and 0.712, respectively. The results showed CMI exhibited the greatest predictive capability, whereas BMI, TyG, and WWI demonstrated the least predictive power.
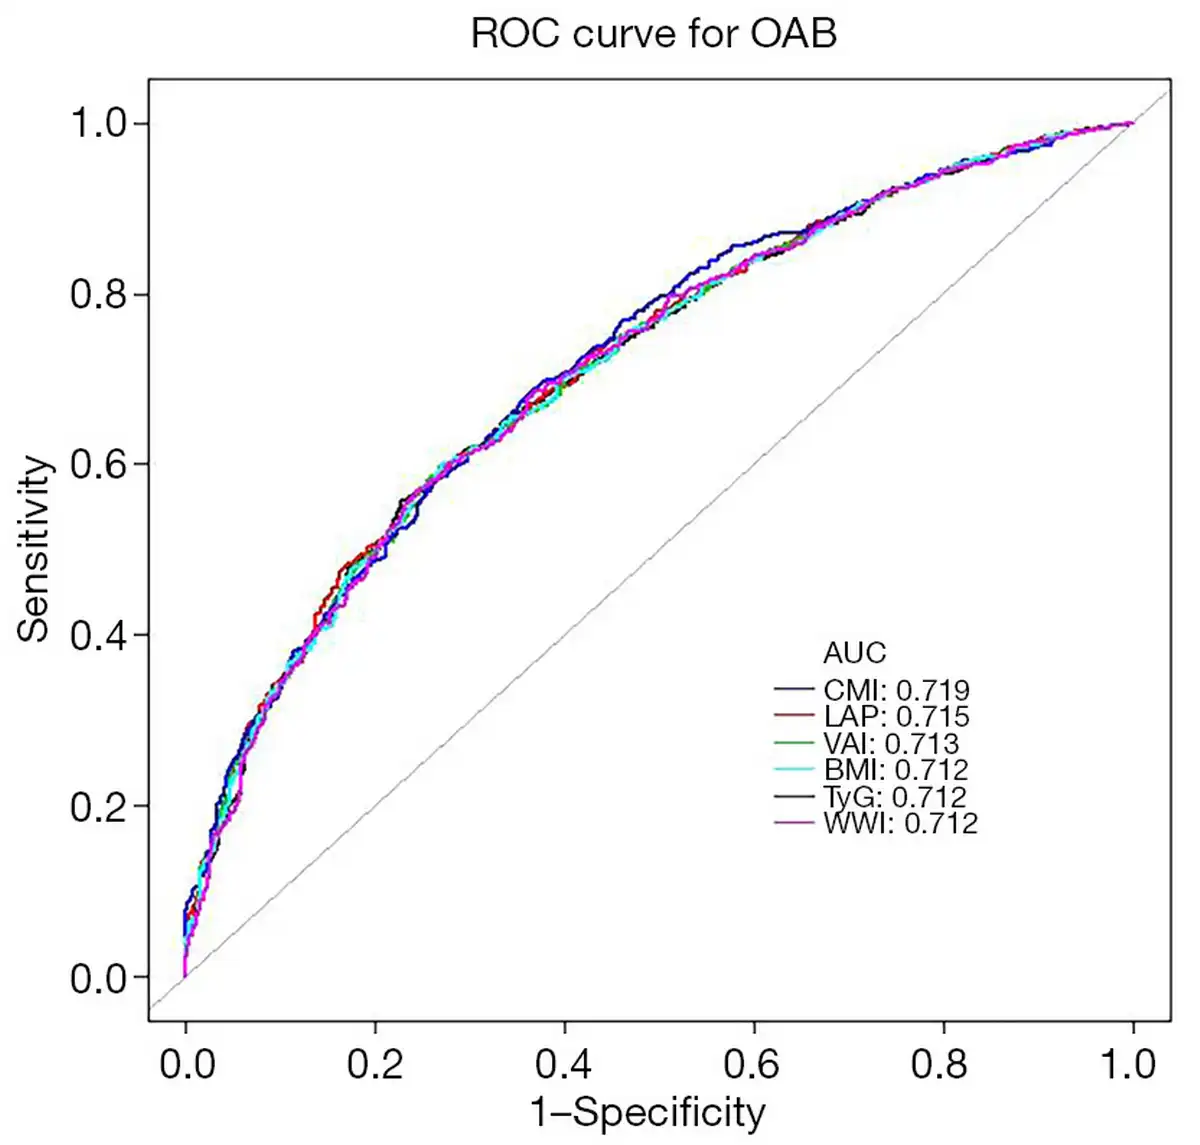
Figure 4
ROC curve analysis for predicting OAB. AUC, area under the curve; BMI, body mass index; CMI, cardiometabolic index; LAP, lipid accumulation product; OAB, overactive bladder; ROC, receiver operating characteristic; TyG, triglyceride glucose index; VAI, visceral adiposity index; WWI, weight-adjusted waist index.
Discussion
OAB is a prevalent urinary disorder that significantly impacts quality of life, leading to economic losses and increased medical costs. In recent years, the prevalence of OAB has risen. The prevailing perspective is that OAB predominantly affects female patients, and most previous OAB-related clinical trials have primarily included female participants. In our interaction analysis, we observed that the association between CMI and OAB was significantly stronger in the female group, while no significant relationship was found in the male group. This discrepancy may be attributed to the relatively smaller number of male participants in the dataset used in this study. However, an epidemiological study by Debra and colleagues demonstrated that the prevalence of OAB among adult males and females within the community is roughly equivalent, particularly among individuals aged over 60 years (). This finding suggests that reliance on self-reported data to estimate the incidence of OAB may lack objectivity. Future research should focus on addressing this limitation and further investigating OAB in male populations.
Obesity is significantly associated with an increased prevalence of chronic diseases such as diabetes, hypertension, and hyperlipidemia (). In recent years, it has emerged as a critical global public health issue. BMI is widely used globally as an indicator of overweight and obesity. However, it fails to specify the types of obesity, such as apple-shaped obesity (characterized by upper body fat accumulation) and pear-shaped obesity (characterized by lower body fat accumulation), nor does it differentiate between fat distribution and muscle strength. The phenomenon known as the obesity paradox has been documented in previous studies, indicating that participants who are overweight or obese often exhibit better outcomes, particularly among patients with coronary artery disease and myocardial infarction (). The findings of prior studies regarding the relationship between obesity and OAB are inconsistent. Some research indicates a significant positive association between BMI and OAB (,), while other studies suggest no significant correlation (,). CMI, introduced in 2015, serves as an integrated measure of lipid profiles and somatic parameters, calculated as the product of triglyceride to high-density lipoprotein cholesterol ratio (TG/HDL-C) and waist-to-height ratio (WHtR) (). The TG/HDL-C ratio has been validated as a predictor of cardiovascular disease, while WHtR is recognized as a robust indicator for assessing abdominal obesity (). Although empirical research has not yet established a direct correlation between CMI and OAB, previous studies examining the association between lipid profiles, anthropometric measurements, and OAB provide indirect evidence supporting such a relationship. Notably, established predictors of OAB, including BMI, VAI, LAP, and TyG, share computational similarities with CMI, thereby suggesting the potential utility of CMI in predicting OAB disease ().
Understanding the relationship between CMI and OAB is essential, yet it remains insufficient to fully elucidate the association. Although the precise mechanism linking CMI and OAB is unclear, several hypotheses may provide insight. First, the increase in CMI may partly reflect an accumulation of visceral fat, which exerts physical pressure on the bladder and pelvis. This pressure can lead to compression of the bladder neck and urethra, thereby increasing the odds of urinary incontinence. Additionally, visceral fat may adversely affect the function of pelvic floor muscles, compromising the ability to close the urethra and control urination (). Second, the accumulation of visceral fat can result in the release of proinflammatory factors that disrupt the pelvic floor structure, reduce urinary sphincter tension and elasticity, and potentially induce chronic inflammation (). This inflammation may impair nerve conduction and affect the central nervous system’s control over pelvic floor nerves, leading to alterations in nerve conduction velocity, neuronal damage or degeneration, and impaired urethral perception and control, ultimately heightening the odds of urinary incontinence (,). Third, previous studies have demonstrated associations between OAB and metabolic syndrome (METS) (,). Patients with METS are at an increased odds of developing OAB, with contributing factors including sympathetic overactivity, oxidative stress, and impaired endothelial function (,). Furthermore, ischemic injury to the bladder wall during urine storage, decreased bladder neck perfusion, elevated non-esterified fatty acids, and reduced nitric oxide levels may also play a role (,). In addition to hyperactivity, OAB is linked to impaired bladder contractility, which may stem from pathological changes across all layers of the bladder wall, including smooth muscle and neurological factors (). Notably, insulin resistance, a significant component of METS, is also influenced by obesity (). Furthermore, obesity may pose underlying psychological problems, such as anxiety, depression, or stress that may contribute to OAB ().
This cross-sectional analysis represents the extensive clinical investigation of the association between CMI and OAB within the US population, involving 1,740 participants. Our findings indicate a positive correlation between CMI and the onset of OAB, with an increase in CMI associated with a heightened odds of developing OAB. The smooth curve fitting analysis demonstrated a non-linear positive relationship between CMI and OAB. Additionally, we found that the positive association between CMI and OAB remained consistent across most subgroups, suggesting that the relationship between CMI and the pathogenesis of OAB is stable in various contexts. Previous studies have investigated the feasibility of using indicators such as BMI, WWI, VAI, LAP, and TyG to predict the onset of OAB (,,). Building upon this foundation, our research further validates that CMI can also serve as an effective metric for assessing OAB. We conducted ROC analysis of these parameters to evaluate the efficacy of different indicators in predicting OAB, with results indicating that CMI exhibited the strongest predictive capability for OAB. We adjusted for potential covariates to reduce the influence of confounding factors, employing additive models and subgroup analyses to enhance the robustness and reliability of our conclusions. However, this study does have certain limitations. First, the participants were exclusively U.S. adults, which may restrict the generalizability of our results to other geographic and racial groups. Further research is needed to explore these associations in a more diverse population. Second, due to the cross-sectional design of the study, establishing a causal relationship between CMI and OAB remains unattainable. Additionally, some variables were collected through self-report methods, which are susceptible to biases stemming from participants’ memory and honesty, potentially leading to inaccuracies in recall. In conclusion, we advocate for larger prospective studies to further investigate the relationship between CMI and OAB, and we aspire to elucidate the biological connection between these two conditions in future research.
Conclusions
This cross-sectional study provides the large-scale clinical evidence demonstrating a significant positive association between CMI and OAB risk in a representative US cohort. This research offers innovative perspectives on the relationship between CMI and OAB, thereby establishing a theoretical basis for targeted public health interventions and improved clinical management strategies.
Acknowledgments
We would like to thank the data collection team and NHANES administration for the related data available through the NHANES website.
Footnote
Reporting Checklist: The authors have completed the TRIPOD reporting checklist. Available at https://tau.amegroups.com/article/view/10.21037/tau-2025-304/rc
Peer Review File: Available at https://tau.amegroups.com/article/view/10.21037/tau-2025-304/prf
Funding: None.
Conflicts of Interest: All authors have completed the ICMJE uniform disclosure form (available at https://tau.amegroups.com/article/view/10.21037/tau-2025-304/coif). The authors have no conflicts of interest to declare.
Ethical Statement: The authors are accountable for all aspects of the work in ensuring that questions related to the accuracy or integrity of any part of the work are appropriately investigated and resolved. This study was conducted in accordance with the Declaration of Helsinki and its subsequent amendments.
Open Access Statement: This is an Open Access article distributed in accordance with the Creative Commons Attribution-NonCommercial-NoDerivs 4.0 International License (CC BY-NC-ND 4.0), which permits the non-commercial replication and distribution of the article with the strict proviso that no changes or edits are made and the original work is properly cited (including links to both the formal publication through the relevant DOI and the license). See: https://creativecommons.org/licenses/by-nc-nd/4.0/.
References
1
Abrams P, Cardozo L, Fall M, et al. The standardisation of terminology of lower urinary tract function: report from the Standardisation Sub-committee of the International Continence Society. Neurourol Urodyn 2002;21:167-78. 10.1002/nau.10052118576712
Irwin DE, Kopp ZS, Agatep B, et al. Worldwide prevalence estimates of lower urinary tract symptoms, overactive bladder, urinary incontinence and bladder outlet obstruction. BJU Int 2011;108:1132-8. 10.1111/j.1464-410X.2010.09993.x212319913
Durden E, Walker D, Gray S, et al. The economic burden of overactive bladder (OAB) and its effects on the costs associated with other chronic, age-related comorbidities in the United States. Neurourol Urodyn 2018;37:1641-9. 10.1002/nau.23513294648134
Song W, Hu H, Ni J, et al. The Role of Sarcopenia in Overactive Bladder in Adults in the United States: Retrospective Analysis of NHANES 2011-2018. J Nutr Health Aging 2023;27:734-40. 10.1007/s12603-023-1972-3377542135
Blaivas JG, Li ESW, Dayan L, et al. Overactive bladder phenotypes: development and preliminary data. Can J Urol 2021;28:10699-704.341294656
Irwin DE, Milsom I, Hunskaar S, et al. Population-based survey of urinary incontinence, overactive bladder, and other lower urinary tract symptoms in five countries: results of the EPIC study. Eur Urol 2006;50:1306-14; discussion 1314-5. 10.1016/j.eururo.2006.09.019170497167
Golden A. Obesity's Impact. Nurs Clin North Am 2021;56:xiii-xiv. 10.1016/j.cnur.2021.08.004347499028
Piché ME, Tchernof A, Després JP. Obesity Phenotypes, Diabetes, and Cardiovascular Diseases. Circ Res 2020;126:1477-500. 10.1161/CIRCRESAHA.120.316101324373029
Stadler JT, Marsche G. Obesity-Related Changes in High-Density Lipoprotein Metabolism and Function. Int J Mol Sci 2020;21:8985. 10.3390/ijms212389853325609610
Heymsfield SB, Scherzer R, Pietrobelli A, et al. Body mass index as a phenotypic expression of adiposity: quantitative contribution of muscularity in a population-based sample. Int J Obes (Lond) 2009;33:1363-73. 10.1038/ijo.2009.1841977373911
Park Y, Kim NH, Kwon TY, et al. A novel adiposity index as an integrated predictor of cardiometabolic disease morbidity and mortality. Sci Rep 2018;8:16753. 10.1038/s41598-018-35073-43042528812
Ding C, Shi Y, Li J, et al. Association of weight-adjusted-waist index with all-cause and cardiovascular mortality in China: A prospective cohort study. Nutr Metab Cardiovasc Dis 2022;32:1210-7. 10.1016/j.numecd.2022.01.0333527732713
de Boer TA, Slieker-ten Hove MC, Burger CW, et al. The prevalence and risk factors of overactive bladder symptoms and its relation to pelvic organ prolapse symptoms in a general female population. Int Urogynecol J 2011;22:569-75. 10.1007/s00192-010-1323-x2110440014
Lai HH, Helmuth ME, Smith AR, et al. Relationship Between Central Obesity, General Obesity, Overactive Bladder Syndrome and Urinary Incontinence Among Male and Female Patients Seeking Care for Their Lower Urinary Tract Symptoms. Urology 2019;123:34-43. 10.1016/j.urology.2018.09.0123039305415
McGrother CW, Donaldson MM, Hayward T, et al. Urinary storage symptoms and comorbidities: a prospective population cohort study in middle-aged and older women. Age Ageing 2006;35:16-24. 10.1093/ageing/afi2051623431416
Uzun H, Zorba OÜ. Metabolic syndrome in female patients with overactive bladder. Urology 2012;79:72-5. 10.1016/j.urology.2011.08.0502201497217
Kosmas CE, Rodriguez Polanco S, Bousvarou MD, et al. The Triglyceride/High-Density Lipoprotein Cholesterol (TG/HDL-C) Ratio as a Risk Marker for Metabolic Syndrome and Cardiovascular Disease. Diagnostics (Basel) 2023;13:929. 10.3390/diagnostics130509293690007318
Ashwell M, Gunn P, Gibson S. Waist-to-height ratio is a better screening tool than waist circumference and BMI for adult cardiometabolic risk factors: systematic review and meta-analysis. Obes Rev 2012;13:275-86. 10.1111/j.1467-789X.2011.00952.x2210692719
Alsannan B, Laganà AS, Alhermi J, et al. Prevalence of overactive bladder among overweight and obese women: A prospective cross-sectional cohort study. Eur J Obstet Gynecol Reprod Biol 2024;295:59-64. 10.1016/j.ejogrb.2024.02.0103834059120
Elbaset MA, Taha DE, Sharaf DE, et al. Obesity and Overactive Bladder: Is It a Matter of Body Weight, Fat Distribution or Function? A Preliminary Results. Urology 2020;143:91-6. 10.1016/j.urology.2020.04.1153247393921
Hui Z, Zewu Z, Yang L, et al. Association between weight-adjusted waist index and overactive bladder: a cross-sectional study based on 2009-2018 NHANES. Front Nutr 2024;11:1423148. 10.3389/fnut.2024.14231483929651122
Shang Y, Chen J, Tai Y. Association between weight-adjusted waist index and overactive bladder syndrome among adult women in the United States: a cross-sectional study. BMC Womens Health 2024;24:488. 10.1186/s12905-024-03339-x3923269623
Townsend MK, Curhan GC, Resnick NM, et al. BMI, waist circumference, and incident urinary incontinence in older women. Obesity (Silver Spring) 2008;16:881-6. 10.1038/oby.2008.141837956424
Pang H, Yin Y, Xue J, et al. Associations between visceral adipose index and stress urinary incontinence among US adult women: a cross-sectional study. World J Urol 2023;41:3671-8. 10.1007/s00345-023-04667-73792193425
Marcelissen T, Anding R, Averbeck M, et al. Exploring the relation between obesity and urinary incontinence: Pathophysiology, clinical implications, and the effect of weight reduction, ICI-RS 2018. Neurourol Urodyn 2019;38 Suppl 5:S18-24. 10.1002/nau.240723182163326
Teleman PM, Lidfeldt J, Nerbrand C, et al. Overactive bladder: prevalence, risk factors and relation to stress incontinence in middle-aged women. BJOG 2004;111:600-4. 10.1111/j.1471-0528.2004.00137.x1519878927
Bunn F, Kirby M, Pinkney E, et al. Is there a link between overactive bladder and the metabolic syndrome in women? A systematic review of observational studies. Int J Clin Pract 2015;69:199-217. 10.1111/ijcp.125182549590528
Saratlija Novakovic Z, Tesija RA, Puljak L. Association between metabolic syndrome and overactive bladder: a case-control study. Scand J Urol 2017;51:470-3. 10.1080/21681805.2017.13549122874874729
Lin HY, Lu JH, Lin RJ, et al. Effects of Nitric Oxide on Bladder Detrusor Overactivity through the NRF2 and HIF-1α Pathways: A Rat Model Induced by Metabolic Syndrome and Ovarian Hormone Deficiency. Int J Mol Sci 2024;25:11103. 10.3390/ijms2520111033945688430
Hsu LN, Hu JC, Chen PY, et al. Metabolic Syndrome and Overactive Bladder Syndrome May Share Common Pathophysiologies. Biomedicines 2022;10:1957. 10.3390/biomedicines100819573600950531
Peyronnet B, Mironska E, Chapple C, et al. A Comprehensive Review of Overactive Bladder Pathophysiology: On the Way to Tailored Treatment. Eur Urol 2019;75:988-1000. 10.1016/j.eururo.2019.02.0383092269032
Lee YL, Lin KL, Wu BN, et al. Epigallocatechin-3-gallate alleviates bladder overactivity in a rat model with metabolic syndrome and ovarian hormone deficiency through mitochondria apoptosis pathways. Sci Rep 2018;8:5358. 10.1038/s41598-018-23800-w2959947333
Chen LC, Kuo HC. Pathophysiology of refractory overactive bladder. Low Urin Tract Symptoms 2019;11:177-81. 10.1111/luts.122623090037334
Zuluaga L, Caicedo JI, Mogollón MP, et al. Anxiety and depression in association with lower urinary tract symptoms: results from the COBaLT study. World J Urol 2023;41:1381-8. 10.1007/s00345-023-04351-w3696152535
Li Q, Qie R, Qin P, et al. Association of weight-adjusted-waist index with incident hypertension: The Rural Chinese Cohort Study. Nutr Metab Cardiovasc Dis 2020;30:1732-41. 10.1016/j.numecd.2020.05.03332624344