Introduction
Chronic lymphocytic leukemia (CLL) is the most common type of leukemia in adults []. It is characterized by progressive accumulation of small, morphologically mature, monoclonal B lymphocytes in the peripheral blood, lymph nodes, and bone marrow. Proliferation and survival of leukemic lymphocytes require both endogenous and exogenous activation signals []. Endogenous signals are associated with changes in the genome of leukemic cells. Chromosomal aberrations, e.g., del(17)(p13.1), del(13)(q14.) and some point mutations like these in TP53 and NOTCH1 genes affect leukemic cells survival and have prognostic value [, ]. Exogenous signals in the form of cytokines and chemokines come from microenvironment, which plays significant role in the survival of leukemia cells []. CLL microenvironment is composed of different cells, such as mesenchymal stromal cells, dendritic cells, T lymphocytes, and nurse-like cells (NLCs) []. NLCs are found within pseudo follicles present in tissue infiltrates []. Moreover, these cells differentiate from monocytes under in vitro conditions; they were first described by Burger et al. [] in 2000. NLCs’ phenotype is similar to tumor-associated macrophages []. Coculture of leukemic cells with NLCs is a good model resembling the lymphatic microenvironment. This biological model may be used to analyze microenvironment interactions with leukemic cells [–].
In vitro, NLCs protect leukemic cells against spontaneous apoptosis by producing several chemokines, like CCL3, CCL4, and CXCL8 (IL-8) [, , ]. CCL3 and CCL4 are overexpressed by CLL cells after B-cell receptor (BCR) activation []. These chemokines produced by leukemic lymphocytes act chemotactically on T lymphocytes and monocytes [, ]. Interleukin 8 was described as one of the first molecules to play a key role in CLL biology []. Its serum levels are increased in CLL patients compared to healthy donors []. However, according to our knowledge, the main role of IL-8 in CLL pathogenesis has still not been precisely determined.
The interplay, contact between CLL cells and NLC, is maintained also by adhesion molecules expressed on CLL cells and corresponding ligands on NLCs []. Additionally, some adhesion molecules act not only in a cell-to-cell contact but also in paracrine manner through their soluble forms, e.g., sCD163, sJAG1. sCD163 molecule seems to be helpful in assessing the microenvironmental state in CLL, especially NLCs characteristics. The soluble form of CD163 appears in plasma as a result of proteolytic cleavage of the CD163 extracellular domain expressed on the membrane of monocytes and macrophages []. Expression of CD163 is higher after differentiation of monocytes to macrophages, and CD163 is certainly a marker of macrophage activity, but its biological role still has not been fully elucidated [, ]. The secreted form of JAG1 can affect the modulation of the microenvironment of leukemia cells by activation of NOTCH1 receptor in paracrine manner [].
Among other important factors which can modulate the microenvironment, BIRC5 (SURVIVIN) protein should be mentioned. It belongs to the family of the apoptosis inhibitors, involved in both apoptosis inhibition and cell cycle regulation [–]. SURVIVIN expression is observed in the cytoplasm and nuclei of embryonic and cancer cells, it was found to promote survival of the latter. In addition, the BIRC5 secretory form (sBIRC5) also has been described. sBIRC affects the modeling of the microenvironment associated with cancer cells [].
The aim of our study was to analyze selected microenvironmental factors having a potential impact on leukemic cells survival, as well as their association with clinical, cytogenetic, and molecular parameters. For this study, we selected three types of molecules which can modulate microenvironment: chemokines IL-8 and CCL3 (which are classically secreted to matrix), soluble forms of adhesion molecules JAG1 and CD163, and secreted form of endogenous protein BIRC5.
Materials and Methods
Patients Characteristics
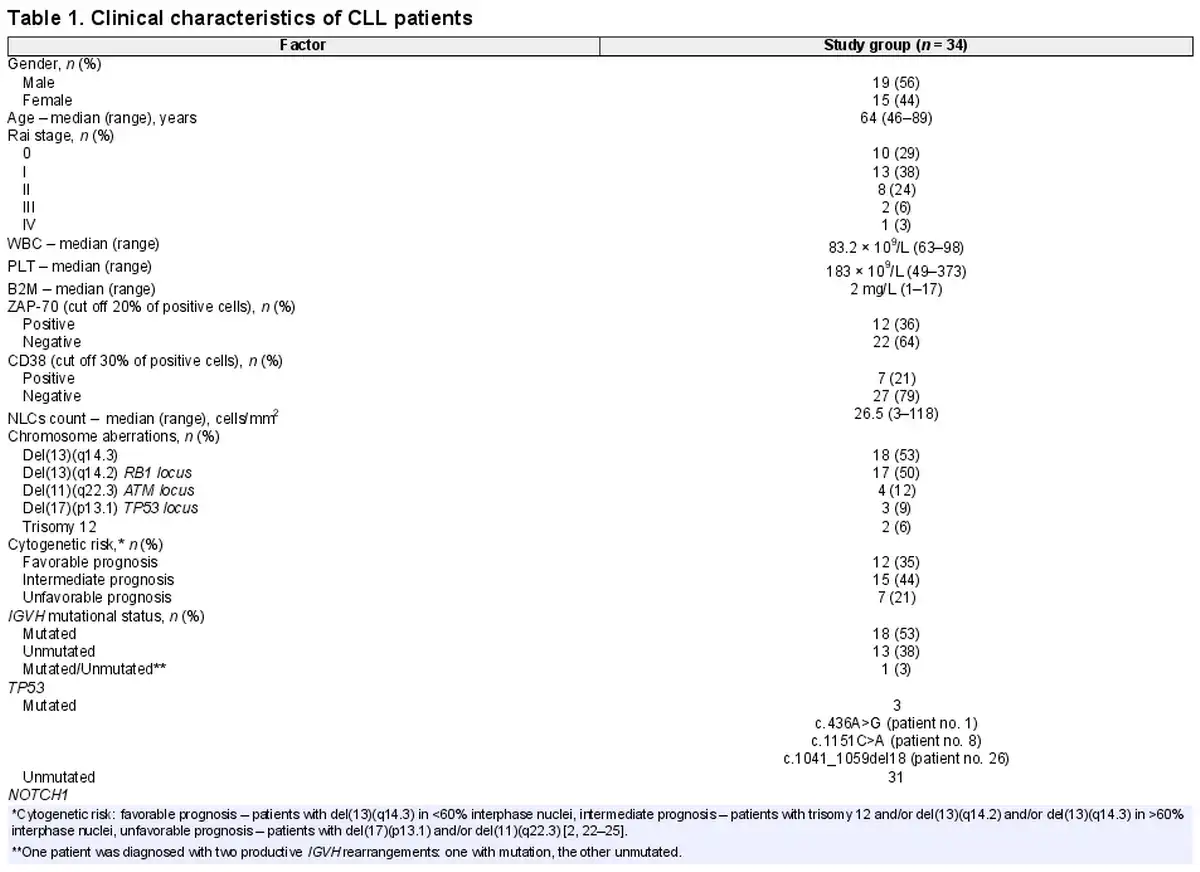
With written informed consent, in accordance with the Declaration of Helsinki and approval from the Medical University of Lublin Bioethics Committee (KE-0254/99/2015 and KE-0254/155/2010), peripheral blood was obtained from 34 consecutive, treatment-naive patients (15 women and 19 men), diagnosed with CLL at the Department of Hematooncology and Bone Marrow Transplantation, Medical University of Lublin. Patients were diagnosed according to standard morphological and immunophenotypic criteria []. By reference to the Rai classification, 10 patients were at stage 0, twelve at stage I, eight at stage II, two at stage III, and one at stage IV. Detailed clinical and hematological parameters are shown in Table 1. Peripheral blood from twelve healthy volunteers attending the Regional Blood Donation and Haemotherapy Center in Lublin served as the reference sample (5 women and 7 men, median age was 30).
Immuonophenotyping
Whole blood specimens were immunophenotyped by flow cytometry with FACSCalibur apparatus equipped with the CellQuest software (Becton-Dickinson Immunocytometry System) on 10,000 cells for each sample, after incubation with monoclonal mouse antihuman CD5-PE, CD19-PE-Cy5, CD38-FITC, and ZAP-70 antibodies along with appropriate isotype controls (Becton-Dickinson Bioscience, US). Antibodies were applied at 1 μg/μL of cell suspension (1 × 10⁶ cells in 1% BSA solution in PBS). Next, samples were processed according to the manufacturer’s instruction.
Long-Term Coculture of Leukemia Cells with NLCs and Medium Sample Collection
Long-term cell culture was prepared from mononuclear cells derived from the upper blood layer after gradient density centrifugation (LymphoprepTM, AXIS-SHIELDS). Cells were seeded on the cell culture plates with grid (Sarstedt, Germany). The cell cultures were grown on RPMI 1640 medium supplemented with L-glutamine and NaHCO3 (Biomed, Poland), 15% fetal calf serum (Gibco, USA), and antibiotic solution (100 U/mL penicillin G sodium, 100 μg/mL streptomycin sulphate and 0.25 μg/mL amphotericin B) (Biomed, Poland). The initial culture density was 4 × 10⁶ cells/mL, total volume 3 mL (12 × 106). The cultures were grown at 37°C, in a 5% CO2 atmosphere. Every 3 days, 1/3 of the volume of medium was 1 mL. Differentiation of adherent mononuclear cells (NLCs) in culture was observed after 4–6 days. On the sixth day, during the routine medium exchange, the part of culture medium was harvested for further molecular analyses. The number of NLCs cells was evaluated on the 21st day of cultivation, under a light inverted microscope. Cells from 10 grids were counted and the average number of NLCs cells per one grid (2.5 mm2) was calculated. Finally, the number of cells per 1 mm2 area of the culture plate was calculated.
Enzyme-Linked Immunosorbent Assays for Measuring CCL3, IL-8, sBIRC, sCD163, and sJAG1
To determine the concentration of IL-8, sBIRC5, CCL3, sCD163, and sJAG1 in the serum and the medium sample, a Human IL-8/NAP-1 Platinum ELISA (Thermo Scientific, USA), Human CCL3 ELISA Kit (MyBioSource, USA), Human Survivin (Sur) ELISA Kit (MyBioSource, USA), Human sCD163/soluble Haemoglobin Scavenger Receptor (sCD163) ELISA Kit (MyBioSource, USA), and Human Jagged 1 Protein (JAG1) ELISA Kit (MyBioSource, USA) were used. Each test was performed according to the manufacturer’s protocol. The values were measured in triplicate, and mean concentrations were determined based on standards provided. The absorbance was recorded by microplate absorbance reader Sunrise™ (TECAN, Switzerland). Data collection and analysis were performed using Magellan™ v7.1 software (TECAN, Switzerland).
FISH Analysis
Mononuclear cells were isolated from peripheral blood samples by gradient density centrifugation using Lymphoprep™ (Stemcell, Germany). Cell cultures were performed in RPMI 1640 medium with L-glutamine and NaHCO3 (Biomed, Poland) supplemented with 15% fetal calf serum (Biomed, Poland), 10 U/mL penicillin, 50 µg/mL streptomycin, and 0.25 µg/mL amphotericin B (Gibco, US). Cells were cultured at 37°C in a humidified incubator in 5% CO2 atmosphere for 24 h. FISH was performed according to the manufacturer’s protocol using standard set of the following probes for CLL: Vysis D13S319 (13q14.3) Spectrum Orange Probe, Vysis LSI 13 RB1 (13q14) Spectrum Orange Probe, Vysis LSI ATM (11q22.3), Vysis LSI TP53 (17p13.1) Spectrum Orange/CEP 17 Spectrum Green Probe and CEP 12 Spectrum Orange Probe (Abbott, Poland). The empirically established cut-off levels were as follows: 8% of positive cells for del(13)(q14.3), 6% for RB1 locus deletion, 9% for del(11)(q22.3), 10% for del(17)(p13.1), and 5% for trisomy 12. Based on the results of the analysis of described chromosomal aberrations, patients were classified into three groups of cytogenetic risk: with favorable prognosis [patients with del (13)(q14) in <60% interphase nuclei], unfavorable [patients with del (17)(q13.1) and/or del (11)(q22.3)], and intermediate (patients with normal karyotype and/or trisomy 12 and/or deletion of RB1 and/or del (13)(q14) in> 60% interphase nuclei) [, –].
Genomic DNA Isolation
Genomic DNA was isolated from 200 µL peripheral blood samples using GeneMATRIX Quick Blood DNA Purification Kit (EURx, Poland), according to the manufacturer’s protocol. DNA quality and quantity were assessed by means of NanoDrop 2000 spectrophotometer (Thermo Fisher Scientific, USA) and by 2% agarose gel electrophoresis in TBE (EURx, Poland). DNA samples containing nondegraded DNA with A260/280 ratio between 1.8 and 2.0 were used for further analyses of IGVH, TP53, and NOTCH1 gene mutations.
IGVH Mutational Status Analysis
The IGHV mutational status was determined by automated sequencing analysis. The IGHV sequencing was performed according to the BIOMED-2 Concerted Action protocols []. The first polymerase chain reaction was carried out using six different sense primers specific for framework region 1 consensus family (IGHV1-IGHV6) and one antisense primer complementary to the germline JH region. The seven IGHV families were amplified in six individual polymerase chain reactions. Next, PCR products were separated on 2% agarose gel. The bands cut from the gel were then purified using QIAquick Gel Extraction Kit (Qiagen, Germany) and served as the template for the second PCR (sequencing PCR) which was performed using BigDye Terminator v3.1 cycle sequencing kit (Thermo Fisher Scientific, USA) according to the manufacturer’s protocol. The automatic capillary electrophoresis was performed by automatic ABI 3500 Genetic Analyzer (Applied Biosystems/Thermo Fisher Scientific, USA). Each clonal DNA IGHV sequence was compared with the closest germline sequence using international tool ImMunoGeneTics information system (IMGT). The sequence with germline homology 98% or higher was considered unmutated and those with a homology less 98% as mutated [].
TP53 and NOTCH1 Sequencing Analysis
The TP53 mutational status was determined by automated sequencing according to the protocol shared by International Agency of Research on Cancer (IARC). The first PCR was performed using 50 ng of DNA, Color Perpetual OptiTaq PCR Master Mix (EURx, Poland). Next, sequencing PCR was carried out using BigDye Terminator v3.1 cycle sequencing kit (Thermo Fisher Scientific, USA) according to the manufacturer’s protocol. The automatic capillary electrophoresis was performed by automatic ABI 3130 Genetic Analyzer (Applied Biosystems/Thermo Fisher Scientific, USA). Reference sequence NM_000546.5.
The most common mutations in NOTCH1 gene located in the part of exon 34 which codes PEST domain were analyzed by automatic sequencing [–]. The PCR reactions were performed using 50 ng DNA, high fidelity Advantage HD polymerase (Clontech/Takara, USA), HD Buffer 5x (Clontech/Takara, USA), dNTP Mix (A&A Biotechnology, Poland), and primers R (5′AAA GGA AGC CGG GGT CTC GT 3′), F (5′CAG ATG CAG CAG AAC CTG 3′) [] according to the following temperature conditions: 94°C for 5 min; 35 cycles at 98°C for 20 s, 64°C for 45 s, 72°C for 35 s; final elongation 72°C for 5 min. Next, sequencing PCR was performed using BigDye Terminator v3.1 cycle sequencing kit (Thermo Fisher Scientific, USA) according to the manufacturer’s protocol. The automatic capillary electrophoresis was performed by means of automatic ABI 3130 Genetic Analyzer (Applied Biosystems/Thermo Fisher Scientific, USA).
Statistical Analyses
The normality of data distribution was tested by means of the Shapiro-Wilk test. Descriptive statistical analysis was performed utilizing median, minimal, and maximal values. The significance of differences between dependent samples was tested by means of the Wilcoxon matched-pairs test and Kruskal-Wallis test and the significance of differences between independent samples was tested by the Mann-Whitney U test. The strength of interdependency of two variables was expressed with Spearman’s rank correlation coefficient (R). The differences were considered statistically significant with p values <0.05. Statistical analyses were performed with Statistica 12.0 PL and PQStat v.1.6.6. software.
Results
Clinical Characteristics of Patients
Thirty-four CLL patients with mean age 64 years were included in the study. The detailed clinical and molecular characteristics of the study group are shown in Table 1.
Ex vivo Analysis in Blood Serum
Concentration of CCL3, IL-8, sCD163, sBIRC and sJAG1 in Serum from CLL Patients and Healthy Donors
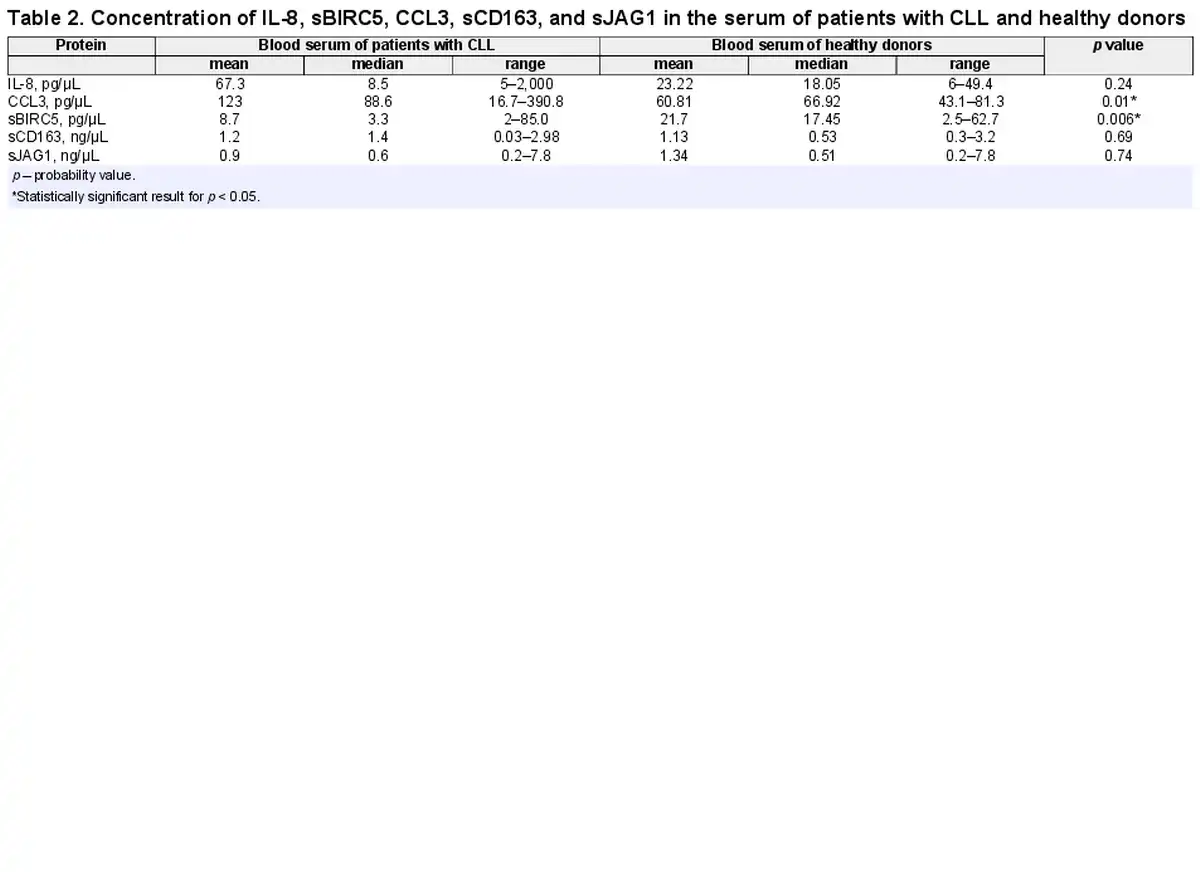
The concentration of CCL3 chemokine in the patients’ blood serum was significantly higher compared to concentration in the blood serum of healthy donors (p = 0.01) (Fig. 1a). On the contrary, sBIRC5 concentration was higher in healthy donors compared to patients (p = 0.006). No statistically significant difference between the two groups with regard to other proteins concentration has been found (Table 2). The mean and median level of serum protein concentration for patients and healthy donors is shown in Table 2.
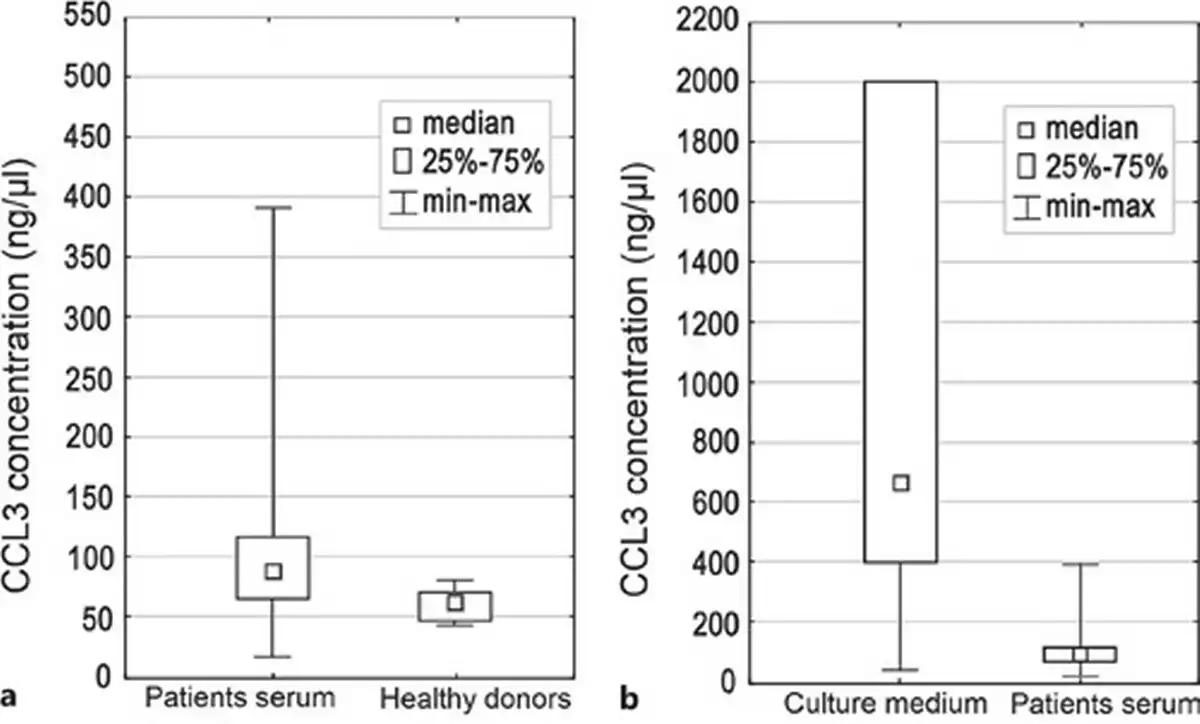
Fig. 1
Box plot of median CCL3 concentration: in patients’ serum and healthy donors (a), and in culture medium and patients' serum (b). Difference in concentration was statistically significant (p = 0.01 and 0.000002, respectively).
CCL3 as a Possible Unfavorable Prognostic Factor in CLL
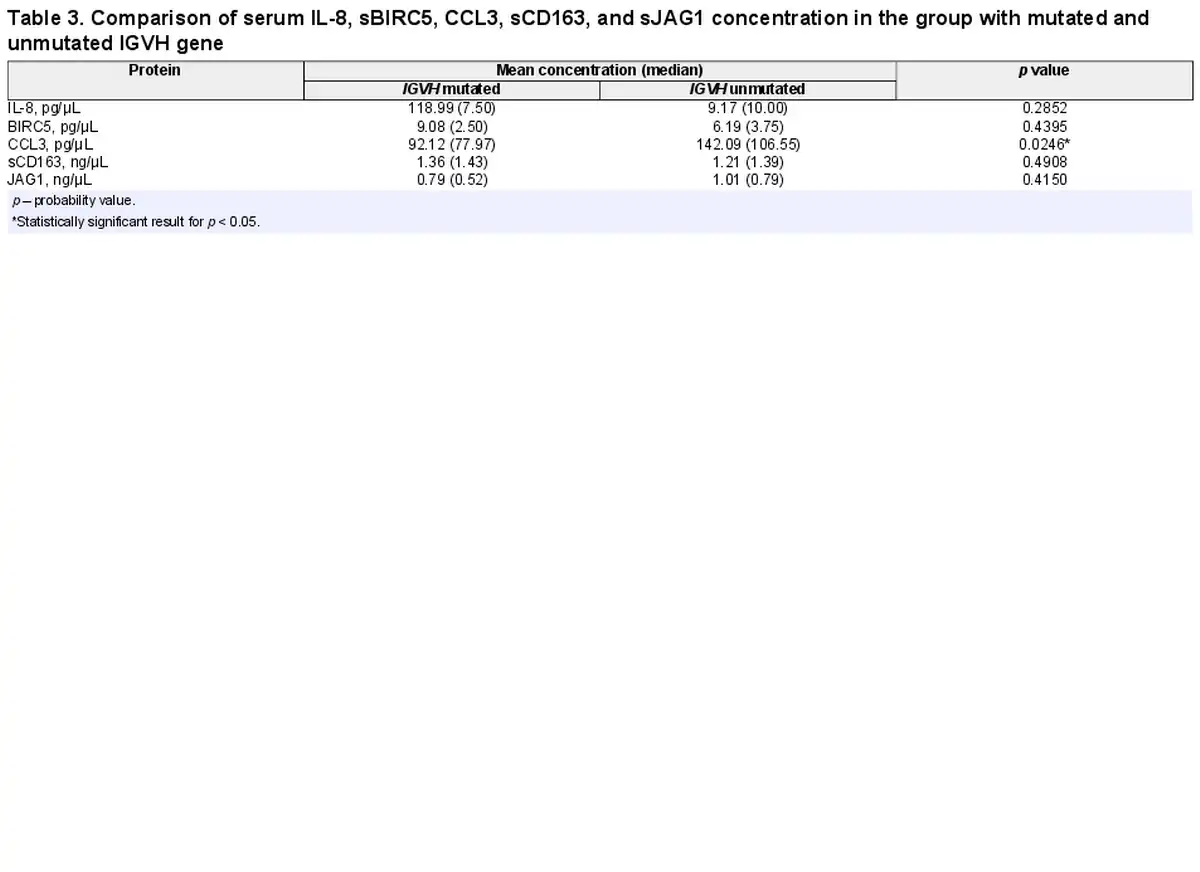
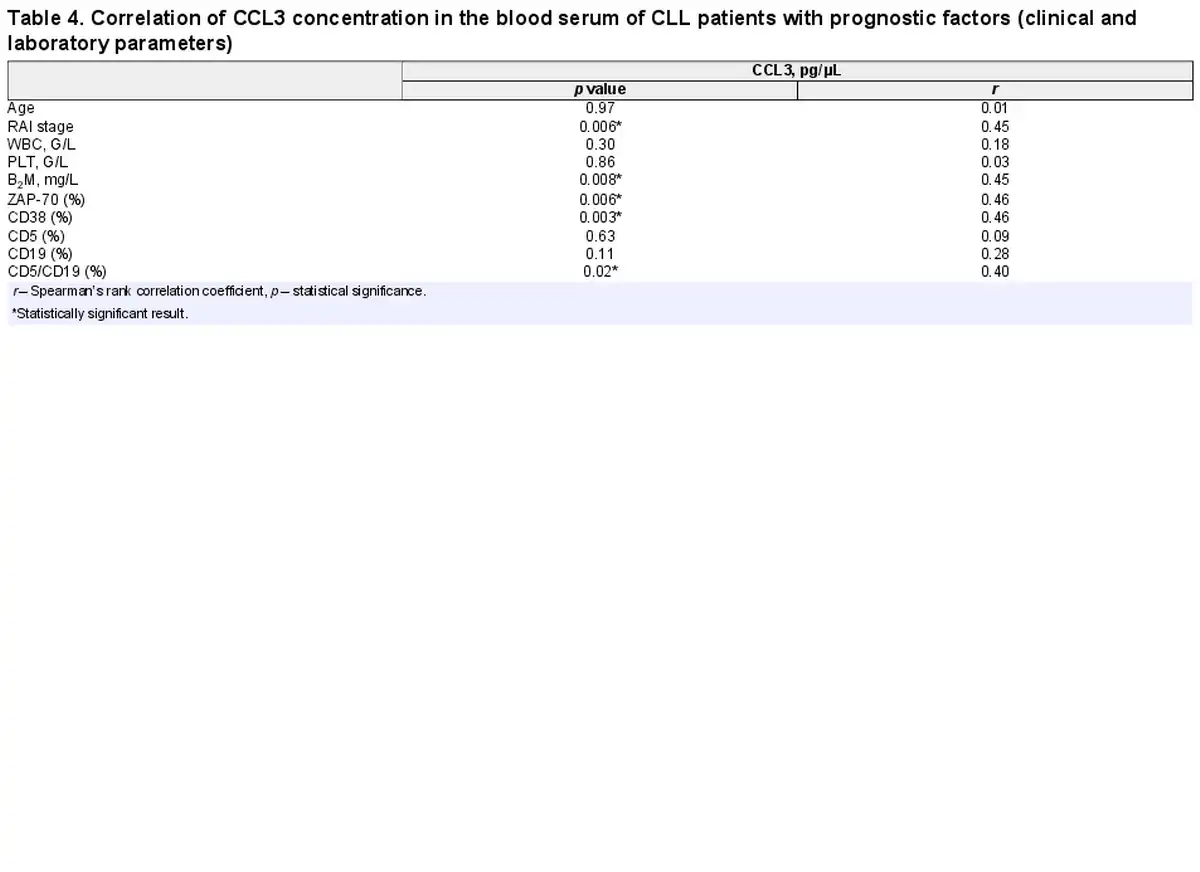
Comparative analysis showed that concentration of CCL3 in the blood serum was higher in the group with unmutated IGVH gene in comparison to the group of patients with mutation (Table 3). Moreover, CCL3 serum level was higher in patients with higher Rai stage of disease (r = 0.45; p = 0.006), B2M concentration (r = 0.45; p = 0.008), ZAP-70 expression (r = 0.46; p = 0.006), CD38 expression (r = 0.46; p = 0.003), and with the percentage of cells with CD5/CD19 co-expression (r = 0.40; p = 0.02) (Table 4).
Concentration of IL-8, CCL3, sBIRC5, sCD163, and sJAG1 in Patients’ Blood Serum and Genetic Changes in CLL Cells
Statistical analysis did not show significant differences in the concentration of chemokines IL-8 and CCL3 and sBIRC5, sCD163, and sJAG1 proteins in the serum of patients with mutation in the TP53 gene and in patients without mutations. There were also no statistically significant differences between the concentrations of studied chemokines and proteins in the blood serum of patients between groups with individual cytogenetic changes.
We found negative correlation between IL-8 medium concentration and Rai stage of disease (r = −0.36; p = 0.034) and positive correlation between concentration of sBIRC5 protein in the culture medium and the WBC number in the blood of CLL patients (r = 0.38; p = 0.03). A negative correlation was observed between the concentration of sJAG1 and the percentage of cells expressing the CD38 molecule (r = −0.39; p = 0.01).
The concentration of individual chemokines and proteins between groups of patients classified into three groups of cytogenetic risk was also compared. Differences between groups were observed only when the concentration of CCL3 chemokine was considered. The higher mean concentration of CCL3 was evident in the serum of patients stratified to an unfavorable prognostic group. However, this difference was not statistically significant.
In vitro Analysis in Cell Cultures
Microenvironmental Characteristics
The presence of NLCs was observed between 3 and 7 days of the culture. The number of NLCs appearing in the long-term culture ranged from 1.6 to 118 cells per 1 mm2 (mean 33.3 cells/mm2). The number of NLCs was not dependent on WBC (p = 0.126). Additionally, no correlation was found between the number of NLCs and β2-microglobulin concentration, ZAP-70 expression, molecule CD38 expression, age, and Rai stage of disease. However, the negative correlation between the number of NLCs and the percentage of cells co-expressing CD5/CD19 molecules has been described (r = −0.39; p = 0.015).
Concentration of CCL3, IL-8, sCD163, sBIRC, and sJAG1 in Cell Culture Medium
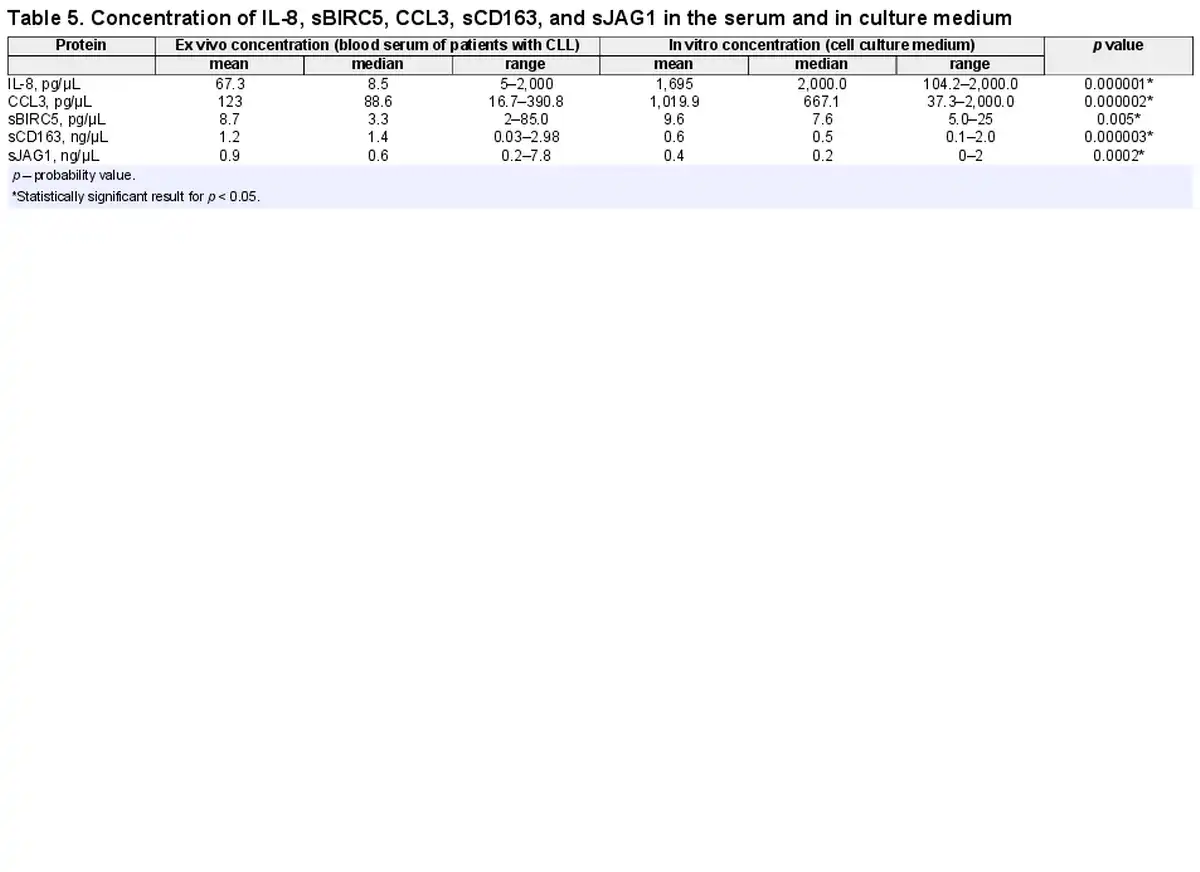
Concentration of tested proteins was different in the culture medium compared to the patients’ serum (Fig. 1b). The IL-8 and CCL3 concentration in the culture medium was significantly higher compared to the patients’ blood serum (p = 0.000001 and p = 0.000002, respectively) (Fig. 1b). The difference in the concentration of the sBIRC5 protein in the patients’ blood serum and in the culture medium was also statistically significant (p = 0.005). Concentration of sCD163 and sJAG1 was lower in culture medium compared to patients’ blood serum (p = 0.000003, p = 0.0002, respectively). The mean and median value of serum and medium protein concentration is presented in Table 5.
The Microenvironmental Factors Induce CCL3 and IL-8 Secretion
We have shown significant positive correlation of CCL3, IL-8, and sJAG1 medium level with NCLs number (r = 0.39 and p = 0.0005; r = 0.60 and p = 0.0002; r = 0.56 and p = 0.0005, respectively). No statistically significant correlation was found between concentration of sBIRC5, sCD163, and the number of NLCs.
Concentration of IL-8, CCL3, sBIRC5, sCD163, and sJAG1 in Cell Culture Medium and Genetic Changes in CLL Cells
Statistical analysis did not show significant differences in the concentration of chemokines IL-8 and CCL3 and sBIRC5, sCD163, and sJAG1 proteins in the serum of patients with mutation in the TP53 gene and in patients without mutations. There were no statistically significant differences between the concentration of studied chemokines and proteins in the blood serum of patients between groups with individual cytogenetic changes.
The comparative analysis of the tested proteins concentration in the culture medium between groups of patients with individual chromosomal aberrations showed that the concentration of CCL3 chemokine, sCD163, and sJAG1 in the culture medium was higher in cocultures of cells derived from patients with del(11)(q22.3) compared to patients without this deletion (p = 0.004, p = 0.003, p = 0.002, respectively). There were no statistically significant differences between study groups considering the presence of other aberrations.
Discussion
In our study, we have analyzed microenvironmental factors which may impact leukemic cell survival. CLL microenvironment plays the main role in the induction of proliferation and survival of CLL cells [, ]. NLCs constitute an integral part of the leukemic cells microenvironment; they differentiate from monocytes only in the presence of CLL cells. The main role of NLCs is to promote the survival of leukemic lymphocytes by blocking their spontaneous and drug-induced apoptosis [, , ]. The NLCs and leukemic lymphocytes interact with each other through adhesion molecules and by release of cytokines, interleukins, and other proteins into the extracellular matrix. Long-term cocultures of leukemic cells with NLCs well reflect the microenvironmental conditions occurring in patients with leukemia [, , , ].
In our research, we developed two biological models. The first one, ex vivo model was based on analysis of peripheral blood serum derived from CLL patients and healthy donors. The second one was based on analysis of medium derived from coculture of leukemic cells with NLCs. We compared these two biological systems to determine the role of microenvironmental factors in CLL pathogenesis.
In our study, NLCs were observed in every leukemic cell culture. However, the number of NLCs cells was different between patients. We found the correlation between the CCL3 concentration in medium and the number of NLCs in coculture. This dependence indicates that the concentration of the CCL3 chemokine may depend on the presence and number of NLCs. Burger and colleagues showed that the gene encoding chemokine CCL3 was highly expressed in leukemic cells after coculture with NLCs and BCR stimulation [, ]. Our research results are consistent with this and also suggest the involvement of NLCs in the secretion of the CCL3 chemokine by leukemic cells. In addition, we showed that the concentration of CCL3 was higher in medium after 6 days in leukemic cell cultures compared to the patient’s blood serum. If we take into account the fact that leukemic cells secrete CCL3 in the presence of NLCs cells, the difference in concentrations described in our research is justified. In vitro cocultures of NLCs with CLL cells more closely reflect the conditions of the microenvironment in pseudo follicles present in tissue infiltrates than in peripheral blood []. Therefore, the local concentration of the CCL3 chemokine in cocultures may be higher than in the blood serum of CLL patients. Sivina and colleagues described association of higher levels of CCL3 with an unfavorable prognosis of CLL patients []. In our research, we have shown positive correlation of CCL3 concentration with known unfavorable prognostic factors such as CD38 expression, ZAP-70, β2-microglobulin concentration, and stage of disease according to Rai classification. In addition, the concentration of CCL3 was significantly higher in patients with non-mutated IGVH gene.
The BIRC5 protein is located mainly in the cytoplasm of the cell but also the secretive form of this protein has been described. This form may affect tumor cells microenvironment []. In the interphase of the cell cycle, the BIRC5 protein is found mainly in the cytoplasm, while in the mitotic phase it changes its location to nuclear reaching the highest concentration before cell division [, ]. Due to its function inside of the cells, the concentration of the secretory form of BIRC5 protein in the blood serum or culture medium may be low. In our studies, the concentration of the secreted form of BIRC5 protein in both the culture medium and in the blood serum was very low.
The results of BIRC5 expression in CLL are consistent. Ganziero and colleagues in their research showed no expression of BIRC5 gene at mRNA and protein level in CLL cells in 80% of patients []. In the same studies, the researchers observed higher expression of the BIRC5 gene in leukemic cells after CD40L ligand stimulation of the CD40 surface molecule []. Purroy et al. [] noted a higher expression of BIRC5 in CCL cells after coculture with microenvironment cells. In addition, Filip and coworkers described higher expression of the BIRC5 gene in CLL lymphocytes after coculture with NLCs cells []. The studies carried out so far suggest the involvement of NLCs in the stimulation of leukemic cells to secrete sBIRC5. In our studies, we showed a difference in concentration of sBIRC5 in blood serum of CLL patients and healthy donors. Ahmed and colleagues showed higher sBIRC5 levels in patients with acute lymphoblastic leukemia (ALL) compared to healthy donors []. Both hematological diseases, ALL and CLL are lymphoproliferative disorders. The concentration of sBIRC5 in ALL shown in Ahmed et al. [] studies was lower compared to our results.
Another factor analyzed in our research was IL-8. Trimarco and coworkers described an increase of IL-8 concentration after coculture of CLL cells with mesenchymal stem cells []. Risnik et al. [] showed that leukemic cells do not produce IL-8. In addition, researchers showed that CLL cells do not express surface CXCR1 and CXCR2 receptors for IL-8 []. The mechanism of IL-8 interaction on CLL cells is more complex. IL-8 may indirectly affect CLL cells by stimulation of other proteins of the microenvironment, which may affect leukemic lymphocytes directly []. In our study, we have demonstrated higher IL-8 concentration in leukemic cell culture medium compared to blood serum from CLL patients. In addition, medium IL-8 concentration correlated positively with the number of NLCs. Yoon and coworkers showed stronger binding of CLL cells to bone marrow stromal cells in the presence of IL-6 and IL-8. They suggested that tested interleukins had an effect on the CLL microenvironment and can act chemotactically on CLL cells []. Several papers demonstrated higher concentration of IL-8 in blood serum from CLL patients compared to healthy donors [, ]. However in our research, we did not observe significant differences in the concentration of IL-8 in blood serum of CLL patients compared to healthy donors. This may be due to small sample size.
We showed a positive association between the number of NLCs cells and sJAG1 concentration in the culture medium. The JAG1 protein is responsible for the activation of the NOTCH1 receptor [, ]. Arruga and coworkers described higher concentration of sJAG1 in the serum of CLL patients compared to the serum of healthy individuals []. In our study, we did not confirm the results obtained by Arruga et al. []. We found lower concentration of sJAG1 molecule in the culture medium compared with the blood serum of CLL patients. Moreover, we observed that the increase of sJAG1 concentration in the blood serum of CLL patients was accompanied by an increase in the percentage of cells expressing the CD5 surface marker. The increase of JAG1 concentration in the culture medium was associated with higher expression of CD38 molecule, which is an unfavorable prognostic factor in the course of CLL.
Boissard and coworkers described the CD163 molecule and its soluble form – sCD163, as a good marker for the assessment of the microenvironment of CLL, especially NLCs []. Researchers showed that the expression level of the CD163 molecule on the NLCs surface correlated with higher proliferation of CLL cells in the lymph nodes []. In addition, they found that the higher concentration of sCD163 was associated with shorter TFS, OS, and with other well-known unfavorable prognostic factors, such as: the presence of the TP53 gene mutation, a complex karyotype and a negative mutation status of IGVH[]. In our research, the sCD163 concentration in the blood serum of CLL patients did not differ significantly from its concentration observed in serum of healthy donors. Similar results were obtained by Nederby and colleagues []. However, Boissard and coworkers described an increase of sCD163 concentration in serum of CLL patients compared to healthy donors []. The reason for these differences in research results may be due to the number of tested individuals. We did not find correlation between the concentration of sCD163 in the culture medium and number of NLCs. In addition, the level of sCD163 in the culture medium was lower compared to the blood serum.
Limitations
A limitation of the study is relatively small sample size. It was due to the fact that only samples with complete clinical, molecular, and cytogenetic data were included in the study. It was not possible to obtain enough material from all patients. The most important part of this study was in vitro coculture of NLCs which required the highest number of patients’ blood cells. In our next study, we plan to extend the study group.
Conclusions
We found higher concentration of serum CCL3 and IL-8 in CLL patients compared to healthy donors. Further, we observed the relationship between CCL3 ex vivo concentration and clinical data analyzed: Rai stage, WBC, and the expression of ZAP-70, CD38, and CD5/CD19. We found higher CCL3, IL-8, and sBIRC in vitro concentration compared to ex vivo condition. sCD163 and sJAG1 in vitro concentration were lower than ex vivo. CCL3 and IL-8 in vitro concentration were significantly associated with number of NLCs.
CCL3 chemokine is a promising factor for further research focused on biology of CLL. The presented results are another step to precisely determine the role of CCL3 in the pathogenesis of CLL. Our results confirm that CCL3 might be an adverse prognostic factor and may influence the course of the disease. May be it should also be considered in the design of new, more effective therapies.
Acknowledgments
The authors are grateful to the patients who participated in this study. We would like to thank Małgorzata Luterek and Barbara Kwiatkowska-Drabik for assistance with cell culture issue, Magdalena Wojcierowska-Litwin for assistance with molecular analysis.
Statement of Ethics
This study protocol was reviewed and approved by Medical University of Lublin Bioethics Committee, approval number KE-0254/99/2015 and KE-0254/155/2010. Written informed consent was obtained from all study participants.
Conflict of Interest Statement
The authors have no conflicts of interest to declare.
Funding Sources
This project was supported by the Medical University of Lublin, Poland (Grants MNsd 233, DS 225, and DS 227).
Author Contributions
Data curation: Sylwia Popek-Marciniec, Dorota Koczkodaj, and Ewa Wąsik-Szczepanek; funding acquisition: Sylwia Popek-Marciniec and Agata Filip; investigation: Sylwia Popek-Marciniec, Szymon Zmorzyński, Dorota Koczkodaj, Michał Marciniec, Agnieszka Karczmarczyk, and Małgorzata Michalak-Wojnowska; methodology: Sylwia Popek-Marciniec, Szymon Zmorzyński, Dorota Koczkodaj, and Małgorzata Michalak-Wojnowska; project administration: Sylwia Popek-Marciniec and Agata Filip; resources: Ewa Wąsik-Szczepanek; supervision: Agata Filip; validation: Michał Marciniec; visualization: Sylwia Popek-Marciniec and Michał Marciniec; writing – original draft: Sylwia Popek-Marciniec; writing – review and editing: Szymon Zmorzyński and Agata Filip.
Data Availability Statement
All data generated or analyzed during this study are included in this article. The article contains clinical data of patients in the form of general characteristics. If it is necessary, the clinical details of individual patients used to support the findings of this study are available from the corresponding author upon request. Further inquiries can be directed to the corresponding author.
References
- 1. Scarfò L, Ferreri AJM, Ghia P Chronic lymphocytic leukaemia Crit Rev Oncol Hemat 2016 Aug 104 169–82
- 2. Döhner H, Stilgenbauer S, Benner A, Leupolt E, Krober A, Bullinger L, et al Genomic aberrations and survival in chronic lymphocytic leukemia N Engl J Med 2000 Dec 28 343 26 1910–6
- 3. Malcikova J, Tausch E, Rossi D, Sutton LA, Soussi T, Zenz T, et al ERIC recommendations for TP53 mutation analysis in chronic lymphocytic leukemia-update on methodological approaches and results interpretation Leukemia 2018 May 32 5 1070–80
- 4. Tsukada N, Burger JA, Zvaifler NJ, Kipps T Distinctive features of “nurselike” cells that differentiate in the context of chronic lymphocytic leukemia Blood 2002 Feb 1 99 3 1030–7
- 5. Ponzoni M, Doglioni C, Caligaris-Cappio F Chronic lymphocytic leukemia: the pathologist’s view of lymph node microenvironment Semin Diagn Pathol 2011 May 28 2 161–6
- 6. Burger JA The CLL cell microenvironment Adv Exp Med Biol 2013 792 25–45
- 7. Burger JA, Tsukada N, Burger M, Zvaifler NJ, Dell’Aquila M, Kipps TJ Blood-derived nurse-like cells protect chronic lymphocytic leukemia B cells from spontaneous apoptosis through stromal cell-derived factor-1 Blood 2000 Oct 15 96 8 2655–63
- 8. Filip AA, Ciseł B, Koczkodaj D, Wąsik-Szczepanek E, Piersiak T, Dmoszyńska A Circulating microenvironment of CLL: are nurse-like cells related to tumor-associated magrophages? Blood Cell Mol Dis 2013 Apr 50 4 263–70
- 9. Burger JA, Quiroga MP, Hartmann E, Bürkle A, Wierda WG, Keating MJ, et al High-level expression of the T-cell chemokines CCL3 and CCL4 by chronic lymphocytic leukemia B cells in nurselike cell cocultures and after BCR stimulation Blood 2009 Mar 26 113 13 3050–8
- 10. Ysebaert L, Fournié JJ Genomic and phenotypic characterization of nurse-like cells that promote drug resistance in chronic lymphocytic leukemia Leuk Lymphoma 2011 52 7 1404–6
- 11. Di Celle PF, Carbone A, Marchis D, Zhou D, Sozzani S, Zupo S, et al Cytokine gene expression in B-cell chronic lymphocytic leukemia: evidence of constitutive interleukin-8 (IL-8) mRNA expression and secretion of biologically active IL-8 protein Blood 1994 Jul 1 84 1 220–8
- 12. Sivina M, Hartmann E, Kipps TJ, Rassenti L, Krupnik D, Lerner S, et al CCL3 (MIP-1α) plasma levels and the risk for disease progression in chronic lymphocytic leukemia Boold 2011 Feb 3 117 5 1662–9
- 13. ten Hacken E, Burger JA Microenvironment dependency in chronic lymphocytic leukemia: the basis for new targeted therapies Pharmacol Ther 2014 Dec 144 3 338–48
- 14. Hartmann EM, Rudelius M, Burger JA, Rosenwald A CCL3 chemokine expression by chronic lymphocytic leukemia cells orchestrates the composition of the microenvironment in lymph node infiltrates Leuk Lymphoma 2016 57 3 563–71
- 15. Wierda W, Johnson MM, Do K, Manshouri T, Dey A, O’Brien S, et al Plasma interleukin 8 level predicts for survival in chronic lymphocytic leukaemia Br J Haematol 2003 Feb 120 3 452–6
- 16. Moller HJ Soluble CD163 Scand J Clin Lab Inv 2012 Feb 72 1 1–13
- 17. Nederby L, Roug A, Knudsen S, Moller HJ, Skovbo A, Hokland M Relevance of sCD163 as a prognostic biomarker in chronic B-cell lymphocytic leukemia Blood 2014 Dec 124 21 5643
- 18. Rosati E, Sabatini R, Rampino G, Tabilio A, Di Ianni M, Fettucciari K, et al Constitutively activated Notch signaling is involved in survival and apoptosis resistance of B-CLL cells Blood 2009 Jan 113 4 856–65
- 19. Necochea-Campion R, Chen CS, Mirshahidi S, Howard FD, Wall NR Clinico-pathologic relevance of survivin splice variant expression in cancer Cancer Lett 2013 Oct 339 2 167–74
- 20. Khan S, Bennit HF, Turay D, Perez M, Mirshahidi S, Yuan Y, et al Early diagnostic value of survivin and its alternative splice variants in breast cancer BMC Cancer 2014 Mar 12 14 176
- 21. Filip AA, Ciseł B, Wąsik-Szczepanek E Guilty bystanders: nurse-like cells as a model of microenvironmental support for leukemic lymphocytes Clin Exp Med 2015 Feb 15 1 73–83
- 22. Hallek M, Cheson BD, Catovsky D, Caligaris-Cappio F, Dighiero G, Döhner H, et al iwCLL guidelines for diagnosis, indications for treatment, response assessment, and supportive management of CLL Blood 2018 Jun 21 131 25 2745–60
- 23. Stamatopoulos K, Agathangelidis A, Rosenquist R, Ghia P Antigen receptor stereotypy in chronic lymphocytic leukemia Leukemia 2017 Feb 31 2 282–91
- 24. Huang SJ, Gillan TL, Gerrie AS, Hrynchak M, Karsan A, Ramadan K, et al Influence of clone and deletion size on outcome in chronic lymphocytic leukemia patients with an isolated deletion 13q in a population-based analysis in British Columbia, Canada Genes Chromosomes Cancer 2016 Jan 55 1 16–24
- 25. Dal Bo M, Rossi FM, Rossi D, Deambrogi C, Bertoni F, Del Giudice I, et al 13q14 deletion size and number of deleted cells both influence prognosis in chronic lymphocytic leukemia Genes Chromosomes Cancer 2011 Aug 50 8 633–43
- 26. Matthews C, Catherwood M, Morris TC, Alexander HD Routine analysis of IgVH mutational status in CLL patients using BIOMED-2 standarized primers and protocols Leuk Lymphoma 2004 Sep 45 9 1899–904
- 27. Mansour MR, Duke V, Foroni L, Patel B, Allen CG, Ancliff PJ, et al Notch-1 mutations are secondary events in some patients with T-cell acute lymphoblastic leukemia Clin Cancer Res 2007 Dec 1 13 23 6964–9
- 28. Fabbri G, Rasi S, Rossi D, Trifonov V, Khiabanian H, Ma J, et al Analysis of the chronic lymphocytic leukemia coding genome: role of NOTCH1 mutational activation J Exp Med 2011 Jul 4 208 7 1389–401
- 29. Puente XS, Pinyol M, Quesada V, Conde L, Ordóñez GR, Villamor N, et al Whole-genome sequencing identifies recurrent mutations in chronic lymphocytic leukaemia Nature 2011 Jun 5 475 7354 101–5
- 30. Landau DA, Carter SL, Stojanov P, McKenna A, Stevenson K, Lawrence MS, et al Evolution and impact of subclonal mutations in chronic lymphocytic leukemia Cell 2013 Feb 14 152 4 714–26
- 31. Trimarco V, Ave E, Facco M, Chiodin G, Frezzato F, Martini V, et al Cross-talk between chronic lymphocytic leukemia (CLL) tumor B cells and mesenchymal stromal cells (MSCs): implications for neoplastic cell survival Oncotarget 2015 Dec 8 6 39 42130–49
- 32. Jaiswal PK, Goel A, Mittal RD Survivin: a molecular biomarker in cancer Indian J Med Res 2015 Apr 141 4 389–97
- 33. Shinohara ET, Gonzalez A, Massion PP, Chen H, Li M, Freyer AS, et al Nuclear survivin predicts recurrence and poor survival in patients with resected nonsmall cell lung carcinoma Cancer 2005 Apr 15 103 8 1685–92
- 34. Granziero L, Ghia P, Circosta P, Gottardi D, Strola G, Geuna M, et al Survivin is expressed on CD40 stimulation and interfaces proliferation and apoptosis in B-cell chronic lymphocytic leukemia Blood 2001 May 1 97 9 2777–83
- 35. Purroy N, Abrisqueta P, Carabia J, Carpio C, Calpe E, Palacio C, et al Targeting the proliferative and chemoresistant compartment in chronic lymphocytic leukemia by inhibiting survivin protein Leukemia 2014 Oct 28 10 1993–2004
- 36. Ahmed MB, Shehata HH, Moussa M, Ibrahim TM Prognostic significance of survivin and tumor necrosis factor-alpha in adult acute lymphoblastic leukemia Clin Biochem 2012 Jan 45 1–2 112–6
- 37. Risnik D, Podaza E, Almejún MB, Colado A, Elías EE, Bezares RF, et al Revisiting the role of interleukin-8 in chronic lymphocytic leukemia Sci Rep 2017 7 1 15714
- 38. Yoon JY, Lafarge S, Dawe D, Lakhi S, Kumar R, Morales C, et al Association of interleukin-6 and interleukin-8 with poor prognosis in elderly patients with chronic lymphocytic leukemia Leuk Lymphoma 2012 Sep 53 9 1735–42
- 39. Arruga F, Gizdic B, Serra S, Vaisitti T, Ciardullo C, Coscia M, et al Functional impact of NOTCH1 mutations in chronic lymphocytic leukemia Leukemia 2014 May 28 5 1060–70
- 40. Boissard F, Laurent C, Ramsay AG, Quillet-Mary A, Fournié JJ, Poupot M, et al Nurse-like cells impact on disease progression in chronic lymphocytic leukemia Blood Cancer J 2016 Jan 15 6 1 e381