Introduction
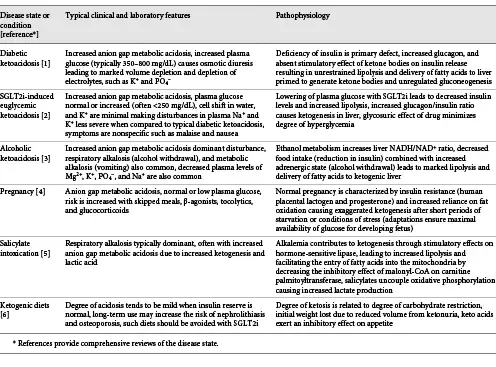
Ketoacidosis develops when caloric intake is insufficient to meet normal metabolic demands. Imbalances in fuel utilization can lead to ketosis in chronic illness where anorexia coexists with increased catabolism. Other causes of ketoacidosis include diabetic ketoacidosis, alcoholic ketoacidosis, salicylate intoxication, SGLT2 inhibitor therapy, and calorie sufficient but carbohydrate-restricted diets [-]. Familiarity with the pathophysiology and metabolic consequences of ketogenesis is critical, given the potential for the clinician to encounter one of these conditions. This review describes the metabolic changes that occur when an otherwise normal individual undergoes fasting over an extended period of time. These changes can be sequentially categorized into the postabsorptive, gluconeogenic, and conservation of protein phase.
Postabsorptive Phase
In the first 24 h of fasting, completion of dietary glucose absorption leads to a fall in blood glucose levels, signaling a decrease in circulating insulin and an increase in glucagon levels. Glucagon stimulates the release of glucose from glycogen stores in the liver, while the fall in insulin decreases transport of glucose into the skeletal muscle and adipose tissues ensuring an adequate amount of blood glucose is available for the brain where it is completely oxidized to carbon dioxide and water []. This response also provides the necessary fuel for tissues that are exclusively glycolytic, such as erythrocytes, the kidney medulla, and bone marrow (Fig. 1).
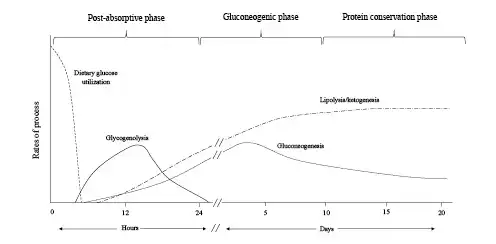
Fig. 1
Fuel source utilization in the 3 phases of starvation.
Glycogenolysis in the liver is derived from its typical reserve of 70 g and provides about 75% of the glucose requirements in the postabsorptive phase. Glucose-6-phosphatase in the liver removes the phosphate group from glucose-6 phosphate generating free glucose, which is released into the bloodstream for uptake by other cells []. Glycogen is also stored in the skeletal muscle, but due to the lack of glucose-6-phosphatase, muscle glycogen must first be metabolized to lactate, which is then released into the circulation and resynthesized into glucose by the liver via the Cori cycle. Approximately 10–15% of the remaining glucose requirement in this phase is derived from gluconeogenesis utilizing lactate and pyruvate as substrates. Glycerol, a by-product of hydrolysis of triglycerides, also serves as a gluconeogenic precursor []. While the Cori cycle does not result in net production of glucose, early reliance on this pathway allows glucose to be synthesized primarily from nonprotein precursors keeping proteolysis at a minimum during this early phase of food deprivation.
Reduced insulin levels activate lipolysis making fatty acids available to serve as an alternative fuel for the skeletal muscle in the later stages of the postabsorptive phase. Oxidation of fatty acids generates acetyl CoA, which exerts an inhibitory effect on pyruvate dehydrogenase []. This effect ensures the small quantity of remaining glucose taken up by the skeletal muscle does not undergo complete oxidation in the citric acid cycle but is preferentially metabolized to pyruvate and lactate, which are then converted back to glucose in the liver. Fatty acid mobilization and oxidation in the liver provide the energy to fuel glucose production since there is a net consumption of 4 ATP molecules for each molecule of glucose synthesized via the Cori cycle. The early reliance on the Cori cycle activity in the postabsorptive state conserves protein by sparing the need for amino acid precursors for gluconeogenesis.
Gluconeogenic Phase
As glycogen stores become exhausted after 24 h of fasting, patients enter a gluconeogenic phase where substantial amounts of gluconeogenic precursors derived from amino acids are added to lactate, pyruvate, and glycerol, to meet cerebral glucose requirements (Fig. 1). A persistent decrease in insulin levels promotes proteolysis in the muscle, providing the needed supply of substrate for increasing hepatic gluconeogenesis. Alanine and glutamine are the most abundant amino acids released by the skeletal muscle. Despite alanine constituting only about 7–10% of amino acid residues in the skeletal muscle, it accounts for 30–40% of amino acids released from the muscle during this phase [-]. The plasma concentration of branch chain amino acids (leucine, isoleucine, and valine) increases early in fasting and peaks at approximately day 5 []. These amino acids are preferentially catabolized in the skeletal muscle to their α-keto acids by transamination of pyruvate and serve as the primary precursor for generation of alanine. Alanine is released by skeletal muscle and after uptake in the liver; the carbon skeleton is converted to glucose while the amino group is converted to urea and excreted in the urine. This alanine-glucose cycle transfers the amino groups of branched-chain amino acids to the liver without increasing blood ammonia levels and provides control points for feedback inhibition of gluconeogenesis. For example, increased concentrations of keto acids exert an inhibitory effect on gluconeogenesis by decreasing the degradation of branch chain amino acids thereby removing a source of nitrogen for alanine synthesis [-]. In addition, insulin exerts an inhibitory effect on alanine uptake by the liver, providing an additional moderating effect on gluconeogenesis [].
The carbon skeleton for glutamine synthesis comes from amino acids such as glutamate, aspartate, valine, and isoleucine. Glutamine serves as a major energy-yielding fuel for rapid turnover of cells in the mucosa of the intestine and cells of the immune system. Some of the glutamine taken up by the intestine is only partially oxidized in order to provide additional alanine for hepatic gluconeogenesis [, ]. Glutamine is also the primary substrate for gluconeogenesis in the kidney where production of ammonia as a by-product serves a major role in maintenance of acid-base balance [].
The flux of fatty acids to the liver continues to increase during the gluconeogenic phase and is primarily directed to generation of ketone bodies. Increased glucagon leads to activation of 5′ adenosine monophosphate-activated protein which inhibits the activity of acetyl-CoA carboxylase and simultaneously activates malonyl-CoA decarboxylase [, ] (Fig. 2). The fall in malonyl-CoA activates carnitine palmitoyltransferase-I, facilitating the entry of fatty acyl groups into the mitochondria. Normally, acetyl CoA generated from hepatic β-oxidation of fatty acids undergoes complete oxidation in the citric acid cycle, followed by the electron transport chain to produce ATP. Since the liver can only produce ATP in an amount equal to what can be utilized, production of keto acids serves as an overflow pathway for the large quantity of acetyl CoA produced []. Depletion of oxaloacetate due to increased gluconeogenesis also favors ketogenesis, since this substrate is essential for acetyl CoA to enter the citric acid cycle. In addition, accumulation of acetyl CoA ensures pyruvate is utilized as a substrate for gluconeogenesis by exerting an inhibitory effect on pyruvate dehydrogenase [].
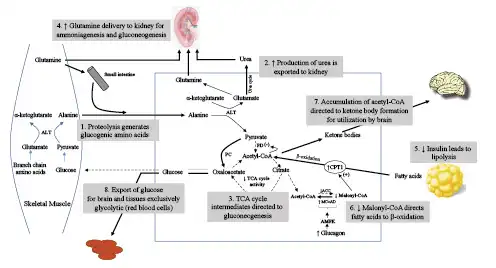
Fig. 2
Elucidation of the primary metabolic pathways during the gluconeogenic and transition to conservation of protein phases of starvation. Following the depletion of glycogen, skeletal muscle, alanine, and glutamine become the major source for glucose homeostasis. In skeletal muscle, alanine transaminase converts L-glutamate and pyruvate into α-ketoglutarate and L-alanine. The resulting L-alanine is shuttled to the liver where the amino group is used for urea synthesis, and the residual pyruvate is used for gluconeogenesis via conversion to oxaloacetate. Initially, the principal site of glutamine metabolism is the small intestine where active shedding of intestinal cells activates purine synthesis creating a high demand for glutamine uptake. A by-product of intestinal glutamine metabolism is additional alanine that is delivered to the liver. Beginning in the gluconeogenic phase and increasing into the conservation of protein phase, glutamine metabolism shifts to the kidney for gluconeogenesis and production of NH4+ to serve as the counterion for excretion of ketoacid anions. Decreased urine urea and increased urine ammonium excretion reflect this shift in gluconeogenesis from the liver to kidney. Reduced insulin levels promote lipolysis and delivery of fatty acids to the liver, while increased glucagon through activation of AMPK causes diminished levels of malonyl-CoA. These changes direct fatty acids to undergo β-oxidation and formation of ketone bodies. Increasing utilization of ketone bodies by the brain spares glucose for exclusively glycolytic tissues, such as red blood cells, bone marrow, and the kidney medulla. ALT, alanine aminotransferase; PC, pyruvate carboxylase; PD, pyruvate decarboxylase; TCA, tricarboxylic acid cycle; ACC, Acetyl CoA carboxylase; MCoAD, malonyl-CoA decarboxylase; AMPK, 5′ adenosine monophosphate-activated protein.
Conservation of Protein Phase
The conservation of protein phase is characterized by a transition in fuel preference necessitated by a need to conserve blood glucose and spare protein from continual degradation. During this phase, there is an enhanced production of ketone bodies which are used to fuel the brain in substitution for glucose []. Brain utilization of glucose falls from 120 g per day in the first 24 h of food deprivation to approximately 40 g per day after several weeks of starvation [, ]. Muscle protein breakdown decreases from 75 to approximately 20 g per day primarily due to diminished release of alanine from muscle [, ]. Ketone bodies directly inhibit muscle proteolysis and contribute to adaptation to prolonged fasting [, ] (Fig. 3). Lactate, pyruvate, and glycerol released during lipolysis provide the substrate for remaining glucose production by the liver. Glucose utilization continues in red blood cells, the bone marrow, and kidney medulla, which rely solely on glucose for energy production through glycolysis. Glucose metabolism in these exclusively glycolytic tissues is limited to production of pyruvate and lactate, which are resynthesized into glucose by the liver via the Cori cycle. Approximately 40 g of glucose/day is recycled by this process and notably requires no protein breakdown. Reductions in hepatic gluconeogenesis are paralleled by a significant increase in kidney gluconeogenesis. Increased glutamine extraction by the proximal tubule generates ammonia which serves as a counter anion for urinary excretion of ketoacid salts, while the remaining carbon chain is used for glucose production and production of ATP [] (Fig. 4). This process generates new bicarbonate to offset the bicarbonate consumed in buffering ketoacid production. When bicarbonate is given to prolonged-starved patients in an amount to correct systemic acidosis, urinary nitrogen excretion significantly decreases [, ]. This response suggests acid-base considerations are equal to, if not more important, than glucose production in driving glutamine uptake by the kidney.
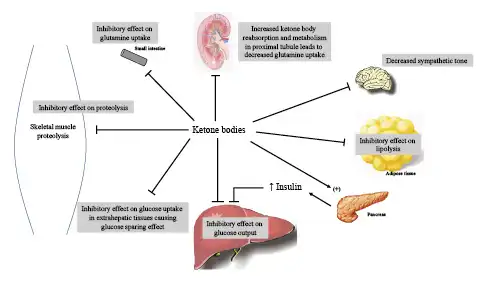
Fig. 3
Control points for feedback inhibition of ketone bodies on gluconeogenesis, proteolysis, and ketogenesis. In addition to exerting negative feedback signals, ketone bodies stimulate insulin release from the pancreatic beta cells, which in turn exerts an inhibitory effect on alanine uptake by the liver, providing an additional moderating effect on gluconeogenesis. Ketone bodies also participate in the reduction in blood pressure and metabolic rate that typically occurs with prolonged fasting by decreasing sympathetic tone through receptors in sympathetic ganglia.
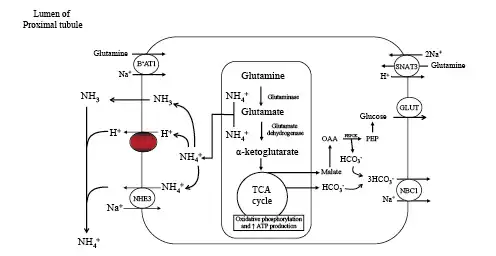
Fig. 4
Kidney proximal tubular catabolism of glutamine. The development of acidosis during starvation leads to increased extraction and catabolism of glutamine by the proximal tubule. Acidosis upregulates the apical and basolateral uptake of glutamine and the mitochondrial enzymes that facilitate metabolism of glutamine. The net effect is increased ammoniagenesis, gluconeogenesis, ATP production, and net synthesis of HCO3−. Glucose and HCO3− are transported across the basolateral membrane into the systemic circulation. NBC1, Na+/3HCO3− cotransporter; SNAT3, basolateral glutamine transporter; BoAT1, Na+-dependent neutral amino acid cotransporter; NHE3, apical Na+/H+ exchanger; TCA, tricarboxylic acid cycle; GLUT, glucose transporter; PEPCK, phosphoenolpyruvate carboxykinase.
The transition from liver to kidney as the predominant site of gluconeogenesis is reflected by changes in urine nitrogen excretion products. High urine urea excretion is present early on and then progressively decreases, while ammonia becomes the predominant nitrogenous product []. While these changes reflect reductions in muscle protein breakdown, they also provide the means to prevent oliguira. Given that each molecule of urea is synthesized from 2 NH4+ and 2 HCO3− ions, urinary excretion of NH4+ coupled to β-hydroxybutyrate provides 4 times the number of osmoles compared to urea []. According to one calculation, 75% less protein catabolism is required to provide the needed osmoles (NH4-β-hydroxybutyrate as compared to urea) to maintain a daily urine output of 500 mL at a urine concentration of 600 mOsm/kg H2O []. In the absence of a hot or dry environment, the nitrogen-sparing effect of prolonged starvation could reduce the osmotic excretory load sufficiency to require only 100–200 mL/day urine output, permitting survival with the 200–300 mL/day of water produced by metabolism with minimal additional water intake [].
Within the protein conservation phase, hepatic production of ketone bodies will eventually lead to equal utilization in brain, muscle, and kidney, minus a small amount excreted in the urine. In this steady state, starvation ketosis is characterized by a plasma bicarbonate concentration of approximately 18 mEq/L, a β-hydroxybutyrate concentration of 8–10 mmol/L, and a normal-to-low plasma glucose concentration. While plasma insulin levels are reduced, there remains a sufficient amount of insulin to prevent excessive mobilization of fatty acids. Ketone bodies play a major role in establishing this new equilibrium by exerting a direct stimulatory effect on insulin release combined with direct inhibitory effects on lipolysis in adipocytes [, , ] (Fig. 3). Keto acids and fatty acids progressively substitute for glucose as the preferred fuel for both skeletal and cardiac muscle as starvation progresses into the protein conservation phase. Eventually, free fatty acid utilization becomes dominant, sparing keto acids for the brain, as uptake of acetoacetate by muscle is returned back to the blood as β-hydroxybutyrate, signifying a more reduced redox potential in muscle mitochondria secondary to fatty acids oxidation []. This reduced state has also been linked to a reduction in muscle proteolysis adding to the nitrogen-sparing effect of keto acids in skeletal muscle []. Cahill hypothesized the preference for ketoacid utilization by the brain is directly correlated to the brain/carcass ratio across species since the brain preferentially utilizes keto acids, as opposed to preferential use of fatty acids by the carcass []. Table 1 summarizes other clinical conditions characterized by ketoacidosis.
Kidney’s Role in Starvation
The kidney plays a critical role in the steady state achieved during the protein conservation phase. At low plasma concentrations, filtered ketone bodies are completely reabsorbed by the saturable Na+-coupled monocarboxylate transporters SMCT1 (SLC5A8) and SMCT2 (SLC5A12) in the proximal tubule [, ] (Fig. 5). Ketonuria develops as plasma levels rise and the filtered load of ketoacid salt increases. The loss of Na+ coupled acetoacetate and β-hydroxybutyrate in the first of several days of fasting results in negative Na+ balance and is the mechanism responsible for the rapid initial weight loss which occurs in the first days of total fasting [, ]. The urine Cl− concentration is low during this time and reflects the contraction of extracellular fluid volume. As ammoniagenesis increases, NH4+ replaces Na+ as the obligate cation accompanying organic acid salt excretion. At this point, urinary Na+ and Cl− are both low reflective of increased proximal reabsorption in response to volume contraction (Table 2). Decreased distal Na+ delivery limits K+ loss from the body even though circulating levels of mineralocorticoid are increased. Decreased Na+ delivery also decreases distal H+ secretion, which along with increased urine NH4+ causes urine pH to be more alkaline, thereby lessening the risk of uric acid precipitation [, ].
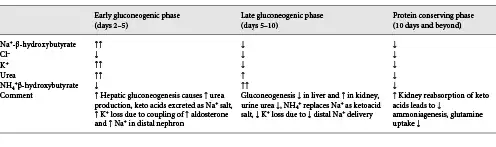
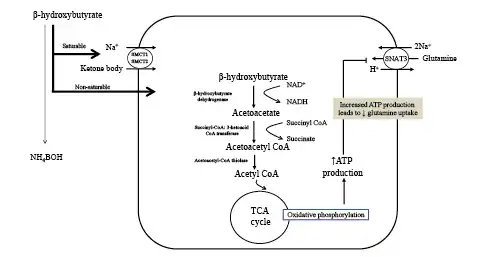
Fig. 5
Ketone body uptake and oxidation in the proximal tubule provides a protein-sparing effect by way of ATP turnover. Metabolism of glutamine to NH4+ and HCO3− results in production of ATP (see Fig. 4). Since ATP is not stored and kidney production must equal utilization, the additional ATP produced from increasing uptake and subsequent oxidation of ketone bodies exert a suppressive effect on ammoniagenesis and glutamine uptake. Acid-base balance is maintained since oxidation of ketone bodies regenerates an amount of HCO3− equal to what was consumed in their production. In addition, the suppressive effect on ammoniagenesis and requirement for glutamine uptake results in less proteolysis and provides a protein-sparing effect as one transitions into the conservation of protein phase. SMCT, sodium-coupled monocarboxylate transporter; TCA, tricarboxylic acid cycle; SNAT3, basolateral glutamine transporter; NAD+, nicotinamide adenine dinucleotide; NADH, reduced nicotinamide adenine dinucleotide.
Concentrations of β-hydroxybutyrate progressively increase following sustained fasting. By contrast, urinary losses peak after 3–4 days then slightly fall as fasting extends into the protein conservation phase, suggesting the absence of a tubular max for reabsorption [, , ]. The precise mechanism to account for these findings has not been defined. A saturable low capacity tubular secretory process mediated by organic anion transporters on the basolateral surface of the tubule has been proposed as a mechanism for the persistent urinary excretion of β-hydroxybutyrate [].
The increased capacity for reabsorption of filtered ketone bodies is an adaptive response during starvation for several reasons. First, minimizing the urinary loss prevents loss of potential metabolic fuel, since ketone bodies furnish a significant amount of the caloric requirements during fasting. In prolonged starvation kidney reabsorption of ketone bodies spares approximately 225 kcal/day, which would otherwise be lost in the urine []. Second, kidney reabsorption of ketone bodies exerts an inhibitory effect on ammoniagenesis (Fig. 5). Infusion of β-hydroxybutyrate reduces kidney NH4+ production in dogs and humans with chronic metabolic acidosis [-]. This effect is in addition to reductions in the glomerular filtration rate and lower filtered load of Na+ []. Decreased ammoniagenesis reduces the need for glutamine uptake by the kidney minimizing protein breakdown, potentially conserving as much as 7 g of nitrogen per day []. Last, reabsorption and subsequent oxidation of ketone bodies in the kidney regenerates consumed HCO3− thereby lessening the degree of acidosis that otherwise occurs if lost in the urine as a Na+ or K+ salt.
Natriuresis
Weight loss in the first 1–5 days of fasting ranges from 1 to 2 kg per day and gradually slows to an average of 0.3 kg per day over the subsequent 3 weeks. The rapid initial weight loss is primarily due to salt and water diuresis [-]. Increased skeletal muscle efficiency slows subsequent weight loss by reducing the caloric cost of muscle contraction [reviewed in ref.]. The negative Na+ balance in subjects who fast for several days is nearly 350 mmol as compared to a Na+ loss of 150 mmol in subjects eating a diet virtually free of Na+ []. An obligatory loss of Na+ due to increased generation and urinary excretion of ketone bodies is primarily caused by a natriuretic response in early fasting. As discussed earlier, the magnitude of natriuresis begins to decrease as ammoniagenesis increases, allowing NH4+ to replace Na+ as the major urinary cation. The development of acidemia contributes to the early natriuretic response since metabolic acidosis exerts an inhibitory effect on proximal Na+ reabsorption []. The rise in glucagon and fall in insulin levels have been implicated in the natriuresis of early fasting. Infusion of physiological levels glucagon to nonfasting subjects produces a natriuretic response similar to what is observed in fasting subjects []. Decreased insulin levels have been implicated since insulin normally stimulates proximal Na+ reabsorption []. Refeeding with carbohydrate, even if the diet is hypocaloric, produces an abrupt reversal of salt and water loss and leads to an immediate gain in weight []. In some cases, this response is associated with Na+ retention and development of clinically detectable edema. Decreased glucagon and increased insulin have been implicated in this response. Isocaloric refeeding with fat does not produce this effect, while protein refeeding causes a delayed and less robust antinatriuretic effect [].
Another potential complication of carbohydrate refeeding is development of metabolic alkalosis []. Provision of carbohydrate leads to cessation of hepatic ketogenesis, while peripheral ketone body metabolism regenerates HCO3−. While this response should return the plasma HCO3− concentration to near normal, in some individuals, new bicarbonate is generated, causing development of mild metabolic alkalosis. A persistent increase in proximal ammoniagenesis with continued increased kidney acid excretion due to tubular hypertrophy may be the cause. Metabolism of retained ketoacid anions returns HCO3− concentrations to higher than normal since kidney NH4+ excretion exceeds the rate of ketoacid excretion. Na+ retention following provision of carbohydrate along with increased insulin levels increases the HCO3− reabsorptive capacity of the proximal tubule and provides a mechanism to maintain the alkalosis []. Refeeding metabolic alkalosis tends to be mild and spontaneously resolves several days following refeeding as ammoniagenesis decreases.
Potassium Homeostasis during Starvation
Subjects fasting for 1 week develop a K+ deficit of approximately 300 mmol [, ]. This early kaliuretic effect is due to coupling of increased circulating aldosterone levels due to a contraction of extracellular fluid volume with increased distal delivery of Na+ secondary to the nonreabsorbable anion effect of ketoacid salt excretion. After several days of starvation, the degree of kidney K+ excretion decreases to a low rate, averaging 19 mEq/day over 1 month of fasting. This decline is due to a reduction in Na+ delivery to the distal nephron as NH4+ increasingly replaces Na+ as the obligate cation for ketoacid salt excretion. In addition, altered tubular function in the distal nephron secondary to effects of angiotensin II participate in minimizing K+ secretion [] (Fig. 6). These effects allow for increased levels of aldosterone to participate in maximal conservation of Na+ and Cl− without worsening the deficit in total body K+ content. The plasma K+ concentration typically declines but rarely falls below 3.0 mEq/L with prolonged starvation.
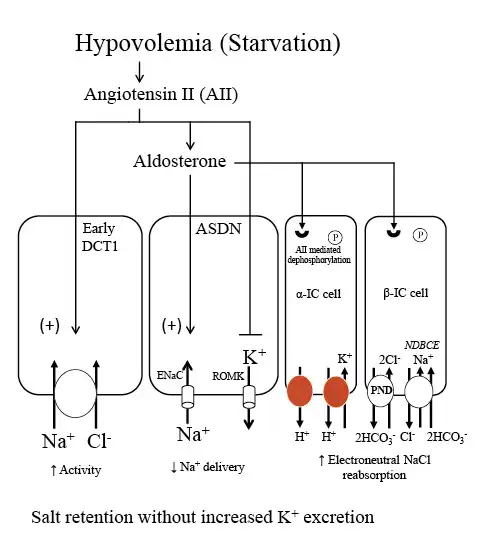
Fig. 6
NaCl and K+ handling in the distal nephron under conditions of increased aldosterone due to volume depletion. During starvation, contraction of extracellular fluid volume leads to increases in both AII and aldosterone. AII has a number of effects that provide a mechanism to maximally conserve salt and minimize K+ secretion. AII stimulates proximal Na+ reabsorption and the Na+-Cl− cotransporter in the early DCT1, thereby reducing Na+ delivery to downstream segments. In the ASDN, AII exerts an inhibitory effect on ROMK and along with aldosterone stimulates ENaC activity. Additionally, AII leads to dephosphorylation of the mineralocorticoid receptor in intercalated cells. This effect permits aldosterone to activate the apical proton pumps (H+-ATPase and H+-K+-ATPases) and the Cl−/HCO3− exchanger, pendrin, in intercalated cells, and stimulate electroneutral NaCl transport. The net result is stimulation of NaCl reabsorption with minimal effect on K+ secretion, a response appropriate for the starving patient with reduced total body K+ and volume depletion. ENaC, epithelial sodium channel; NDBCE, Na+-driven bicarbonate/Cl− exchanger; PND, pendrin; ROMK, renal outer medullary potassium channel; IC, intercalated cell; AII, angiotensin II; DCT1, distal convoluted tubule; ASDN, aldosterone sensitive distal nephron.
Uric Acid
Under normal circumstances, 400–450 mg of uric acid is excreted per day []. Urine pH decreases in the early stages of starvation as developing acidosis stimulates H+ secretion in the distal nephron. This effect creates a risk factor for uric acid precipitation since uric acid solubility is poor in acid urine given the pKa of approximately 5.7. This risk is mitigated by several factors during the course of starvation. First, the initial diuresis of starvation increases urine volume and helps to maintain uric acid at a concentration less than its solubility product. Second, as circulating levels of β-hydroxybutyrate increase, uric acid excretion into the urine decreases since both substances compete for the same kidney transport sites []. Third, the subsequent decrease in urinary Na+ excretion accompanied by a progressive increase in urinary NH4+ excretion serves to attenuate the drop in urine pH [].
Sexual Dimorphism in Starvation Ketosis
Sex-based differences in substrate metabolism may explain the more rapid development in fasting ketosis reported in women [, ]. While men and women do not differ in the percent of energy derived from carbohydrate or fat at rest, women utilize a greater percentage of fatty acids as a primary energy substrate following exercise, fasting, and other metabolic stressors when compared to men []. Estrogens may account for this difference, as there are data to suggest estrogens promote lipolysis, enhance autonomic nerve activity, and regulate key enzymes in lipolytic pathways []. Additionally, in women lipolysis is mediated by β-adrenergic receptors, whereas in men, there is stimulation of not only β-adrenergic receptors but also α-adrenergic receptors, which attenuates lipolysis []. It is important to note, women are at enhanced susceptibility to ketoacidosis due to their enhanced lipolysis putting them at greater risk for euglycemic ketoacidosis following SGLT2i therapy [].
Glucagon levels are higher in nonobese fasting women than men contributing to the greater degree of fasting ketosis []. Increased lipolysis will liberate a greater amount of glycerol replacing alanine as a preferred gluconeogenic substrate. Circulating levels of amino acids, including alanine, are reduced in fasting women when compared to men. Changes in substrate preference may represent an evolutionary adaptation designed to facilitate transfer of amino acids from the mother to the developing fetus, as opposed to being utilized for gluconeogenesis by the mother.
Sex-based differences in the ketogenic response to fasting disappear with increasing body weight []. This loss of sex difference may be related to both higher basal and fasting levels of insulin typical of obesity since maximal mobilization of fatty acids occurs when insulin levels are reduced.
Conclusion
The body adapts to long-term fasting by conserving nitrogen as the brain increasingly utilizes keto acids, sparing the need for glucose. Shifts in fuel utilization decrease the need for mobilization of amino acids from muscle, thus providing a means to conserve protein. Systemic adaptations to starvation are reflected by changes in the urine chemistry profile. The remarkable ability of the body to adapt to long-term starvation has been critical for survival of primitive man. It is critical to note much of the original work on ketosis referenced here and done by Cahill and colleagues was conducted in individuals who were obese. The timing of the phases and stages of the ketotic process may differ in individuals who are lean and/or who lack body adiposity. An appreciation of these processes can provide the clinician better insight into many clinical conditions characterized by ketoacidosis.
Conflict of Interest Statement
There are no conflicts of interest or financial support to disclose for either author.
Funding Sources
There is no monetary support for the preparation of this manuscript for either author.
Author Contributions
The authors contributed equally to the writing of this manuscript.
References
- 1. Palmer BF, Clegg DJ. Electrolyte and acid-base disturbances in patients with diabetes mellitus. N Engl J Med. 2015;373(6):548–59.http://dx.doi.org/10.1056/nejmra1503102.
- 2. Palmer BF, Clegg DJ. Euglycemic ketoacidosis as a complication of SGLT2 inhibitor therapy. Clin J Am Soc Nephrol. 2021 Feb 9. (Epub before Press).
- 3. Palmer BF, Clegg DJ. Electrolyte disturbances in patients with chronic alcohol-use disorder. N Engl J Med. 2017;377(14):1368–77.http://dx.doi.org/10.1056/NEJMra1704724.
- 4. Metzger BE, Ravnikar V, Vileisis RA, Freinkel N. “Accelerated starvation” and the skipped breakfast in late normal pregnancy. Lancet. 1982;1:588–92.http://dx.doi.org/10.1016/s0140-6736(82)91750-0.
- 5. Palmer BF, Clegg DJ. Salicylate toxicity. N Engl J Med. 2020;382(26):2544–55.http://dx.doi.org/10.1056/NEJMra2010852.
- 6. Shah P, Isley WL. Ketoacidosis during a low-carbohydrate diet. N Engl J Med. 2006;354(1):97–8.http://dx.doi.org/10.1056/NEJMc052709.
- 7. Ramnanan CJ, Edgerton DS, Kraft G, Cherrington AD. Physiologic action of glucagon on liver glucose metabolism. Diabetes Obes Metab. 2011;13(Suppl 1):118–25.http://dx.doi.org/10.1111/j.1463-1326.2011.01454.x.
- 8. Schaftingen E, Gerin I. The glucose-6-phosphatase system. Biochem J. 2002;362(Pt 3):513–32.
- 9. Wang Y, Kwon H, Su X, Wondisford FE. Glycerol not lactate is the major net carbon source for gluconeogenesis in mice during both short and prolonged fasting. Mol Metab. 2020;31:36–44.http://dx.doi.org/10.1016/j.molmet.2019.11.005.
- 10. BehalBuxton RD, Robertson J, Olson M. Regulation of the pyruvate dehydrogenase multienzyme complex. Annu Rev Nutr. 1993;13:497–520.
- 11. Felig P. Amino acid metabolism in man. Annu Rev Biochem. 1975;44:933–55.http://dx.doi.org/10.1146/annurev.bi.44.070175.004441.
- 12. Felig P, Owen OE, Wahren J, Cahill GF Jr. Amino acid metabolism during prolonged starvation. J Clin Invest. 1969;48(3):584–94.http://dx.doi.org/10.1172/JCI106017.
- 13. Felig P, Wahren J, Sherwin R, Palaiologos G. Amino acid and protein metabolism in diabetes mellitus. Arch Intern Med. 1977;137(4):507–13.http://dx.doi.org/10.1001/archinte.1977.03630160069014.
- 14. Thompson JR, Wu G. The effect of ketone bodies on nitrogen metabolism in skeletal muscle. Comp Biochem Physiol B. 1991;100(2):209–16.http://dx.doi.org/10.1016/0305-0491(91)90363-i.
- 15. Robinson AM, Williamson DH. Physiological roles of ketone bodies as substrates and signals in mammalian tissues. Physiol Rev. 1980;60(1):143–87.http://dx.doi.org/10.1152/physrev.1980.60.1.143.
- 16. Henry RR, Brechtel G, Lim KH. Effects of ketone bodies on carbohydrate metabolism in non-insulin-dependent (type II) diabetes mellitus. Metab Clin Exp. 1990;39(8):853–8.http://dx.doi.org/10.1016/0026-0495(90)90132-v.
- 17. Hanson PJ, Parsons DS. Factors affecting the utilization of ketone bodies and other substrates by rat jejunum: effects of fasting and of diabetes. J Physiol. 1978;278:55–67.http://dx.doi.org/10.1113/jphysiol.1978.sp012292.
- 18. Qian K, Zhong S, Xie K, Yu D, Yang R, Gong DW. Hepatic ALT isoenzymes are elevated in gluconeogenic conditions including diabetes and suppressed by insulin at the protein level. Diabetes Metab Res Rev. 2015;31(6):562–71.http://dx.doi.org/10.1002/dmrr.2655.
- 19. Marliss EB, Aoki TT, Pozefsky T, Most AS, Cahill GF. Muscle and splanchnic glutmine and glutamate metabolism in postabsorptive andstarved man. J Clin Invest. 1971;50(4):814–7.http://dx.doi.org/10.1172/JCI106552.
- 20. Watford M. Glutamine metabolism in rat small intestine: synthesis of three-carbon products in isolated enterocytes. Biochim Biophys Acta. 1994;1200(1):73–8.http://dx.doi.org/10.1016/0304-4165(94)90029-9.
- 21. Ross BD, Espinal J, Silva P. Glucose metabolism in renal tubular function. Kidney Int. 1986;29(1):54–67.http://dx.doi.org/10.1038/ki.1986.8.
- 22. Angin Y, Beauloye C, Horman S, Bertrand L. Regulation of carbohydrate metabolism, lipid metabolism, and protein metabolism by AMPK. Exp Suppl. 2016;107:23–43.http://dx.doi.org/10.1007/978-3-319-43589-3_2.
- 23. Saha AK, Ruderman NB. Malonyl-CoA and AMP-activated protein kinase: an expanding partnership. Mol Cell Biochem. 2003;253(1–2):65–70.http://dx.doi.org/10.1023/a:1026053302036.
- 24. Jungas RL, Halperin ML, Brosnan JT. Quantitative analysis of amino acid oxidation and related gluconeogenesis in humans. Physiol Rev. 1992;72(2):419–48.http://dx.doi.org/10.1152/physrev.1992.72.2.419.
- 25. Owen OE, Morgan AP, Kemp HG, Sullivan JM, Herrera MG, Cahill GF. Brain metabolism during fasting. J Clin Invest. 1967;46(10):1589–95.http://dx.doi.org/10.1172/JCI105650.
- 26. Cahill GF Jr, Owen OE. Starvation and survival. Trans Am Clin Climatol Assoc. 1968;79:13–20.
- 27. Cahill G. Fuel metabolism in starvation. Annu Rev Nutr. 2006;26:1–22.http://dx.doi.org/10.1146/annurev.nutr.26.061505.111258.
- 28. Madison LL, Mebane D, Unger RH, Lochner A. The hypoglycemic action of ketones. II. Evidence for a stimulatory feedback of ketones on the pancreatic beta cells. J Clin Invest. 1964;43(3):408–15.http://dx.doi.org/10.1172/JCI104925.
- 29. Halperin ML, Jungas RL. Metabolic production and renal disposal of hydrogen ions. Kidney Int. 1983;24(6):709–13.http://dx.doi.org/10.1038/ki.1983.217.
- 30. Féry F, Balasse EO. Differential effects of sodium acetoacetate and acetoacetic acid infusions on alanine and glutamine metabolism in man. J Clin Invest. 1980;66(2):323–31.http://dx.doi.org/10.1172/jci109860.
- 31. Hannaford MC, Leiter LA, Josse RG, Goldstein MB, Marliss EB, Halperin ML. Protein wasting due to acidosis of prolonged fasting. Am J Physiol. 1982;243(3):E251–6.http://dx.doi.org/10.1152/ajpendo.1982.243.3.E251.
- 32. Kamel SK, Lin SH, Cheema-Dhadli S, Marliss EB, Halperin ML. Prolonged total fasting: a feast for the integrative physiologist. Kidney Int. 1998;53(3):531–9.http://dx.doi.org/10.1046/j.1523-1755.1998.00803.x.
- 33. Cahill GF. President’s address. Starvation. Trans Am Clin Climatol Assoc. 1983;94:1–21.
- 34. Björntorp P, Scherstén T. Effect of beta-hydroxybutyrate on lipid mobilization. Am J Physiol. 1967;212(3):683–7.http://dx.doi.org/10.1152/ajplegacy.1967.212.3.683.
- 35. Aoki TT, Finley RJ, Cahill GF. The redox state and regulation of amino acid metabolism in man. Biochem Soc Symp. 1978;43:17–29.
- 36. Gopal E, Fei YJ, Sugawara M, Miyauchi S, Zhuang L, Martin P, et al. Expression of slc5a8 in kidney and its role in Na(+)-coupled transport of lactate. J Biol Chem. 2004;279(43):44522–32.http://dx.doi.org/10.1074/jbc.M405365200.
- 37. Gopal E, Umapathy NS, Martin PM, Ananth S, Gnana-Prakasam JP, Becker H, et al. Cloning and functional characterization of human SMCT2 (SLC5A12) and expression pattern of the transporter in kidney. Biochim Biophys Acta. 2007;1768(11):2690–7.http://dx.doi.org/10.1016/j.bbamem.2007.06.031.
- 38. Sapir DG, Owen OE. Renal conservation of ketone bodies during starvation. Metab Clin Exp. 1975;24:23–33.http://dx.doi.org/10.1016/0026-0495(75)90004-9.
- 39. Owen OE, Caprio S, Reichard GA Jr, Mozzoli MA, Boden G, Owen RS. Ketosis of starvation: a revisit and new perspectives. Clin Endocrinol Metab. 1983 Jul;12(2):359–79.http://dx.doi.org/10.1016/s0300-595x(83)80046-2.
- 40. Batlle DC, von Riotte A, Schlueter W. Urinary sodium in the evaluation of hyperchloremic metabolic acidosis. N Engl J Med. 1987;316(3):140–4.http://dx.doi.org/10.1056/NEJM198701153160305.
- 41. Barac-Nieto M. Renal reabsorption and utilization of hydroxybutyrate and acetoacetate in starved rats. Am J Physiol. 1986;251(2 Pt 2):F257–65.http://dx.doi.org/10.1152/ajprenal.1986.251.2.F257.
- 42. Wang K, Kestenbaum B. Proximal tubular secretory clearance: a neglected partner of kidney function. Clin J Am Soc Nephrol. 2018;13(8):1291–6.http://dx.doi.org/10.2215/CJN.12001017.
- 43. Desir G, Bratusch-Marrain P, DeFronzo RA. Effect of hyperketonemia on renal ammonia excretion in man. Metab Clin Exp. 1986;35(8):736–43.http://dx.doi.org/10.1016/0026-0495(86)90241-6.
- 44. Sherwin RS, Hendler RG, Felig P. Effect of ketone infusions on amino acid and nitrogen metabolism in man. J Clin Invest. 1975;55(6):1382–90.http://dx.doi.org/10.1172/JCI108057.
- 45. Lemieux G, Pichette C, Vinay P, Gougoux A. Cellular mechanisms of the antiammoniagenic effect of ketone bodies in the dog. Am J Physiol. 1980;239(5):F420–6.http://dx.doi.org/10.1152/ajprenal.1980.239.5.F420.
- 46. Halperin ML, Cheema-Dhadli S. Renal and hepatic aspects of ketoacidosis: a quantitative analysis based on energy turnover. Diabetes Metab Rev. 1989;5(4):321–36.http://dx.doi.org/10.1002/dmr.5610050402.
- 47. Kerndt P, Naughton J, Driscoll C, Loxterkamp D. Fasting: the history, pathophysiology and complications. West J Med. 1982;137(5):379–99.
- 48. North KA, Lascelles D, Coates P. The mechanisms by which sodium excretion is increased during a fast but reduced on subsequent carbohydrate feeding. Clin Sci Mol Med. 1974;46(4):423–32.http://dx.doi.org/10.1042/cs0460423.
- 49. Sigler MH. The mechanism of the natriuresis of fasting. J Clin Invest. 1975;55(2):377–87.http://dx.doi.org/10.1172/JCI107941.
- 50. Palmer BF, Clegg DJ. Non-shivering thermogenesis as a mechanism to facilitate sustainable weight loss. Obes Rev. 2017;18(8):819–31.http://dx.doi.org/10.1111/obr.12563.
- 51. Aronson PS, Giebisch G. Effects of pH on potassium: new explanations for old observations. J Am Soc Nephrol. 2011;22(11):1981–9.http://dx.doi.org/10.1681/ASN.2011040414.
- 52. Saudek CD, Boulter PR, Arky RA. The natriuretic effect of glucagon and its role in starvation. J Clin Endocrinol Metab. 1973;36(4):761–5.http://dx.doi.org/10.1210/jcem-36-4-761.
- 53. Ruiz OS, Qiu YY, Cardoso LR, Arruda JA. Regulation of the renal Na-HCO3 cotransporter: IX. Modulation by insulin, epidermal growth factor and carbachol. Regul Pept. 1998;77(1–3):155–61.http://dx.doi.org/10.1016/s0167-0115(98)00115-3.
- 54. Veverbrants E, Arky RA. Effects of fasting and refeeding. I. Studies on sodium, potassium and water excretion on a constant electrolyte and fluid intake. J Clin Endocrinol Metab. 1969;29(1):55–62.http://dx.doi.org/10.1210/jcem-29-1-55.
- 55. Stinebaugh BJ, Schloeder FX. Glucose-induced alkalosis in fasting subjects. Relationship to renal bicarbonate reabsorption during fasting and refeeding. J Clin Invest. 1972;51(6):1326–36.http://dx.doi.org/10.1172/JCI106929.
- 56. Drenick EJ, Blahd WH, Singer FR, Lederer M. Body potassium content in obese subjects and potassium depletion during prolonged fasting. Am J Clin Nutr. 1966;18(4):278–85.http://dx.doi.org/10.1093/ajcn/18.4.278.
- 57. Lin SH, Cheema-Dhadli S, Gowrishankar M, Marliss EB, Kamel KS, Halperin ML. Control of excretion of potassium: lessons from studies during prolonged total fasting in human subjects. Am J Physiol. 1997;273(5):F796–800.http://dx.doi.org/10.1152/ajprenal.1997.273.5.F796.
- 58. Palmer BF, Clegg DJ. Physiology and pathophysiology of potassium homeostasis: core curriculum 2019. Am J Kidney Dis. 2019;74(5):682–95.http://dx.doi.org/10.1053/j.ajkd.2019.03.427.
- 59. Goldfinger S, Klinenberg E, Seegmiller JE. Renal retention of uric acid induced by infusion of beta-hydroxybutyrate and acetoacetate. N Engl J Med. 1965;272:351–5.http://dx.doi.org/10.1056/NEJM196502182720705.
- 60. Marinou K, Adiels M, Hodson L, Frayn KN, Karpe F, Fielding BA. Young women partition fatty acids towards ketone body production rather than VLDL-TAG synthesis, compared with young men. Br J Nutr. 2011;105(6):857–65.http://dx.doi.org/10.1017/S0007114510004472.
- 61. Bloom W. Fasting ketosis in obese men and women. Transl Res. 1962;59(4):605–12.
- 62. Hedrington MS, Davis SN. Sexual dimorphism in glucose and lipid metabolism during fasting, hypoglycemia, and exercise. Front Endocrinol. 2015;6:61.http://dx.doi.org/10.3389/fendo.2015.00061.
- 63. Davis SN, Galassetti P, Wasserman DH, Tate D. Effects of gender on neuroendocrine and metabolic counterregulatory responses to exercise in normal man. J Clin Endocrinol Metab. 2000;85(1):224–30.http://dx.doi.org/10.1210/jcem.85.1.6328.
- 64. Palmer BF, Clegg DJ. The sexual dimorphism of obesity. Mol Cell Endocrinol. 2015;402:113–9.http://dx.doi.org/10.1016/j.mce.2014.11.029.
- 65. Merimee TJ, Misbin RI, Pulkkinen AJ. Sex variations in free fatty acids and ketones during fasting: evidence for a role of glucagon. J Clin Endocrinol Metab. 1978;46(3):414–9.http://dx.doi.org/10.1210/jcem-46-3-414.
- 66. Kekwick A, Pawan GL, Chalmers TM. Resistance to ketosis in obese subjects. Lancet. 1959;2(7113):1157–9.