Background
Congestion is the primary reason for hospitalization in patients with heart failure (HF) and a major predictor of poor outcomes, making it an important target of therapeutic interventions []. Hemodynamic congestion (i.e., elevation of the left ventricular filling pressures) is known to precede clinical manifestations by days to weeks. On the other hand, studies have shown that clinical manifestations of volume overload can resolve despite persistence of hemodynamic congestion, with excess fluid in the intravascular and interstitial compartments [, ]. Discharging patients hospitalized for acute decompensated HF with improved symptoms yet lingering hemodynamic congestion results in symptom recurrence and readmissions. Moreover, in patients with underlying renal dysfunction, associated neurohormonal maladaptive mechanisms lead to increased sodium reabsorption, decreased water clearance, and diuretic resistance resulting in further worsening of the congestive state []. Objective and precise assessment of fluid volume status therefore plays a crucial role in guiding decongestive therapy.
Unfortunately, there is no single accurate method of determining volume status. Conventional physical examination findings are not always reliable. For example, jugular venous pressure (JVP) measurement is often limited by patient’s body habitus and underlying respiratory pathology. Similarly, lower extremity edema may be indicative of low plasma oncotic pressure or high vascular permeability rather than high cardiac filling pressures. In supine hospitalized patients, the apparent decrease in edema could be due to redistribution to the sacral region, which may be falsely interpreted as improvement in congestion. Similarly, the absence of lung crackles does not imply absence of congestion, and in chronic HF, even severe hemodynamic congestion may not cause crackles and/or radiographic pulmonary edema due to adaptive pathophysiologic changes such as increased lymphatic drainage and alveolar capillary membrane thickness []. In one study, the combined sensitivity of lung crackles, peripheral edema, and elevated JVP was only 58% to detect an elevated pulmonary capillary wedge pressure (PCWP) >22 mm Hg []. While body weight is a frequently used parameter to assess congestion, fluid redistribution drives pulmonary manifestations compared to overt fluid accumulation in a significant subset of patients with acute HF making it less reliable []. Moreover, it has been shown that substantial discrepancy exists between fluid and weight loss during acute decompensated HF treatment []. Laboratory parameters such as B-type natriuretic peptide are helpful but are nonspecific and do not acutely change with therapy. Even chest radiography is not infallible and approximately 20% of the patients with congestion can present with a normal radiograph []. While thoracic impedance cardiography has been studied as a noninvasive method to determine changes in thoracic fluid content, it largely remains a work in progress at this time and is not widely available []. In the recent past, point of care ultrasonography (POCUS) has emerged as an attractive bedside diagnostic tool to determine volume status and monitor efficacy of the decongestive therapy. Adoption of this technique would be an invaluable addition to the skillset of the cardiorenal physician whose goal is to decipher the complex pathophysiology of heart-kidney interactions. In fact, it could be pertinent to physicians providing care for patients with fluid overload state from any cause including liver disease and nephrotic syndrome. Herein, we provide an overview of such approach from a nephrologic standpoint and discuss its nuances.
Definition and Scope of POCUS
POCUS is the limited bedside ultrasound examination performed by the treating physician to find answers for focused clinical questions and guide management. Unlike the comprehensive ultrasound study performed in the radiology department which evaluates all organs in an anatomical region (e.g., complete abdominal ultrasound), POCUS is often performed to evaluate a particular pathology such as presence or absence of ascites. Its key purpose is to immediately narrow the differential diagnosis by building on the information disclosed by history and physical examination, which expedites the care while also potentially avoiding use of ionizing radiation []. Once confined to specialties such as emergency medicine and obstetrics, its use is rapidly expanding in the field of internal medicine and subspecialties including nephrology. In fact, POCUS is being integrated into both undergraduate and graduate medical education curricula as well as continuing medical education certification programs for practicing physicians [-]. Goal-directed sonographic assessment of the pump, pipes, and the leaks provides helpful insights into systemic hemodynamics that can be integrated with conventional assessment to guide treatment decisions in patients with HF. The pump represents the focused cardiac ultrasound (FoCUS), pipes represent inferior vena cava (IVC) ultrasound and venous Doppler, and the leaks indicate assessment of the extravascular lung and abdominal fluid (Fig. 1).
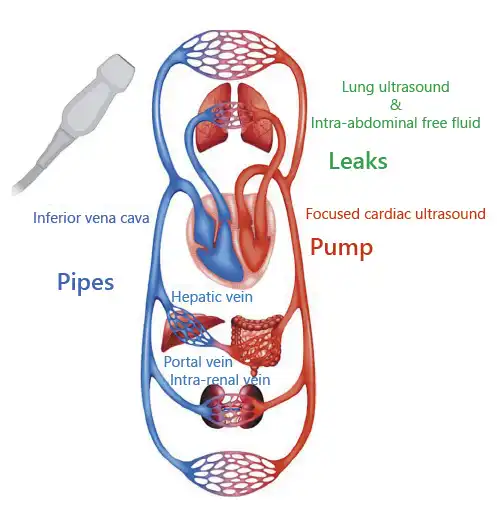
Fig. 1
Representation of the pump, pipes, and leaks model for assessment of fluid volume status in HF. HF, heart failure; LUS, lung ultrasound; IVC, inferior vena cava. Circulation image licensed from Shutterstock®.
The Pump
FoCUS is gaining popularity among the non-cardiologist physicians as a bedside diagnostic tool, and studies have consistently shown that it can be effectively performed by providers with a relatively brief formal training [, ]. Moreover, it has proven to significantly increase the sensitivity of auscultation, particularly for the diagnosis of left ventricular dysfunction and common valvular abnormalities []. FoCUS assists in the evaluation of fluid status by rapidly providing the answers to the so-called “5 Es,” that is, qualitative estimation of left ventricular Ejection, presence or absence of pericardial Effusion, Equality (relative right ventricular size), Entrance (IVC size and collapsibility), and the Exit (stroke volume measurement at the left ventricular outflow tract [LVOT]) [, ]. While fluid overload is the main concern in HF, a subset of patients aggressively treated with diuretics may develop reduced cardiac output and consequent tissue hypoperfusion due to relative volume depletion. In such patients, it would be prudent to confirm volume responsiveness using FoCUS instead of administering intravenous fluids empirically. Volume responsiveness is generally defined as an increase in stroke volume by >15% after 500 cc of fluid challenge. Passive leg raise is a simple and practical method of predicting fluid responsiveness. It is performed by tilting the patient from a 45° semi-recumbent head-up position to a 45° leg-up position, which transfers up to 300–400 mL of blood into central circulation, obviating the need for external fluid bolus administration. Stroke volume is measured at the LVOT before and one min after the leg raise; an increase by 10% suggests fluid responsiveness []. Stroke volume is the product of LVOT cross sectional area and velocity time integral (VTI). LVOT cross-sectional area is derived from the LVOT diameter in parasternal long-axis view using the formula πr2, and LVOT VTI is obtained by tracing the envelope of the Doppler spectrum of systolic flow in the apical 5-chamber view (Fig. 2) []. As the LVOT diameter is constant for a given person, VTI (normal: ∼18–22 cm) is often used as a surrogate for cardiac output changes assuming the heart rate is relatively constant.
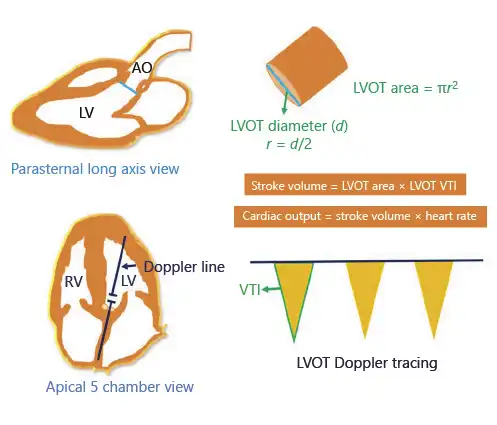
Fig. 2
Determination of stroke volume and cardiac output using echocardiography. LV, left ventricle; RV, right ventricle; Ao, aorta; LVOT, left ventricular outflow tract; r, radius; VTI, velocity time integral.
In the outpatient clinics, assessment of the left ventricular filling pressures to detect hemodynamic congestion can help titrate diuretic therapy before the onset of symptoms. While this requires a higher operator skill than for FoCUS, it is still within the scope of physicians trained in Doppler ultrasonography. A variety of echocardiographic parameters have been used to assess left ventricular filling pressures such as mitral inflow velocities, pulmonary venous flow, tissue Doppler imaging, and left atrial volume index. Of these, transmitral flow Doppler is commonly used when performing focused examinations. To obtain the flow tracing, the Doppler sample volume is placed between the tips of open mitral valve leaflets in the apical 4-chamber view. The normal tracing consists of E and A waves corresponding to flow during rapid filling period and atrial systole, respectively. In young, healthy individuals, most of left ventricular filling occurs during the rapid filling period and thus the E-wave peak velocity exceeds that of the A wave (E/A ratio >1) (Fig. 3, upper panel). E-wave deceleration time (DT) is the time required for the peak E-wave velocity to cross the baseline. It represents the dissipation time for the maximal pressure gradient between left atrium and left ventricle []. Normal DT is 160–200 ms and a value <150 ms has been found to be predictive of a PCWP >15 mm Hg []. Interestingly, in a study using E-wave DT and B-type natriuretic peptide level to guide diuretic therapy in outpatients with chronic HF, a lower incidence of death (hazard ratio [HR] 0.45, 95% CI: 0.30–0.67, p < 0.0001) and death or worsening renal function (HR 0.49, 95% CI 0.36–0.67, p < 0.0001) was found in the intervention group compared to controls. A DT cutoff of <140 ms was used as a surrogate marker of increased PCWP in this study []. However, there are certain limitations of using E-wave DT in this context. For example, DT does not always correlate with left ventricular end diastolic pressure in patients with preserved ejection fraction. It also cannot be used in cases where E and A waves are fused and those with atrial flutter [].
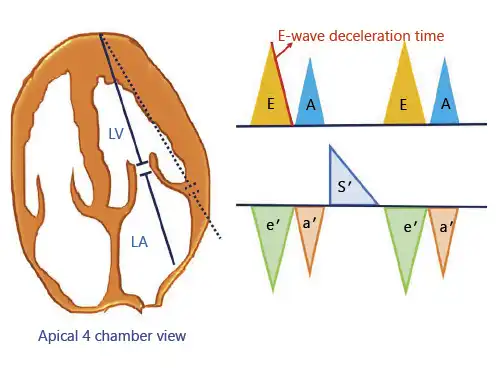
Fig. 3
(Upper panel) Transmitral pulsed-wave Doppler tracing demonstrating E and A waves. E wave DT is the time required for the peak E-wave velocity to cross the baseline. (Lower panel) Tissue Doppler tracing at the lateral mitral annulus demonstrating e′ = early diastolic, a′ = late/atrial diastolic, and s′ = systolic tissue velocities. DT, deceleration time.
Tissue Doppler imaging, when available can be used to supplement the transmitral flow findings. This involves measuring the longitudinal motion of the mitral valve annulus (septal or lateral) during diastole. Normally, this tracing consists of below the baseline e′ wave, reflecting early relaxation; and a′ wave, reflecting atrial contraction in late diastole (Fig. 3, lower panel). The ratio of E and e′ predicts elevated filling pressures, and a lateral E/e′ ratio >13 or a septal E/e′ >15 is considered indicative of elevated PCWP. While individual cutoff values do exist for e′ apart from the ratio (septal e′ <7 cm/s, lateral e′ <10 cm/s is abnormal), in most patients with HF, e′ remains depressed even after diuresis but the E/e′ ratio improves due to decrease in E-wave velocity []. Therefore, use of isolated e′ to guide decongestive therapy may result in over diuresis. It is also important to note that tissue Doppler measurements can be unreliable in the presence of abnormalities such as mitral annular calcification (which, in fact, is common in patients with CKD), severe mitral regurgitation, regional wall motion abnormalities, ventricular desynchrony, and constrictive physiology []. Moreover, in patients with high heart rate, impaired relaxation leads to decrease in diastolic suction; optimal heart rate control with β-blockers should be considered in addition to diuretics [].
Apart from POCUS, wireless implantable hemodynamic monitoring systems may be suitable for select patients. These devices allow the physicians to remotely monitor pulmonary artery pressures and titrate therapy. For example, the CardioMEMS HF System (Abbott Medical, Inc., Abbott Park, IL, USA) consists of a sensor designed for permanent implantation into the distal pulmonary artery and provides hemodynamic information that can be wirelessly transmitted to health care providers []. Of note, in a randomized controlled trial, patients managed with this device had a significant reduction in HF-related hospitalizations (HR 0.72, 95% CI 0.6–0.85, p = 0.0002). However, this technology is not yet widely available and right heart catheterization is needed to implant the sensor [].
Despite stated advantages, relying on isolated measurement of left ventricular filling pressures to titrate diuretic therapy can result in errors. First, it is not always possible to accurately determine filling pressures using a single parameter such as mitral inflow Doppler, particularly within the time constrains of an outpatient clinic. Furthermore, overzealous attempts at achieving normal filling pressures by fluid removal may potentially result in impaired forward flow and hypotension.
The Pipes
Inferior Vena Cava
Elevated central venous pressure or the right atrial pressure (RAP) is considered to reflect venous congestion and has been shown to be associated with impaired renal function possibly due to decreased renal perfusion pressure []. In clinical echocardiography, size and collapsibility of the IVC is used as a surrogate for RAP. In spontaneously breathing patients, inspiration causes negative intrathoracic pressure and collapses the IVC. As the magnitude of inspiratory effort can influence the degree of collapse, patients are usually asked to “sniff” to standardize the effort. An IVC diameter ≤2.1 cm and collapsibility >50% with a sniff indicates normal RAP of 3 mm Hg (0–5 mm Hg); IVC diameter >2.1 cm with <50% inspiratory collapse indicates high RAP of 15 mm Hg (10–20 mm Hg); an intermediate value of 8 mm Hg (5–10 mm Hg) is ascribed to scenarios in between []. Of note, IVC is commonly dilated in mechanically ventilated patients and may not collapse at all. Therefore, RAP cannot be estimated using these cutoffs.
The key advantage of IVC ultrasound is that image acquisition is rather easy even for novice POCUS users. Notably, it has been shown that estimation of RAP by IVC POCUS performed by trainees using hand-carried ultrasound devices was superior to clinical examination of the jugular venous pulse []. In another study, IVC collapsibility, but not pedal edema or lung crackles, has shown to predict readmission or emergency department visit after discharge in patients hospitalized for acute decompensated HF. Interestingly, the scans were again performed by internal medicine residents using hand-held ultrasound devices []. Currently, there is no high-quality evidence on the efficacy of IVC ultrasound-guided decongestive therapy in patients admitted for HF exacerbation. A randomized controlled trial is under way [].
There are a number of pitfalls associated with isolated use of IVC to determine volume status. First, while the vessel is routinely measured in its long axis (antero-posterior diameter), inspiratory collapse can occur craniocaudally and/or mediolaterally resulting in errors. Moreover, the point of measurement of maximal diameter may not always reflect the true diameter due to anatomic factors []. Furthermore, “quick” examinations involving qualitative assessment of IVC collapse instead of taking precise measurements are error prone []. In case of sick patients, it might not be possible to regulate the respiratory effort. For example, a dyspneic patient can have >50% IVC collapsibility despite high RAP, while an elderly patient with shallow breathing may have a full-appearing IVC in the presence of normal RAP. This can confound the interpretation when serial measurements of IVC are being performed to assess response to therapy. In addition, increased intra-abdominal pressure alters the relationship between the IVC diameter and RAP by compressing the vessel []. This is particularly important in patients with ileus or ascites. On the other hand, IVC may not collapse at all in patients on mechanical ventilation unless there is significant volume depletion, in which case, expiratory collapse (i.e., distension during inspiration) can occur. In one study including 39 mechanically ventilated patients with septic shock, an IVC distensibility of 12%, calculated as the difference between the maximum and the minimum IVC diameter, normalized by the mean of the 2 values, and expressed as a percentage, correlated with fluid responsiveness []. However, only a fraction of patients in intensive care units possess the complete set of clinical conditions required to reliably perform this test (e.g., deep sedation with no spontaneous breaths, tidal volume ≥8 mL/kg, and absence of right heart dysfunction) []. In our practice, fluid responsiveness is typically performed using stroke volume measurement instead of relying on indirect measures such as IVC, except for patients with poor cardiac windows.
Venous Doppler
The deleterious consequences of venous congestion on abdominal organs are often underappreciated in clinical practice. For example, hepatic venous congestion is associated with chronic congestive hepatopathy in patients with pulmonary hypertension and elevated right-sided filling pressures, which in turn predisposes them to acute ischemic hepatitis during HF exacerbation episodes. Similarly, renal vein congestion is implicated in progressive decline of glomerular filtration rate. Moreover, activation of renal venous endothelium results in release of inflammatory mediators, which may cause structural glomerular and interstitial damage as well as functional abnormalities such as proteinuria and retention of salt and water []. Interestingly, this inflammatory response has also been shown to have distant-organ effects such as on the lung, causing the so-called nephrogenic pulmonary edema []. In the intestine, venous congestion has been linked to altered permeability resulting in bacterial translocation and endotoxinemia []. Doppler ultrasonography of the hepatic, portal, and intrarenal veins allows the treating physician to visualize whether the high RAP translates into clinically significant venous congestion exhausting the venous compliance and resulting in organ dysfunction. In addition, knowledge of these Doppler waveforms aids in more precise monitoring of the efficacy of decongestive therapy [].
Hepatic Vein Doppler
Normal hepatic venous flow is phasic and bidirectional, reflecting the right atrial filling throughout the cardiac cycle and right ventricular filling during diastole. Most of the blood flow in hepatic vein is anterograde or toward the heart (below the baseline) and consists of various individual waves similar to a JVP tracing. Therefore, changes that increase RAP will cause above the baseline deflections and changes that decrease RAP will result in a downward deflection. “S” wave is the large anterograde waveform during early and mid-systole that occurs in response to fall in RAP caused by the increase in volume due to atrial relaxation and systolic displacement of the tricuspid annulus toward the right ventricular apex. It is followed by a small retrograde “V” that occurs due to increase in RAP caused by continued venous return toward late systole. The peak of this wave can be below or above the baseline on a normal tracing. The “D” wave is another anterograde waveform caused by fall in the RAP that follows tricuspid valve opening and emptying of the right atrium into right ventricle in early to mid-diastole. Normally, the S wave is deeper (of greater velocity) than the D wave. “A” wave is a retrograde (above the baseline) waveform caused by atrial contraction at end diastole, which signifies RAP exceeding the pressure in IVC leading to flow reversal in the hepatic veins [] (Fig. 4a). “A” wave may be absent in patients with atrial fibrillation. Having a simultaneous electrocardiogram tracing aids in accurate interpretation of these waveforms. During inspiration, the velocity of the anterograde waveforms (S and D) increases due to increased venous return, while there is a reduction in the velocity of these waves together with an increase in diastolic flow reversals during expiration. Though not always plausible in acutely ill patients, obtaining the tracing during breath-holding results in better waveforms by avoiding the movement of the Doppler sample volume in and out of the vessel. Valsalva maneuver should be avoided as it causes blunting of the waveforms []. In right-sided HF, the first change that occurs is tall A and V waves if the tricuspid valve is competent. If there is associated tricuspid regurgitation, S wave becomes smaller than the D wave as the blood flows into the right atrium from the ventricle during systole raising the RAP (Fig. 4b). Further increases in RAP lead to reversal of S wave making the D wave the only anterograde waveform. The retrograde A, S, and V waves may further combine to form a single wave ultimately resulting in a biphasic waveform (Fig. 4c). With effective decongestive therapy, these changes revert back to baseline mirroring the changes in RAP [].
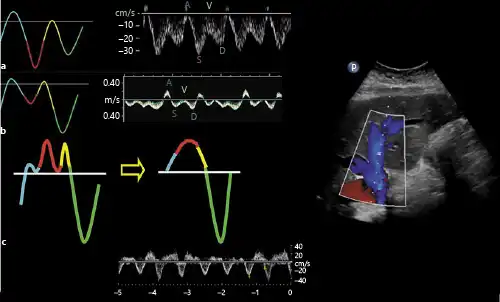
Fig. 4
Hepatic vein Doppler waveforms: normal (a) and with increasing RAP (b, c). In b, note the D wave is greater than the S wave, and c represents a biphasic pattern. RAP, right atrial pressure. Figure adapted from Sundaram and Fang [] with kind permission of the Radiological Society of North America.
Portal Vein Doppler
Portal venous flow is separated from the systemic circulation by the liver sinusoids and splanchnic capillary bed. Therefore, the flow changes during cardiac cycle are not prominent unlike hepatic vein. The normal portal venous waveform is “phasic,” with gentle undulation, primarily influenced by atrial contraction (Fig. 5a) []. With increase in RAP, the pressure changes during the cardiac cycle are transmitted to the portal circulation leading to a “pulsatile” waveform (Fig. 5b). Generally, a difference of >30% between maximal and minimal velocities is considered abnormal and has been associated with increased RAP and worse functional class in patients with HF []. Further increases in RAP or severe tricuspid regurgitation may lead to systolic flow reversal (Fig. 5c). Portal vein Doppler may also be a surrogate for gut and renal congestion. In one study, increased portal pulsatility was independently associated with acute kidney injury in post-cardiac surgery patients []. Caution must be exercised in interpreting these waveforms as pulsatile portal venous flow has been reported in thin individuals with low BMI (<20) as well as those with liver cirrhosis in the absence of high RAP [, ]. In cirrhosis, the mean velocity of the portal vein tends to be low [], but this parameter is unreliable and subject to several variabilities in the point of care setting.
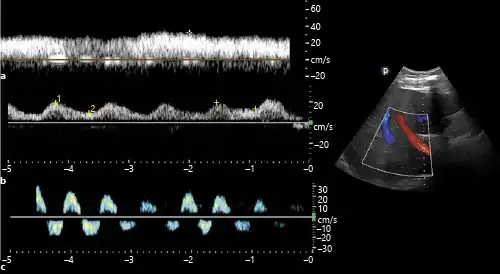
Fig. 5
Portal vein Doppler waveforms: normal (a) and with increasing RAP (b, c). b shows increased (>50%) pulsatility, and c demonstrates systolic flow reversal (below the baseline). RAP, right atrial pressure.
Renal Vein Doppler
Intrarenal venous Doppler (IRVD) is the blood flow pattern in the interlobar veins and is dependent on RAP and intra-abdominal pressure. In the absence of intra-abdominal hypertension, the changes in IRVD are reflective of changes in RAP. The normal waveform is relatively continuous similar to that of portal vein and is displayed below the baseline. As the RAP increases, intrarenal veins become less compliant, making the flow pulsatile and biphasic with distinct systolic (S) and diastolic (D) waves. Further increases in RAP lead to a monophasic (diastolic-only) flow pattern, in which case the flow is exclusively dependent on right ventricular filling []. Because of the narrow sampling zone, the waveform of the interlobar artery is often displayed above the baseline, which helps with identifying the cardiac cycle phases (Fig. 6).
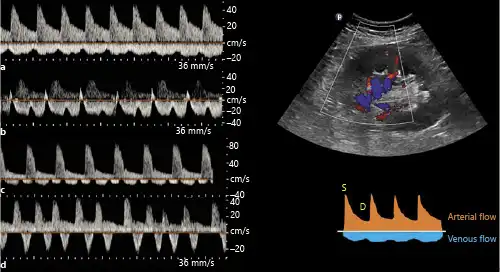
Fig. 6
Intrarenal vein Doppler waveforms: normal (a) and with increasing RAP (b–d). b shows increased pulsatility, c demonstrates biphasic waveform, and d demonstrates monophasic (diastolic-only flow) pattern. Above the baseline tracing represents arterial waveform. RAP, right atrial pressure. Tracings adapted from Husain-Syed et al. [] with kind permission of the author (copyright owner) and publisher.
IRVD patterns bear prognostic significance in patients with HF. For example, in one study including 224 patients with HF, IRVD pattern was significantly associated with changes in RAP assessed by right heart catheterization (mean RAP was 5.4 mm Hg with continuous pattern, 9.5 with biphasic pattern, and 14.9 with monophasic pattern; p < 0.001). Of note, the monophasic IRVD pattern conferred poorer prognosis than other patterns in this study while renal arterial resistive index was not independently associated with outcomes []. Similarly, in a cohort of 205 patients with pulmonary hypertension, renal venous stasis index, defined as the proportion of the cardiac cycle during which there is no renal venous outlet flow, independently predicted the composite end point of pulmonary hypertension progression and all-cause mortality 1-year after discharge []. Similar to hepatic and portal vein waveforms, IRVD patterns also can be used to assess response to decongestive therapy. In a study comparing the effect of volume expansion on IRVD patterns in patients with HF and normal subjects, venous impedance index (calculated as the difference between peak and nadir velocities divided by peak velocity) increased significantly in HF patients (0.4–0.7; p < 0.001) but not in healthy subjects (0.2–0.3; p = 0.622), which promptly reversed after loop diuretic administration. In addition, intravascular volume expansion resulted in blunting of venous flow in HF patients before a significant increase in cardiac filling pressures []. Nevertheless, it is often difficult to obtain a high-quality IRVD tracing in acute settings as the Doppler sampling zone moves out of the vessel with respiration. This may lead to erroneous interpretation, particularly with regards to calculation of the venous stasis index.
The Venous Excess Grading
Recently, Beaubien-Souligny et al. [] developed a venous excess ultrasound (VExUS) grading system to quantify the severity of venous congestion using data from a single-center cohort of cardiac surgery patients. We have adopted this into our practice and found it helpful particularly to standardize the findings obtained by different physicians. Briefly, when the diameter of IVC is ≥2 cm, 3 grades of congestion were defined based on the severity of abnormalities on hepatic, portal, and IRVD. Hepatic vein Doppler is considered mildly abnormal when the S wave is smaller than the D wave, but still below the baseline, while it is considered severely abnormal when the S wave is reversed (i.e., above the baseline). Portal vein Doppler is considered mildly abnormal when the pulsatility is 30–50% and severely abnormal if it is ≥50%. IRVD is mildly abnormal when it is pulsatile with S and D components and severely abnormal when it is monophasic with only a D component. Based on these definitions, various prototypes, ranging from grades 0 to 3, were identified. This study found that the severe VExUS grade had the strongest association with the development of subsequent acute kidney injury compared with other combinations (HR 3.69, confidence interval [CI] 1.65–8.24, p = 0.001). The association remained significant after adjustment for baseline risk of renal dysfunction and vasopressor/inotropic support. Interestingly, VExUS grading outperformed the central venous pressure measurements in terms of positive likelihood ratio (6.37, CI 2.19–18.50) []. Figure 7 summarizes various ultrasound patterns across the spectrum of RAP.
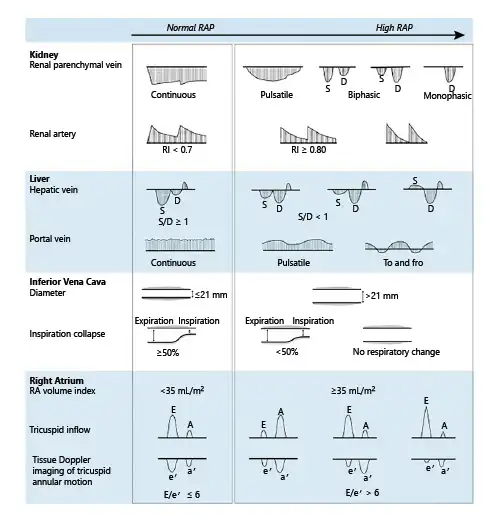
Fig. 7
Ultrasound patterns across the spectrum of RAP. RA, right atrium; RAP, right atrial pressure; IVC, inferior vena cava; RI, resistive index; E, flow through the tricuspid valve during rapid filling period; A, flow during atrial systole; e′ = early diastolic, a′ = late/atrial diastolic, and s′ = systolic tissue velocities of the tricuspid annular motion. When the RAP is normal, E is greater than A, and the ratio of E, e′ is typically <6. Figure adapted from Tang and Kitai [] with kind permission of the publisher.
The Leaks
Lung Ultrasound
Lung ultrasound (LUS) can detect extravascular lung water even before the congestion is clinically apparent and is increasingly used by nephrologists []. In fact, it outperforms a chest radiograph in ruling out interstitial edema and pleural effusion []. LUS mainly involves interpretation of the artifacts rather than visualization of the lung parenchyma because air is strongly reflective to the ultrasound beam. In a normal well-aerated lung, the only detectable structure is the pleura, which appears as a shimmering hyperechoic line between the ribs. It is followed by equidistant hyperechoic horizontal artifacts called the A-lines, which are essentially reflections of the pleural line due to underlying air-filled lung. B-lines, which are vertical hyperechoic artifacts, occur when the air content in the lung decreases due to transudate or exudate in the interstitium. A positive “B-line region” is defined as the presence of ≥3 B-lines in a longitudinal plane between 2 ribs and ≥2 positive regions bilaterally constitute “interstitial syndrome” indicative of diffuse pulmonary edema []. When the air content decreases further, such as in alveolar consolidation, lung parenchyma appears like that of a liver (hepatization). Conversely, pleural effusion appears as an anechoic space above the diaphragm, typically surrounding the atelectatic lung (Fig. 8). While scanning 2 anterior chest regions or zones is adequate to diagnose pulmonary edema in acutely symptomatic patients, more zones need to be evaluated in those with milder or no symptoms []. Various scanning zones have been described though most of the published studies employed the 28-zone technique (Fig. 9). LUS aids in the diagnosis, prognostication, and therapeutic guidance in patients with HF. In a meta-analysis comprising of 1,827 adult patients presenting with dyspnea, LUS was found to be more sensitive than chest radiography in detecting pulmonary edema (relative sensitivity ratio 1.2, 95% CI 1.08–1.34; p < 0.001) []. In terms of prognosis, residual lung congestion at hospital discharge, as assessed by a B-line count ≥30 on 28-zone LUS, was found to be a strong predictor of all-cause mortality or HF hospitalization at 3 months []. In a recent study employing a simplified 4-zone LUS technique in patients hospitalized for acute HF, presence of ≥7 B-lines at discharge was associated with a higher risk of adverse events at 6 months (HR 2.01; p = 0.021) []. B-line count on LUS decreases with decongestive therapy in real time and can be used to guide management. For example, in ambulatory patients with HF, 8-zone LUS-guided diuretic therapy was associated with a significant decrease in the number of urgent visits for worsening HF as well as improvement in the distance achieved on a 6-min walking test []. Further research is needed to compare simplified scanning techniques with the traditional 28-zone LUS and establish correlates. This could render LUS more practical, particularly in the outpatient clinics with time constraints.
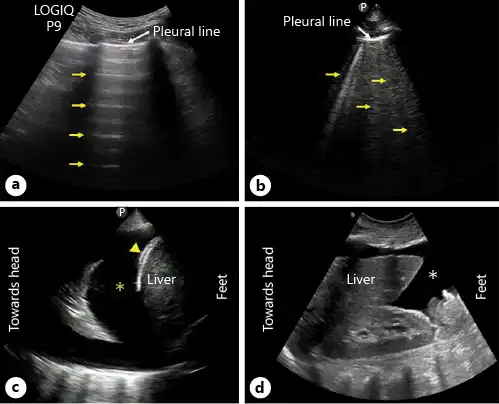
Fig. 8
LUS images demonstrating A-lines (arrows) (a), B-lines (arrows) (b) and pleural effusion (asterisk) (c). Arrowhead points to diaphragm. d Right upper quadrant abdominal sonogram demonstrating ascites (asterisk). LUS, lung ultrasound.
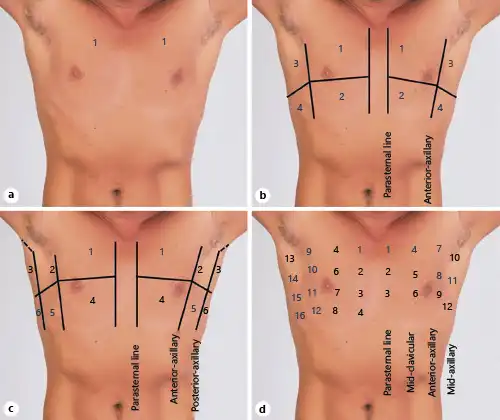
Fig. 9
Commonly used LUS scan zones: 2-zone (a), 8-zone (b), 12-zone (c), and 28-zone (d). Note the labeled anatomic landmarks. Human chest photograph licensed from Shutterstock®. LUS, lung ultrasound.
Limited Abdominal Ultrasound
Patients with refractory HF, particularly those with more pronounced backward failure are prone to development of ascites that may require frequent drainage or peritoneal catheter placement []. POCUS helps in identifying the ascites, which appears as an anechoic space below the diaphragm in dependent areas and distinguishes it from other causes of abdominal distension in HF such as abdominal wall edema or ileus (Fig. 8d). In addition, it can be used to guide diagnostic or therapeutic paracentesis. Furthermore, POCUS can identify bowel wall edema, which is a known predictor of poor outcomes in patients presenting with HF exacerbation [].
Conclusions
The pathophysiologic pathways underlying congestion in HF are complex and poorly understood. Moreover, the conventional tools for assessment of volume status portend significant inherent limitations. Focused sonographic evaluation of the pump, pipes, and the leaks adds a whole new dimension to the bedside clinical examination and has the potential to transform the care of these patients. Having said that, POCUS is only a piece of the hemodynamic puzzle and should be used in conjunction with, but not instead of, the overall clinical assessment. Moreover, thorough multi-parameter assessment should be undertaken to offset the limitations of individual POCUS applications. Future research should focus on integrating these sonographic findings with targeted decongestive strategies to explore whether POCUS-assisted assessment of volume status would translate into improvement of outcomes in these patients. Furthermore, the sonographic findings need to be validated in specific HF categories such as diastolic HF, high-output HF, etc.
Statement of Ethics
Human and animal rights: this article does not contain any studies with human participants or animals performed by any of the authors.
Conflict of Interest Statement
The authors have no conflicts of interest to declare.
Funding Sources
The authors did not receive any funding.
Author Contributions
A.K. – performed literature search and drafted the initial version of the manuscript. A.Ko. – critically reviewed and revised the manuscript for important intellectual content.
References
- 1. Gheorghiade M, Filippatos G, De Luca L, Burnett J. Congestion in acute heart failure syndromes: an essential target of evaluation and treatment. Am J Med. 2006;119(12 Suppl 1):S3–10.
- 2. Gheorghiade M, Follath F, Ponikowski P, Barsuk JH, Blair JE, Cleland JG, et al. Assessing and grading congestion in acute heart failure: a scientific statement from the acute heart failure committee of the heart failure association of the European Society of Cardiology and endorsed by the European Society of Intensive Care Medicine. Eur J Heart Fail. 2010;12(5):423–33.http://dx.doi.org/10.1093/eurjhf/hfq045.
- 3. Miller WL. Fluid volume overload and congestion in heart failure: time to reconsider pathophysiology and how volume is assessed. Circ Heart Fail. 2016;9(8):e002922.http://dx.doi.org/10.1161/CIRCHEARTFAILURE.115.002922.
- 4. Kazory A. Cardiorenal syndrome: ultrafiltration therapy for heart failure–trials and tribulations. Clin J Am Soc Nephrol. 2013;8(10):1816–28.
- 5. Stevenson LW, Perloff JK. The limited reliability of physical signs for estimating hemodynamics in chronic heart failure. JAMA. 1989;261(6):884–8.http://dx.doi.org/10.1001/jama.261.6.884.
- 6. Testani JM, Brisco MA, Kociol RD, Jacoby D, Bellumkonda L, Parikh CR, et al. Substantial discrepancy between fluid and weight loss during acute decompensated heart failure treatment. Am J Med. 2015 Jul;128(7):776–83.e4.http://dx.doi.org/10.1016/j.amjmed.2014.12.020.
- 7. Cotter G, Metra M, Milo-Cotter O, Dittrich HC, Gheorghiade M. Fluid overload in acute heart failure: re-distribution and other mechanisms beyond fluid accumulation. Eur J Heart Fail. 2008;10(2):165–9.http://dx.doi.org/10.1016/j.ejheart.2008.01.007.
- 8. Collins SP, Lindsell CJ, Storrow AB, Abraham WTADHERE Scientific Advisory Committee, Investigators and Study Group. Prevalence of negative chest radiography results in the emergency department patient with decompensated heart failure. Ann Emerg Med. 2006;47(1):13–8.http://dx.doi.org/10.1016/j.annemergmed.2005.04.003.
- 9. Bayram M, Yancy CW. Transthoracic impedance cardiography: a noninvasive method of hemodynamic assessment. Heart Fail Clin. 2009;5(2):161–8.http://dx.doi.org/10.1016/j.hfc.2008.12.001.
- 10. Bhagra A, Tierney DM, Sekiguchi H, Soni NJ. Point-of-care ultrasonography for primary care physicians and general internists. Mayo Clin Proc. 2016;91(12):1811–27.http://dx.doi.org/10.1016/j.mayocp.2016.08.023.
- 11. Soni NJ, Schnobrich D, Mathews BK, Tierney DM, Jensen TP, Dancel R, et al. Point-of-care ultrasound for hospitalists: a position statement of the society of hospital medicine. J Hosp Med. 2019;14:E1–6. Published 2019 Jan 2.
- 12. Schnobrich DJ, Gladding S, Olson AP, Duran-Nelson A. Point-of-care ultrasound in internal medicine: a national survey of educational leadership [published correction appears in J Grad Med Educ. 2019 Dec;11(6):742]. J Grad Med Educ. 2013;5(3):498–502.
- 13. Koratala A, Segal MS, Kazory A. Integrating point-of-care ultrasonography into nephrology fellowship training: a model curriculum. Am J Kidney Dis. 2019;74(1):1–5.http://dx.doi.org/10.1053/j.ajkd.2019.02.002.
- 14. Manasia AR, Nagaraj HM, Kodali RB, Croft LB, Oropello JM, Kohli-Seth R, et al. Feasibility and potential clinical utility of goal-directed transthoracic echocardiography performed by noncardiologist intensivists using a small hand-carried device (SonoHeart) in critically ill patients. J Cardiothorac Vasc Anesth. 2005;19(2):155–9.
- 15. Spurney CF, Sable CA, Berger JT, Martin GR. Use of a hand-carried ultrasound device by critical care physicians for the diagnosis of pericardial effusions, decreased cardiac function, and left ventricular enlargement in pediatric patients. J Am Soc Echocardiogr. 2005;18(4):313–9.http://dx.doi.org/10.1016/j.echo.2004.10.016.
- 16. Marbach JA, Almufleh A, Di Santo P, Jung R, Simard T, McInnes M, et al. Comparative accuracy of focused cardiac ultrasonography and clinical examination for left ventricular dysfunction and valvular heart disease: a systematic review and meta-analysis. Ann Intern Med. 2019;171(4):264–72.http://dx.doi.org/10.7326/M19-1337.
- 17. Kennedy Hall M, Coffey EC, Herbst M, Liu R, Pare JR, Andrew Taylor R, et al. The “5Es” of emergency physician-performed focused cardiac ultrasound: a protocol for rapid identification of effusion, ejection, equality, exit, and entrance. Acad Emerg Med. 2015;22(5):583–93.
- 18. Koratala A, Ronco C, Kazory A. Need for objective assessment of volume status in critically ill patients with COVID-19: the tri-POCUS approach. Cardiorenal Med. 2020;10(4):209–16.
- 19. Miller A, Mandeville J. Predicting and measuring fluid responsiveness with echocardiography. Echo Res Pract. 2016;3(2):G1–12.http://dx.doi.org/10.1530/ERP-16-0008.
- 20. Blanco P. Rationale for using the velocity-time integral and the minute distance for assessing the stroke volume and cardiac output in point-of-care settings. Ultrasound J. 2020;12(1):21.http://dx.doi.org/10.1186/s13089-020-00170-x.
- 21. Silbiger JJ. Pathophysiology and echocardiographic diagnosis of left ventricular diastolic dysfunction. J Am Soc Echocardiogr. 2019;32(2):216–32.e2.http://dx.doi.org/10.1016/j.echo.2018.11.011.
- 22. Whalley GA, Doughty RN, Gamble GD, Wright SP, Walsh HJ, Muncaster SA, et al. Pseudonormal mitral filling pattern predicts hospital re-admission in patients with congestive heart failure. J Am Coll Cardiol. 2002;39(11):1787–95.http://dx.doi.org/10.1016/s0735-1097(02)01868-5.
- 23. Simioniuc A, Carluccio E, Ghio S, Rossi A, Biagioli P, Reboldi G, et al. Echo and natriuretic peptide guided therapy improves outcome and reduces worsening renal function in systolic heart failure: an observational study of 1137 outpatients. Int J Cardiol. 2016;224:416–23.http://dx.doi.org/10.1016/j.ijcard.2016.09.034.
- 24. Nagueh SF, Smiseth OA, Appleton CP, Byrd BF, Dokainish H, Edvardsen T, et al. Recommendations for the evaluation of left ventricular diastolic function by echocardiography: an update from the American Society of Echocardiography and the European Association of Cardiovascular Imaging. J Am Soc Echocardiogr. 2016;29(4):277–314.http://dx.doi.org/10.1016/j.echo.2016.01.011.
- 25. Little WC, Oh JK. Echocardiographic evaluation of diastolic function can be used to guide clinical care. Circulation. 2009;120(9):802–9.http://dx.doi.org/10.1161/CIRCULATIONAHA.109.869602.
- 26. Mitter SS, Shah SJ, Thomas JD. A test in context: E/A and E/e’ to assess diastolic dysfunction and LV filling pressure. J Am Coll Cardiol. 2017;69(11):1451–64.
- 27. Sohn DW. Heart failure due to abnormal filling function of the heart. J Cardiol. 2011;57(2):148–59.http://dx.doi.org/10.1016/j.jjcc.2011.01.001.
- 28. Ayyadurai P, Alkhawam H, Saad M, Al-Sadawi MA, Shah NN, Kosmas CE, et al. An update on the CardioMEMS pulmonary artery pressure sensor. Ther Adv Cardiovasc Dis. 2019 Jan–Dec;13:1753944719826826.http://dx.doi.org/10.1177/1753944719826826.
- 29. Abraham WT, Adamson PB, Bourge RC, Aaron MF, Costanzo MR, Stevenson LW, et al. Wireless pulmonary artery haemodynamic monitoring in chronic heart failure: a randomized controlled trial. Lancet. 2012;379(9814):412.
- 30. Damman K, van Deursen VM, Navis G, Voors AA, van Veldhuisen DJ, Hillege HL. Increased central venous pressure is associated with impaired renal function and mortality in a broad spectrum of patients with cardiovascular disease. J Am Coll Cardiol. 2009;53(7):582–8.http://dx.doi.org/10.1016/j.jacc.2008.08.080.
- 31. Rudski LG, Lai WW, Afilalo J, Hua L, Handschumacher MD, Chandrasekaran K, et al. Guidelines for the echocardiographic assessment of the right heart in adults: a report from the American Society of Echocardiography endorsed by the European Association of Echocardiography, a registered branch of the European Society of Cardiology, and the Canadian Society of Echocardiography. J Am Soc Echocardiogr. 2010;23(7):685–8.http://dx.doi.org/10.1016/j.echo.2010.05.010.
- 32. Brennan JM, Blair JE, Goonewardena S, Ronan A, Shah D, Vasaiwala S, et al. A comparison by medicine residents of physical examination versus hand-carried ultrasound for estimation of right atrial pressure. Am J Cardiol. 2007;99(11):1614–6.http://dx.doi.org/10.1016/j.amjcard.2007.01.037.
- 33. Laffin LJ, Patel AV, Saha N, Barbat J, Hall JK, Cain M, et al. Focused cardiac ultrasound as a predictor of readmission in acute decompensated heart failure. Int J Cardiovasc Imaging. 2018;34(7):1075–9.http://dx.doi.org/10.1007/s10554-018-1317-1.
- 34. Jobs A, Vonthein R, König IR, Schäfer J, Nauck M, Haag S, et al. Inferior vena cava ultrasound in acute decompensated heart failure: design rationale of the CAVA-ADHF-DZHK10 trial. ESC Heart Fail. 2020;7(3):973–83.http://dx.doi.org/10.1002/ehf2.12598.
- 35. Millington SJ. Ultrasound assessment of the inferior vena cava for fluid responsiveness: easy, fun, but unlikely to be helpful. Can J Anaesth. 2019;66(6):633–8.http://dx.doi.org/10.1007/s12630-019-01357-0.
- 36. Duwat A, Zogheib E, Guinot P, Levy F, Trojette F, Diouf M, et al. The gray zone of the qualitative assessment of respiratory changes in inferior vena cava diameter in ICU patients. Crit Care. 2014;18(1):R14. Published 2014 Jan 14.http://dx.doi.org/10.1186/cc13693.
- 37. Vieillard-Baron A, Evrard B, Repessé X, Maizel J, Jacob C, Goudelin M, et al. Limited value of end-expiratory inferior vena cava diameter to predict fluid responsiveness impact of intra-abdominal pressure. Intensive Care Med. 2018;44(2):197–203.http://dx.doi.org/10.1007/s00134-018-5067-2.
- 38. Feissel M, Michard F, Faller JP, Teboul JL. The respiratory variation in inferior vena cava diameter as a guide to fluid therapy. Intensive Care Med. 2004;30(9):1834–7.http://dx.doi.org/10.1007/s00134-004-2233-5.
- 39. Kory P. COUNTERPOINT: should acute fluid resuscitation Be guided primarily by inferior vena cava ultrasound for patients in shock? No. Chest. 2017;151(3):533–6.
- 40. Rosenkranz S, Howard LS, Gomberg-Maitland M, Hoeper MM. Systemic consequences of pulmonary hypertension and right-sided heart failure. Circulation. 2020;141(8):678–93.http://dx.doi.org/10.1161/CIRCULATIONAHA.116.022362.
- 41. Faubel S, Edelstein CL. Mechanisms and mediators of lung injury after acute kidney injury. Nat Rev Nephrol. 2016;12(1):48–60.http://dx.doi.org/10.1038/nrneph.2015.158.
- 42. Sundaram V, Fang JC. Gastrointestinal and liver issues in heart failure. Circulation. 2016;133(17):1696–703.http://dx.doi.org/10.1161/CIRCULATIONAHA.115.020894.
- 43. Fadel BM, Vriz O, Alassas K, Galzerano D, Alamro B, Mohty D. Manifestations of cardiovascular disorders on Doppler interrogation of the hepatic veins. JACC Cardiovasc Imaging. 2019;12(9):1872–7.http://dx.doi.org/10.1016/j.jcmg.2019.01.028.
- 44. Scheinfeld MH, Bilali A, Koenigsberg M. Understanding the spectral Doppler waveform of the hepatic veins in health and disease. Radiographics. 2009;29(7):2081–98.http://dx.doi.org/10.1148/rg.297095715.
- 45. Singh S, Koratala A. Utility of Doppler ultrasound derived hepatic and portal venous waveforms in the management of heart failure exacerbation. Clin Case Rep. 2020 May 20;8:1489–93.
- 46. McNaughton DA, Abu-Yousef MM. Doppler US of the liver made simple. Radiographics. 2011;31(1):161–88.http://dx.doi.org/10.1148/rg.311105093.
- 47. Catalano D, Caruso G, DiFazzio S, Carpinteri G, Scalisi N, Trovato GM. Portal vein pulsatility ratio and heart failure. J Clin Ultrasound. 1998;26(1):27–31.http://dx.doi.org/10.1002/(sici)1097-0096(199801)26:1<27::aid-jcu6>3.0.co;2-l.
- 48. Beaubien-Souligny W, Benkreira A, Robillard P, Bouabdallaoui N, Chassé M, Desjardins G, et al. Alterations in portal vein flow and intrarenal venous flow are associated with acute kidney injury after cardiac surgery: a prospective observational cohort study. J Am Heart Assoc. 2018;7(19):e009961.http://dx.doi.org/10.1161/JAHA.118.009961.
- 49. Abu-Yousef MM. Normal and respiratory variations of the hepatic and portal venous duplex Doppler waveforms with simultaneous electrocardiographic correlation. J Ultrasound Med. 1992;11(6):263–8.http://dx.doi.org/10.7863/jum.1992.11.6.263.
- 50. Baik SK. Haemodynamic evaluation by Doppler ultrasonography in patients with portal hypertension: a review. Liver Int. 2010;30(10):1403–13.http://dx.doi.org/10.1111/j.1478-3231.2010.02326.x.
- 51. Zironi G, Gaiani S, Fenyves D, Rigamonti A, Bolondi L, Barbara L. Value of measurement of mean portal flow velocity by Doppler flowmetry in the diagnosis of portal hypertension. J Hepatol. 1992;16(3):298–303.http://dx.doi.org/10.1016/s0168-8278(05)80660-9.
- 52. Tang WH, Kitai T. Intrarenal venous flow: a window into the congestive kidney failure phenotype of heart failure?JACC Heart Fail. 2016;4(8):683–6.http://dx.doi.org/10.1016/j.jchf.2016.05.009.
- 53. Iida N, Seo Y, Sai S, Machino-Ohtsuka T, Yamamoto M, Ishizu T, et al. Clinical implications of intrarenal hemodynamic evaluation by Doppler ultrasonography in heart failure. JACC Heart Fail. 2016;4(8):674–82.http://dx.doi.org/10.1016/j.jchf.2016.03.016.
- 54. Husain-Syed F, Birk HW, Ronco C, Schörmann T, Tello K, Richter MJ, et al. Doppler-derived renal venous stasis index in the prognosis of right heart failure. J Am Heart Assoc. 2019;8(21):e013584.http://dx.doi.org/10.1161/JAHA.119.013584.
- 55. Nijst P, Martens P, Dupont M, Tang WHW, Mullens W. Intrarenal flow alterations during transition from euvolemia to intravascular volume expansion in heart failure patients. JACC Heart Fail. 2017;5(9):672–81.http://dx.doi.org/10.1016/j.jchf.2017.05.006.
- 56. Beaubien-Souligny W, Rola P, Haycock K, Bouchard J, Lamarche Y, Spiegel R, et al. Quantifying systemic congestion with Point-Of-Care ultrasound: development of the venous excess ultrasound grading system. Ultrasound J. 2020;12(1):16.http://dx.doi.org/10.1186/s13089-020-00163-w.
- 57. Koratala A, Ronco C, Kazory A. The promising role of lung ultrasound in assessment of volume status for patients receiving maintenance renal replacement therapy. Blood Purif. 2020;49(6):643–6.http://dx.doi.org/10.1159/000505529.
- 58. Mullens W, Damman K, Harjola VP, Mebazaa A, Brunner-La Rocca HP, Martens P, et al. The use of diuretics in heart failure with congestion: a position statement from the Heart Failure Association of the European Society of Cardiology. Eur J Heart Fail. 2019;21(2):137–55.http://dx.doi.org/10.1002/ejhf.1369.
- 59. Volpicelli G, Elbarbary M, Blaivas M, Lichtenstein DA, Mathis G, Kirkpatrick AW, et al. International evidence-based recommendations for point-of-care lung ultrasound. Intensive Care Med. 2012;38(4):577–91.http://dx.doi.org/10.1007/s00134-012-2513-4.
- 60. Gargani L, Volpicelli G. How I do it: lung ultrasound. Cardiovasc Ultrasound. 2014 Jul 4;12:25. Published 2014 Jul 4.http://dx.doi.org/10.1186/1476-7120-12-25.
- 61. Maw AM, Hassanin A, Ho PM, McInnes MDF, Moss A, Juarez-Colunga E, et al. Diagnostic accuracy of point-of-care lung ultrasonography and chest radiography in adults with symptoms suggestive of acute decompensated heart failure: a systematic review and meta-analysis. JAMA Netw Open. 2019;2(3):e190703.http://dx.doi.org/10.1001/jamanetworkopen.2019.0703.
- 62. Coiro S, Rossignol P, Ambrosio G, Carluccio E, Alunni G, Murrone A, et al. Prognostic value of residual pulmonary congestion at discharge assessed by lung ultrasound imaging in heart failure. Eur J Heart Fail. 2015;17(11):1172–81.http://dx.doi.org/10.1002/ejhf.344.
- 63. Platz E, Campbell RT, Claggett B, Lewis EF, Groarke JD, Docherty KF, et al. Lung ultrasound in acute heart failure: prevalence of pulmonary congestion and short- and long-term outcomes. JACC Heart Fail. 2019;7(10):849–58.http://dx.doi.org/10.1016/j.jchf.2019.07.008.
- 64. Rivas-Lasarte M, Álvarez-García J, Fernández-Martínez J, Maestro A, López-López L, Solé-González E, et al. Lung ultrasound-guided treatment in ambulatory patients with heart failure: a randomized controlled clinical trial (LUS-HF study). Eur J Heart Fail. 2019;21(12):1605–13.http://dx.doi.org/10.1002/ejhf.1604.
- 65. Kazory A, Bargman JM. Defining the role of peritoneal dialysis in management of congestive heart failure. Expert Rev Cardiovasc Ther. 2019;17(7):533–43.http://dx.doi.org/10.1080/14779072.2019.1637254.
- 66. Ikeda Y, Ishii S, Fujita T, Iida Y, Kaida T, Nabeta T, et al. Prognostic impact of intestinal wall thickening in hospitalized patients with heart failure. Int J Cardiol. 2017;230:120–6.http://dx.doi.org/10.1016/j.ijcard.2016.12.063.