What was known before
In observational studies, drinking more water associates with a slower rate of kidney function decline in adults.
Whether supplemental water intake can preserve kidney function in patients with chronic kidney disease is unknown.
What this adds
A common question in a kidney clinic is “How much water should I drink?” The Chronic Kidney Disease Water Intake Trial will provide new information on the 1-year effect of a higher vs usual water intake on kidney function, plasma copeptin, microalbuminuria, and quality of life in adults with chronic kidney disease.
Introduction
The purported benefits of drinking more water are largely untested, with many unfounded claims in the popular media.- However, there is now a growing body of evidence on the specific effect of increased water intake on the kidney. Increased water intake has been shown to reduce the risk of kidney stones (a greater urine flow rate may lower the supersaturation of calcium oxalate, calcium phosphate, and uric acid) and lower the risk of stone formation,- and guidelines recommend drinking water to achieve a urine output of 2.0 to 2.5 L/day to reduce the risk of stone recurrence., In polycystic kidney disease, there is some evidence that increased water intake may slow the growth of renal cysts via suppression of vasopressin;- however, this has yet to be confirmed in a clinical trial.- Most recently, chronic dehydration and volume depletion resulting from extreme occupational heat stress has been identified as a likely cause of an epidemic of chronic kidney disease in Central America.- Scientists are now investigating the epidemiology of heat-stress nephropathy across the globe.-
The relationship between water intake and the estimated glomerular filtration rate (eGFR) has been investigated in several observational studies; however, results are mixed. In a retrospective analysis of adults patients with chronic kidney disease in the Modification of Diet in Renal Disease study, higher urine volumes were associated with a greater decline in eGFR; however, this association lost significance after controlling for diuretics and antihypertensive medication use. By contrast, in a prospective cohort study of adults free of chronic kidney disease at study entry, higher urine volumes at baseline were associated with a slower decline in eGFR over 7 years, and those with the largest urine volumes (>3L/day) were the least likely to demonstrate a rapid decline in eGFR (defined as a decline ≥5%/year). These results persisted after adjusting for age, gender, baseline eGFR, medication use for hypertension (including diuretics), proteinuria, diabetes, and cardiovascular disease. Interestingly, in studies examining the effects of plain water intake vs other fluids, increased intake of plain water is more often associated with a decreased risk of chronic kidney disease; however, increased intake of sweetened beverages is associated with an increased risk.- Similarly, while the risk of kidney stone recurrence is reduced with greater intake of plain water,, the risk of stone recurrence is increased with greater intake of sweetened beverages, possibly due to the high fructose content, which has been shown to increase the urinary excretion of calcium, oxalate, and uric acid.-
While these studies provide preliminary evidence that drinking more water may have a beneficial effect on kidney function, it remains unknown whether supplemental water intake can benefit patients with chronic kidney disease. Urine concentrating capacity is reduced as kidney function declines, and thus some patients with chronic kidney disease may have high 24-hour urine volumes while being slightly volume depleted, which makes it difficult to isolate causal effects in observational studies. To provide further insight into this question, we designed a randomized controlled trial to examine the effects of an increased vs usual water intake on kidney function in adults with chronic kidney disease—the Chronic Kidney Disease Water Intake Trial (WIT). In this parallel-group trial, participants randomized to the hydration group are coached to drink 1.0 to 1.5 L of water per day (depending on weight and sex), over and above their usual fluid intake, for 1 year. Participants randomized to the control group are asked to continue with their usual fluid intake during this time. The primary outcome of this trial is change in kidney function at 1 year. The trial design and methods were informed by a 6-week randomized pilot trial, which confirmed the safety and feasibility of asking adults with chronic kidney disease to increase their water intake by 1.0 to 1.5 L/day., The current protocol describes the objectives, methods, and analytic plan for the WIT main trial. To our knowledge, this will be the first clinical trial on record to test the impact of a sustained increase in water intake over 1 year in patients with chronic kidney disease.
Primary objective: To examine the effect of increased water intake over 1 year on change in eGFR among patients with chronic kidney disease.
Secondary objectives: To examine the effect of increased water intake over 1 year on change in plasma copeptin concentration, 24-hour urine albumin-to-creatinine ratio, measured creatinine clearance, the estimated 5-year risk of kidney failure (using the 4-variable Kidney Failure Risk Equation), and health-related quality of life. We will also establish the safety of increased water intake in this population by monitoring for electrolyte disturbances, particularly hyponatremia.
Methods
Design, Setting, and Participants
WIT is a parallel-group, open-label, 9-center randomized controlled trial. Recruitment and randomization (detailed below) occurred between May 2013 and May 2016; follow-up for the primary outcome will continue until June 2017 (trial registration: www.clinicaltrials.gov; government identifier: NCT01766687). Ethics approval was obtained from Western University’s Health Sciences Research Ethics Board.
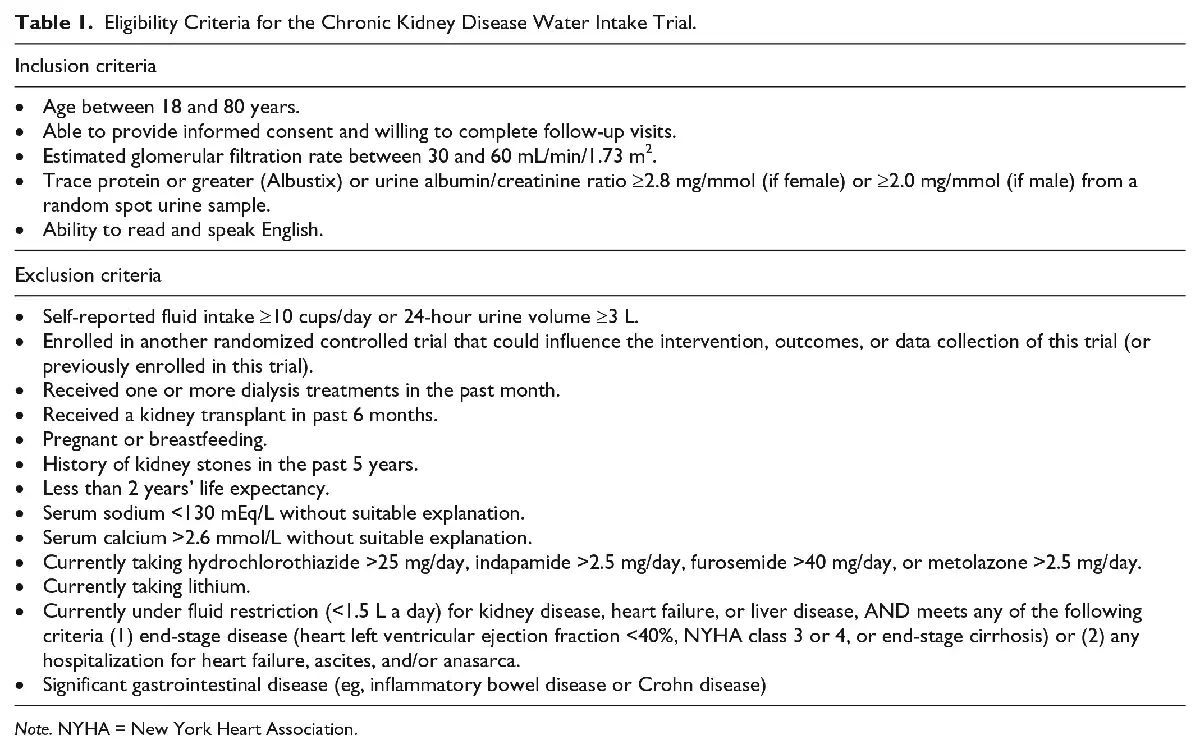
Adult patients with stage 3 chronic kidney disease were recruited from 9 chronic kidney disease clinics across Southwestern Ontario (Canada) in London (3 centers), Guelph (1 center), Hamilton (1 center), Oakville (2 centers), and Windsor (2 centers). The patient’s nephrologist invited interested potential participants to speak with a research assistant who explained the study and confirmed study eligibility (patient eligibility criteria are fully detailed in Table 1). All participants had to have stage 3 chronic kidney disease (eGFR 30-60 mL/min/1.73 m2) and microalbuminuria (defined as albumin/creatinine >2.8 mg/mmol if female, or >2.0 mg/mmol if male, or trace protein or greater from a random spot urine sample on an Albustix). Exclusion criteria (fully detailed in Table 1) included self-reported fluid intake ≥10 cups/day or a 24-hour urine volume ≥3L; a history of kidney stones in the past 5 years; or currently taking lithium, hydrochlorothiazide >25 mg/day, indapamide >2.5 mg/day, furosemide >40 mg/day, or metolazone >2.5 mg/day.
After providing written informed consent, participants were asked to provide a prerandomization baseline 24-hour urine sample within 2 weeks (details provided in Data Collection and Measures section) to confirm that urine volume was below 3 L/day; participants were not randomized until their 24-hour urine samples were collected and analyzed.
Randomized Allocation
Once study eligibility was confirmed, a research assistant contacted the participant by telephone to complete the randomization; concealed randomized allocation occurred by computer-generated randomization while the participant was on the phone. Participants were randomized (1:1) in random permuted blocks of varying sizes to the hydration group or the control group, stratified by center and gender. By necessity, research staff and participants were aware of the randomized group assignment; however, outcome assessors (technicians performing the laboratory measurements for the primary and secondary outcomes) are blinded to the random allocation, and the trial statistician will be blinded to patient allocation for the primary analysis.
Intervention Group
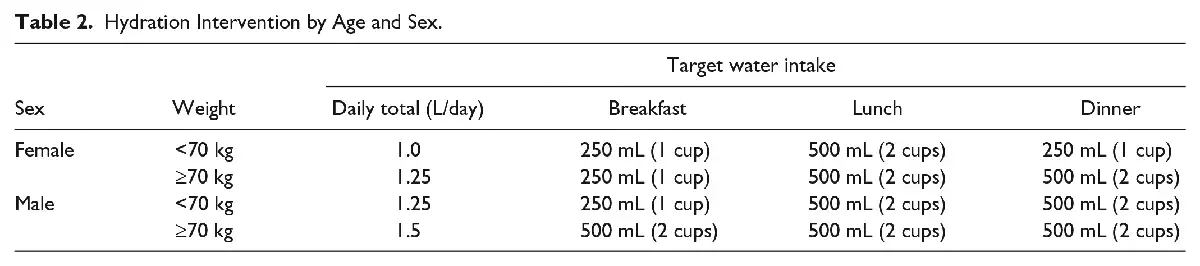
Participants in the hydration group were coached to increase their oral water intake by 1.0 to 1.5 L/day (depending on sex and weight), over and above usual consumed beverages, for 1 year (detailed in Table 2). These water-intake levels were determined based on a review of prior literature,,,- and what we believed was safe in this population of patients with chronic kidney disease (considering that there is uncertainty in the benefit of additional water intake between 1.5 and 2.5 L/day, but risk of a total fluid intake below 1.0 L/day or greater than 4 L/day in kidney patients), and also demonstrated to be feasible in our pilot trial., A gradual increase in water intake was advised in the 2 weeks following randomization: during week 1, participants were instructed to consume 1 cup of water at breakfast, lunch, and dinner; and during week 2, the full amount according to weight and sex. Participants in the hydration group received reusable drinking containers and were mailed 20 vouchers per month; each voucher was redeemable for 1.5 L of bottled water.
Control Group
Participants in the control group were coached to continue with their usual fluid intake or to decrease intake by 0.25 to 0.5 L/day (1-2 cups/day) if their baseline 24-hour urine volume was >1.5L/day and 24-hour urine osmolality was <500 mOsm/kg).
We conducted monthly coaching with all participants (in both intervention and control groups) using interviewer-administered standardized surveys with questions on daily water intake. Coaching also included a discussion of urine color charts (showing the spectrum of dilute to concentrated urine), which were provided to all participants after randomization. Participants in the hydration group were encouraged to increase their water intake if daily intake fell below the target amount (based on sex and weight as shown in Table 2) or if they reported that their urine color was not light or clear (based on the urine color charts). Participants in the control group were asked to maintain as closely as possible the same amount ingested as reported at baseline. Coaching continued at monthly intervals for all participants for 12 months after randomization.
Data Collection and Measures
The schedule of study measures is provided in Table 3. At baseline, a research assistant measured each participant’s height, weight, and blood pressure following a standardized protocol, and conducted an interviewer-administered health survey with questions on sociodemographics, medical history, smoking status, medication use, and fluid intake; this questionnaire also included 4 questions from the Kidney Disease Health-Related Quality of Life–Short Form (items 10, 17, 18, and 22), which relate to overall health, quality of life, and sleep., In addition, participants were asked about their appetite and frequency of urination during the day and night. The health survey (interviewer administered) was completed again over the phone or in person at 6 and 12 months after randomization. Weight and blood pressure were measured at the participants’ next kidney care clinic visit, approximately 8 to 12 months after enrollment. Participants also completed a 3-day diet record at baseline and again at 6 months, which they mailed back to the study center in a preaddressed postage-paid envelope; 3-day diet records were analyzed by The Food Processor (ESHA: Elizabeth Stewart Hands and Associates Research 2016 version 11.2) and a renal dietician provided individual consultations with participants to discuss their results on protein and sodium intake (participants were advised to follow a target intake of 0.8 g/kg/day of protein and 100 mmol/day of sodium).
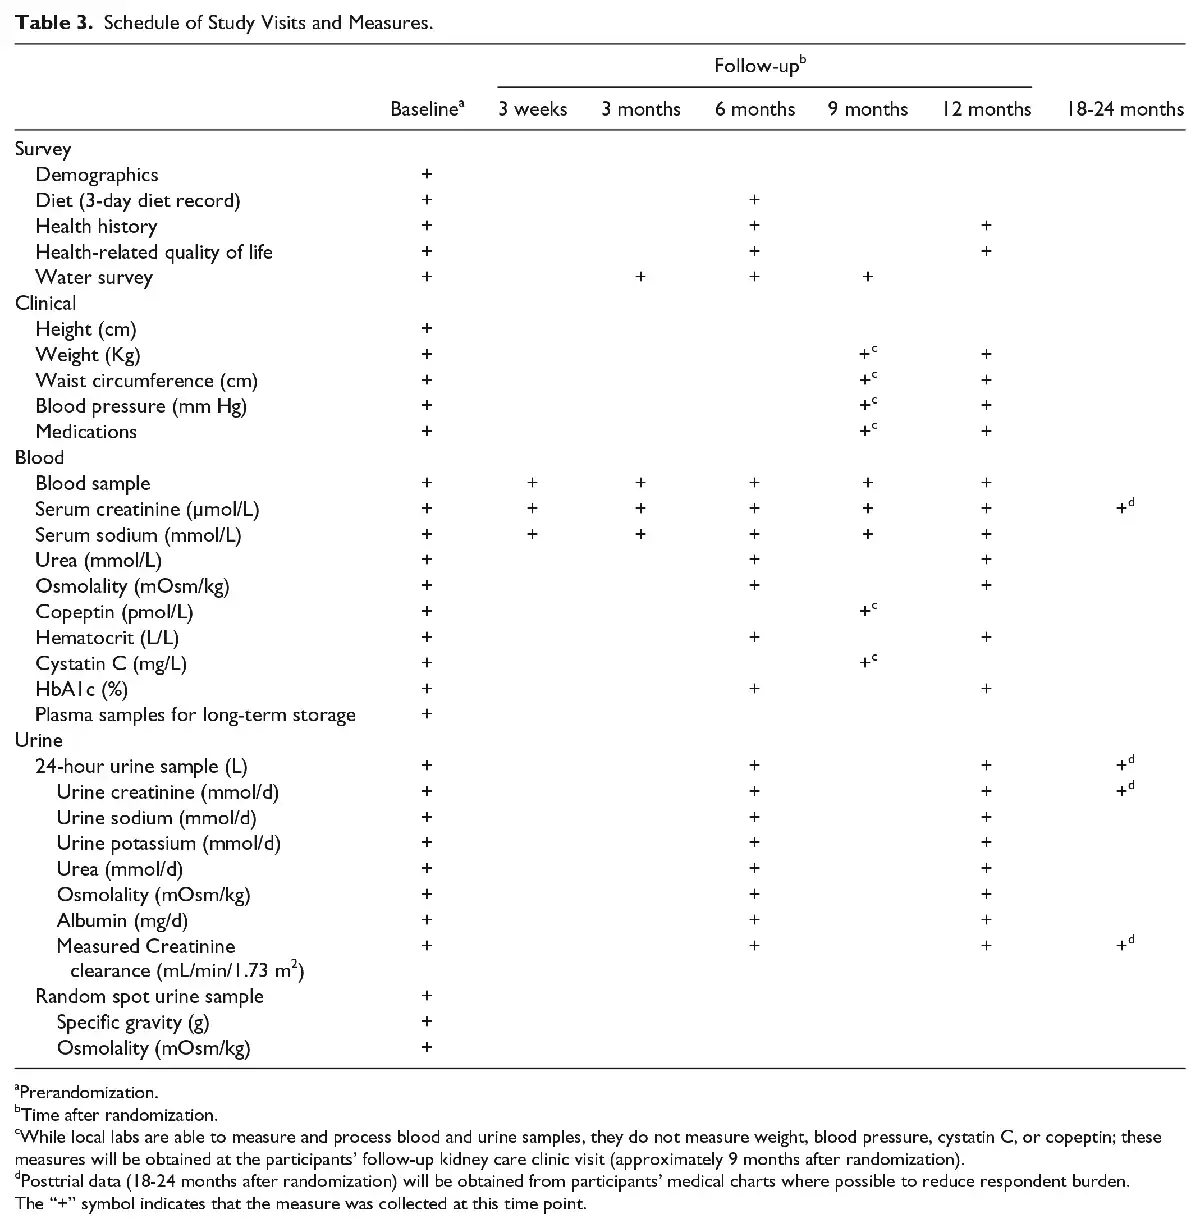
Participants were instructed to collect a 24-hour urine sample (using a standard collection jug provided to them) within 2 weeks of enrollment and again at 6 and 12 months after randomization. Participants were able to deliver the 24-hour urine collection to a local laboratory (eg, LifeLabs, Gamma Dynacare, or Medical Laboratories of Windsor) or to the study center. The 24-hour urine samples were analyzed for the following measures: the albumin-to-creatinine ratio (measured using turbidimetric methods), sodium and potassium (measured using indirect potentiometry), urea (measured using enzymatic photometric methods), osmolality (measured using freezing point depression with an advanced instrument Micro-Osmometer), and creatinine clearance (body surface area corrected in mL/min/1.73 m2). In addition, to examine whether there was any lasting effect of the intervention after coaching stopped at 12 months, we collected data on 24-hour urine volume and creatinine from participant medical charts 18 to 24 months after randomization.
Participants provided nonfasting 10-mL blood samples at baseline, at 3 weeks after randomization, and then again at 3-month intervals after randomization until 12-months. Blood samples could be provided at the study research center or a local laboratory facility as described above. Serum creatinine was measured using the isotope dilution/mass spectroscopy–traceable enzymatic method, and eGFR was calculated using the Chronic Kidney Disease Epidemiology Collaboration (CKD-EPI) equation. Serum sodium was measured using indirect ion-selective electrodes. Other measures analyzed from blood samples at baseline and at 6 and 12 months after randomization included urea concentration (measured with enzymatic photometric methods), osmolality (measured by freezing point depression using an advanced instrument Micro-Osmometer), hematocrit (measured using Beckman Coulter automated cell counters), cystatin C (measured using immunonephelometry), glycated hemoglobin (HbA1c) (measured using nonporous ion exchange high-performance liquid chromatography), and copeptin (a glycosylated peptide that is coreleased with vasopressin from the hypothalamus,); copeptin was measured from nonfasting 150 µL blood samples, stored at −80°C, and analyzed in batches using the sandwich immunoluminometric assay (B.R.A.H.M.S. AG, Hennigsdorf/Berlin, Germany) as described by Morgenthaler et al., To examine whether there was any lasting effect of the intervention after coaching stopped at 12 months, we collected data on serum creatinine from participant medical charts 18 to 24 months after randomization.
Outcomes
Primary outcome
The primary outcome of WIT is the change in eGFR from baseline (prerandomization) to 12 months after randomization.
Secondary outcomes
Key secondary outcomes include the following: Change in plasma copeptin concentration,,-, 24-hour urine albuminuria,, creatinine clearance, estimated 5-year risk of kidney failure (using the 4-variable Kidney Failure Risk Equation), and health-related quality of life from baseline to 12 months after randomization. We will also establish the safety of increased water intake in this population by monitoring for electrolyte disturbances, particularly hyponatremia.
Posttrial outcomes
We will examine the between-group difference in 24-hour urine volume 18 to 24 months after randomization, and the between-group difference in eGFR change from baseline to 18 to 24 months after randomization.
Analysis
We will use SAS version 9.3 (SAS Institute Inc, Cary, NC) for all statistical analysis.
The primary analysis will follow an intention-to-treat approach. The between-group difference on change in eGFR (calculated as eGFR at 12 months minus eGFR at baseline) will be analyzed using linear regression. The following prespecified covariates (measured at baseline) will be adjusted for in the primary analysis: age (in years), sex, obesity (body mass index ≥30 kg/m2), smoking status (current smoker: yes/no), presence of diabetes, albuminuria (mg/d), and use of any of the following medications: an angiotensin-converting enzyme inhibitor or angiotensin receptor blocker, diuretics, beta blockers or calcium channel blockers, and statins. We will include a missing data indicator value for each covariate. We expect that 12-month data on eGFR will be missing for <5% of participants due to death and <10% due to missing data or study withdrawal. For patients who were randomized but are missing a 12-month eGFR value, we will use recommended model-based multiple imputation methods to impute the final eGFR value.- We will perform sensitivity analyses, including a complete-case analysis, to investigate whether conclusions are sensitive to assumptions about the missing-data mechanism.-
We will report the primary outcome as the absolute difference in 12-month eGFR change between randomized groups with a 95% confidence interval. Our current sample size of 631 randomized participants will provide 80% power to detect a difference of at least 1.8 mL/min/1.73 m2 between intervention groups (α = 0.05, independent samples t test, assuming a standard deviation of 8), which represents a small-to-moderate effect size. The primary analysis will be performed 12 months after the last patient has been randomized (date of final follow up expected in June 2017).
Supporting Analyses
We will perform 3 additional analyses using alternative definitions of change in eGFR. For these analyses, a P value ≤ .05 will be interpreted as statistically significant provided there is concordance with the primary results.
Annual percentage change: We will calculate the annual percentage change as: [(final eGFR – baseline eGFR) / baseline eGFR] / [(final date – baseline date) / 365.21] × 100.
Rate of eGFR change: We will estimate the rate of change in eGFR using a mixed-effects model with repeated measures.
Rapid eGFR decline: We will define rapid decline as an eGFR decline >20% from baseline, moderate decline as a decline from 5% to 20%, stable eGFR as a percent change within 5% of baseline values (reference), and increasing eGFR as a rise in eGFR ≥5% from baseline; these cut points were chosen based on a series of studies showing a U-shaped relationship between change in eGFR and risk of end-stage kidney disease and mortality.- The risk of rapid decline will be estimated using a multinomial logistic regression model (reference group: stable eGFR).
We will report adherence to the allocated intervention in each of the 2 groups at 6 and 12 months of follow-up. We will also conduct a per-protocol analysis restricted to participants in the hydration group who maintained a 24-hour urine volume that was at least 0.5 L/day above their baseline value at 6 months and 12 months after randomization, and participants in the control group who maintained a 24-hour urine volume that was <0.5 L/day above their baseline assessment at each follow-up assessment.
Secondary Outcomes
Changes in continuous secondary outcomes (plasma copeptin concentration, creatinine clearance, the 24-hour urine albuminuria, and the 5-year Kidney Failure Risk Equation developed by Tangri et al) will be analyzed using linear regression as described above. Variables will first be assessed for normality and, if not normally distributed, will be transformed as appropriate. Finally, we will also examine the relationship between change in copeptin and kidney function, and examine whether this relationship differs between intervention groups. For all secondary analyses, including health-related quality of life, all between-group differences will be reported using 95% confidence intervals.
Additional Analyses and Posttrial Outcomes
To examine whether there is any lasting effect of the intervention after coaching stopped at 12 months after randomization, we will compare the between-group difference in 24-hour urine volume at baseline and at 6, 12, and 24 months after randomization. We will also compare the between-group difference on change in eGFR between baseline and 24 months after randomization. Finally, we will examine the effect of the intervention on the 1-year change in mean arterial blood pressure, body mass index, and HbA1c.
Safety and Data Monitoring
Trial conduct and safety was monitored by an independent Data Safety and Monitoring Board (DSMB). The DSMB received a descriptive summary of trial data and adverse events at 6- to 9-month intervals, with no planned interim statistical analysis of the primary or secondary outcomes. In terms of safety, a potential risk of increased water consumption among patients with chronic kidney disease is hyponatremia (serum sodium <130 mEq/L). Symptoms can range from mild to severe and include nausea and vomiting, headache, confusion, seizures, and decreased consciousness or coma. While no cases of hyponatremia were observed in our pilot study nor in previous intervention studies of increased water intake among elderly patients, data on serum sodium were monitored closely throughout the trial (blood samples were analyzed for serum sodium at baseline, at 3-weeks after randomization, and every 3 months thereafter). As well, the research coordinator inquired about symptoms of hyponatremia during monthly calls to review intervention adherence and tolerance.
Discussion
To our knowledge, there has never been a randomized controlled trial in chronic kidney disease patients to determine whether increased hydration can preserve kidney function. To provide better estimates of the effect of water intake on kidney function, we designed a randomized controlled trial to examine the effect of increased water intake over 1 year on kidney function in adults with chronic kidney disease. The primary outcome will be change in eGFR at 1 year.
The worldwide prevalence of chronic kidney disease in adults is estimated to be 8% to 16%, affecting over 400 million people., Health care costs for chronic kidney disease exceed $20,000 per patient per year on average, and these costs more than triple when patients progress to kidney failure.,, Unfortunately, few effective low-cost interventions exist to reduce the risk of progressive kidney disease. There is increasing interest in whether vasopressin, an antidiuretic hormone, contributes to chronic kidney disease progression through its effects on renal hemodynamics and blood pressure.,- Vasopressin is the first hormone released during dehydration, and in experimental studies of rats, increased water intake was shown to suppress vasopressin, reduce proteinuria, and improve creatinine clearance., A recent 3-year trial demonstrated that tolvaptan, a vasopressin 2 receptor antagonist used to treat hyponatremia, was effective in slowing kidney function decline in patients with polycystic kidney disease; however, this treatment was associated with high toxicity which resulted in low adherence rates. Increased copeptin, a reliable marker of vasopressin, has also been linked to kidney function decline, micro-albuminuria, myocardial infarction, and end-stage kidney disease.,, ,- The effect of increased water intake on copeptin and the relationship between copeptin and kidney function will be examined in secondary analyses in this trial.
Methods to Minimize Bias
Because our intervention of increased water intake is widely accessible, there is a potential for control-group contamination. To encourage adherence to the assigned intervention and to minimize cross-group contamination, monthly coaching was conducted with all participants for 12 months using a standardized survey with reference to quantity of water ingested relative to the target intake. Coaching also included a discussion of urine color charts (showing the spectrum of dilute to concentrated urine), which were provided to all participants. Intervention adherence will be assessed primarily by 24-hour urine collections (obtained at baseline and at 6 and 12 months after randomization, and analyzed by a local laboratory) and also by self-reported fluid intake (measured at three 3-month intervals during the trial). While we recognize that our study would benefit from other measures of hydration status, our primary outcome will be evaluated using an intention-to-treat analysis where participants are analyzed according to their original randomized group assignment. Nonetheless, at the last data review in December 2016, we observed significant separation between groups with respect to their average 24-hour urine volumes (mean 24-hour urine volume was 2.5 L/day and 1.8 L/day for the intervention and control groups, respectively; P < .001).
To examine whether there is any lasting effect of the intervention after coaching stopped at 12 months after randomization, we will compare the between-group difference in 24-hour urine volume at baseline and at 6, 12, and 24 months after randomization. We will also compare the between-group difference on change in eGFR between baseline and 24 months as a secondary outcome.
To avoid information bias, all participants, irrespective of randomized group assignment, will have the same measurement schedule, including lab testing. While it was not possible to blind participants to intervention allocation, technicians measuring the laboratory outcome variables were unaware of group allocation, and the biostatistician will be blinded to patient allocation for the primary analysis. To minimize missing data, research assistants followed up missing survey responses and discrepant data by telephone. As well, transportation assistance and home visits were offered to participants who were unable to complete the study requirements independently.
Conclusion
Randomized trials provide some of the best estimates of treatment effects. The WIT is a parallel-group randomized controlled trial that will estimate the effect of increased water intake over 1 year on change in eGFR, plasma copeptin, microalbuminuria, and health-related quality of life in adults with chronic kidney disease. To our knowledge, this will be the first clinical trial of increased water intake in patients with chronic kidney disease. The significant separation between groups on 24-hour urine volume at 12 months after randomization means that we will have reliable estimates of the impact of increased water intake on change in eGFR and copeptin, and other indicators of kidney function. While we recognize that these are surrogate outcomes, the results of this trial will be important for understanding the relationship between increased water intake and kidney health, and may provide support for conducting a larger, definitive randomized controlled trial in the future.
Ethics Approval and Consent to Participate Ethics approval was obtained from Western University’s Health Sciences Research Ethics Board. All participants provided written informed consent.
Consent for Publication Consent for publication was obtained from all authors.
Availability of Data and Materials Available from the authors upon request.
Declaration of Conflicting Interests The author(s) declared the following potential conflicts of interest with respect to the research, authorship, and/or publication of this article: William Clark and Louise Moist have received consulting fees or honoraria and support to travel to meetings from Danone Research. Amit Garg is supported by the Dr Adam Linton Chair in Kidney Health Analytics and a Canadian Institutes of Health Research Clinician Researcher Award.
Funding The author(s) disclosed receipt of the following financial support for the research, authorship, and/or publication of this article: This trial is funded by Danone Research and the Program of Experimental Medicine, Western University, Canada. The study sponsors had no direct role in the design of this trial or drafting of this manuscript. Drs Clark and Moist have received speaking honoraria from Danone Research.
References
- 1. Vreeman RC, Carroll AE. Medical myths. BMJ. 2007;335(7633):1288–1289.
- 2. Lette F, Dwyer JP. The fluid craze. Lancet. 2008;372(9641):782.
- 3. Valtin H. “Drink at least eight glasses of water a day.” Really? Is there scientific evidence for “8 x 8”? Am J Physiol Regul Integr Comp Physiol. 2002;283(5):R993–1004.
- 4. Clark WF, Sontrop JM, Huang S-H, Moist L, Bouby N, Bankir L. Hydration and chronic kidney disease progression: a critical review of the evidence. Am J Nephrol. 2016;43(4):281–292.
- 5. Borghi L, Meschi T, Amato F, Briganti A, Novarini A, Giannini A. Urinary volume, water and recurrences in idiopathic calcium nephrolithiasis: a 5-year randomized prospective study. J Urol. 1996;155:839–843.
- 6. Cheungpasitporn W, Rossetti S, Friend K, Erickson SB, Lieske JC. Treatment effect, adherence, and safety of high fluid intake for the prevention of incident and recurrent kidney stones: a systematic review and meta-analysis. J Nephrol. 2015;29(2):211–219.
- 7. Dawson CH, Tomson CRV. Kidney stone disease: pathophysiology, investigation and medical treatment. Clin Med. 2012;12(5):467–471.
- 8. Pearle MS, Goldfarb DS, Assimos DG, et al; for American Urological Association. Medical management of kidney stones: AUA guideline. J Urol. 2014;192(2):316–324.
- 9. Qaseem A, Dallas P, Forciea MA, Starkey M, Denberg TD. Dietary and pharmacologic management to prevent recurrent nephrolithiasis in adults: a clinical practice guideline from the American College of Physicians. Ann Intern Med. 2014;161(9):659–667.
- 10. Nagao S, Nishii K, Katsuyama M, et al. Increased water intake decreases progression of polycystic kidney disease in the PCK rat. J Am Soc Nephrol. 2006;17(8):2220–2227.
- 11. Wang X, Wu Y, Ward CJ, Harris PC, Torres VE. Vasopressin directly regulates cyst growth in polycystic kidney disease. J Am Soc Nephrol. 2008;19:102–108.
- 12. Torres VE, Bankir L, Grantham JJ. A case for water in the treatment of polycystic kidney disease. Clin J Am Soc Nephrol. 2009;4:1140–1150.
- 13. Wang CJ, Creed C, Winklhofer FT, Grantham JJ. Water prescription in autosomal dominant polycystic kidney disease: a pilot study. Clin J Am Soc Nephrol. 2011;6:192–197.
- 14. Higashihara E, Nutahara K, Tanbo M, et al. Does increased water intake prevent disease progression in autosomal dominant polycystic kidney disease? Nephrol Dial Transplant. 2014;29(9):1710–1719.
- 15. Barash I, Ponda MP, Goldfarb DS, Skolnik EY. A pilot clinical study to evaluate changes in urine osmolality and urine cAMP in response to acute and chronic water loading in autosomal dominant polycystic kidney disease. Clin J Am Soc Nephrol. 2010;5(4):693–697.
- 16. Wesseling C, Crowe J, Hogstedt C, Jakobsson K, Lucas R, Wegman DH. Resolving the enigma of the mesoamerican nephropathy: a research workshop summary. Am J Kidney Dis. 2014;63(3):396–404.
- 17. Weiner DE, McClean MD, Kaufman JS, Brooks DR. The Central American epidemic of CKD. Clin J Am Soc Nephrol. 2013;8(3):504–511.
- 18. Laws RL, Brooks DR, Amador JJ, et al. Changes in kidney function among Nicaraguan sugarcane workers. Int J Occup Environ Health. 2015;21(3):241–250.
- 19. Laws RL, Brooks DR, Amador JJ, et al. Biomarkers of kidney injury among Nicaraguan sugarcane workers. Am J Kidney Dis. 2015;67(2):209–217.
- 20. Glaser J, Lemery J, Rajagopalan B, et al. Climate change and the emergent epidemic of CKD from heat stress in rural communities: the case for heat stress nephropathy. Clin J Am Soc Nephrol. 2016;11(8):1472–1483.
- 21. Hansen AL, Bi P, Ryan P, Nitschke M, Pisaniello D, Tucker G. The effect of heat waves on hospital admissions for renal disease in a temperate city of Australia. Int J Epidemiol. 2008;37(6):1359–1365.
- 22. Bobb JF, Obermeyer Z, Wang Y, Dominici F. Cause-specific risk of hospital admission related to extreme heat in older adults. JAMA. 2014;312(24):2659–2667.
- 23. Fletcher BA, Lin S, Fitzgerald EF, Hwang S-A. Association of summer temperatures with hospital admissions for renal diseases in New York State: a case-crossover study. Am J Epidemiol. 2012;175(9):907–916.
- 24. Hebert LA, Greene T, Levey A, Falkenhain ME, Klahr S. High urine volume and low urine osmolality are risk factors for faster progression of renal disease. Am J Kidney Dis. 2003;41:962–971.
- 25. Clark WF, Sontrop JM, Macnab JJ, et al. Urine volume and change in estimated GFR in a community-based cohort study. Clin J Am Soc Nephrol. 2011;6(11):2634–2641.
- 26. Sontrop JM, Dixon SN, Garg AX, et al. Association between water intake, chronic kidney disease, and cardiovascular disease: a cross-sectional analysis of NHANES data. Am J Nephrol. 2013;37:434–442.
- 27. Shoham DA, Durazo-Arvizu R, Kramer H, et al. Sugary soda consumption and albuminuria: results from the National Health and Nutrition Examination Survey, 1999-2004. PLoS ONE. 2008;3:e3431.
- 28. Saldana TM, Basso O, Darden R, Sandler DP. Carbonated beverages and chronic kidney disease. Epidemiology. 2007;18(4):501.
- 29. Yuzbashian E, Asghari G, Mirmiran P, Zadeh-Vakili A, Azizi F. Sugar-sweetened beverage consumption and risk of incident chronic kidney disease: Tehran lipid and glucose study. Nephrology. 2016;21(7):608–616.
- 30. Bomback AS, Derebail VK, Shoham DA, et al. Sugar-sweetened soda consumption, hyperuricemia, and kidney disease. Kidney Int. 2010;77(7):609–616.
- 31. Karalius VP, Shoham DA. Dietary sugar and artificial sweetener intake and chronic kidney disease: a review. Adv Chronic Kidney Dis. 2013;20(2):157–164.
- 32. Cheungpasitporn W, Thongprayoon C, O’Corragain OA, Edmonds PJ, Kittanamongkolchai W, Erickson SB. Associations of sugar-sweetened and artificially sweetened soda with chronic kidney disease: a systematic review and meta-analysis. Nephrology (Carlton). 2014;19(12):791–797.
- 33. Shuster J, Jenkins A, Logan C, et al. Soft drink consumption and urinary stone recurrence: a randomized prevention trial. J Clin Epidemiol. 1992;45(8):911–916.
- 34. Ferraro PM, Taylor EN, Gambaro G, Curhan GC. Soda and other beverages and the risk of kidney stones. Clin J Am Soc Nephrol. 2013;8(8):1389–1395.
- 35. Nguyen NU, Dumoulin G, Henriet MT, Regnard J. Increase in urinary calcium and oxalate after fructose infusion. Horm Metab Res. 1995;27(3):155–158.
- 36. Fox IH, Kelley WN. Studies on the mechanism of fructose-induced hyperuricemia in man. Metabolism. 1972;21(8):713–721.
- 37. Clark WF, Sontrop JM, Huang SH, et al. The chronic kidney disease Water Intake Trial (WIT): results from the pilot randomised controlled trial. BMJ Open. 2013;3(12):e003666.
- 38. Sontrop JM, Huang S-H, Garg AX, et al. Effect of increased water intake on plasma copeptin in patients with chronic kidney disease: results from a pilot randomised controlled trial. BMJ Open. 2015;5(11):e008634.
- 39. Tangri N, Grams ME, Levey AS, et al. Multinational assessment of accuracy of equations for predicting risk of kidney failure: a meta-analysis. JAMA. 2016;315(2):164–174.
- 40. National Kidney Foundation. K/DOQI Clinical practice guidelines for chronic kidney disease: evaluation, classification, and stratification. Am J Kidney Dis. 2002;39(2)(Suppl 1):S1–266.
- 41. Spigt M, van Schayck O, Knipschild P, et al. Is it possible to improve elderly male bladder function by having them drink more water? A randomized trial of effects of increased fluid intake/urine output on male lower urinary tract function. Urology. 2006;68(5):1031–1036.
- 42. Spigt MG, Knottnerus JA, van de Beek C, van Kerrebroeck PE, van Amelsvoort LG, van Schayck CPO. Short-term effects of increased urine output on male bladder function and lower urinary tract symptoms. Urology. 2004;64(3):499–503.
- 43. Spigt MG, Knottnerus JA, Westerterp KR, Olde Rikkert MG, Schayck CP. The effects of 6 months of increased water intake on blood sodium, glomerular filtration rate, blood pressure, and quality of life in elderly (aged 55-75) men. J Am Geriatr Soc. 2006;54:438–443.
- 44. Akers JD, Cornett RA, Savla JS, Davy KP, Davy BM. Daily self-monitoring of body weight, step count, fruit/vegetable intake, and water consumption: a feasible and effective long-term weight loss maintenance approach. J Acad Nutr Diet. 2012;112(5):685–692.e2.
- 45. Hays RD, Kallich J, Mapes D, et al. Kidney Disease Quality of Life Short Form (KDQOL-SF TM), Version 1.3 [Internet]. RAND Corporation; 1997. http://www.rand.org/pubs/papers/P7994.html. Accessed July 25, 2017
- 46. Hays RD, Kallich JD, Mapes DL, Coons SJ, Carter WB. Development of the kidney disease quality of life (KDQOL) instrument. Qual Life Res. 1994;3(5):329–338.
- 47. Levey AS, Stevens LA, Schmid CH, et al. A new equation to estimate glomerular filtration rate. Ann Intern Med. 2009;150(9):604–612.
- 48. Morgenthaler NG, Struck J, Alonso C, Bergmann A. Assay for the measurement of copeptin, a stable peptide derived from the precursor of vasopressin. Clin Chem. 2006;52:112–119.
- 49. Roussel R, Fezeu L, Marre M, et al. Comparison between copeptin and vasopressin in a population from the community and in people with chronic kidney disease. J Clin Endocrinol Metab. 2014;99:4656–4663.
- 50. Morgenthaler NG, Struck J, Jochberger S, Dünser MW. Copeptin: clinical use of a new biomarker. Trends Endocrinol Metab. 2008;19(2):43–49.
- 51. Velho G, Bouby N, Hadjadj S, et al. Plasma copeptin and renal outcomes in patients with type 2 diabetes and albuminuria. Diabetes Care. 2013;36(11):3639–3645.
- 52. Bolignano D, Zoccali C. Vasopressin beyond water: implications for renal diseases. Curr Opin Nephrol Hypertens. 2010;19:499–504.
- 53. Meijer E, Bakker SJ, de Jong PE, et al. Copeptin, a surrogate marker of vasopressin, is associated with accelerated renal function decline in renal transplant recipients. Transplantation. 2009;88:561–567.
- 54. Methven S, Macgregor MS, Glas F, et al. Comparison of urinary albumin and urinary total protein as predictors of patient outcomes in CKD. Am J Kidney Dis. 2011;57(1):21–28.
- 55. Cravedi P, Ruggenenti P, Remuzzi G. Proteinuria should be used as a surrogate in CKD. Nat Rev Nephrol. 2012;8(5):301–306.
- 56. White IR, Thompson SG. Adjusting for partially missing baseline measurements in randomized trials. Stat Med. 2005;24(7):993–1007.
- 57. Little RJ, D’Agostino R, Cohen ML, et al. The prevention and treatment of missing data in clinical trials. N Engl J Med. 2012;367(14):1355–1360.
- 58. Carpenter JR, Kenward MG. Missing data in randomised controlled trials—a practical guide. 2007. http://citeseerx.ist.psu.edu/viewdoc/download?doi=10.1.1.468.9391&rep=rep1&type=pdf. Accessed January, 2017.
- 59. Garg AX, Kurz A, Sessler DI, et al. Perioperative aspirin and clonidine and risk of acute kidney injury: a randomized clinical trial. JAMA. 2014;312(21):2254–2264.
- 60. Xie Y, Bowe B, Xian H, Balasubramanian S, Al-Aly Z. Rate of kidney function decline and risk of hospitalizations in stage 3A CKD. Clin J Am Soc Nephrol. 2015;10(11):1946–1955.
- 61. Perkins RM, Bucaloiu ID, Kirchner HL, Ashouian N, Hartle JE, Yahya T. GFR decline and mortality risk among patients with chronic kidney disease. Clin J Am Soc Nephrol. 2011;6(8):1879–1886.
- 62. Kovesdy CP, Coresh J, Ballew SH, et al. Past decline versus current eGFR and subsequent ESRD risk. J Am Soc Nephrol. 2016;27(8):2447–2455.
- 63. Naimark DMJ, Grams ME, Matsushita K, et al. Past decline versus current eGFR and subsequent mortality risk. J Am Soc Nephrol. 2016;27(8):2456–2466.
- 64. Adrogué HJ, Madias NE. Hyponatremia. N Engl J Med. 2000;342(21):1581–1589.
- 65. Jha V, Garcia-Garcia G, Iseki K, et al. Chronic kidney disease: global dimension and perspectives. Lancet. 2013;382(9888):260–272.
- 66. Mills KT, Xu Y, Zhang W, et al. A systematic analysis of worldwide population-based data on the global burden of chronic kidney disease in 2010. Kidney Int. 2015;88(5):950–957.
- 67. Hunsicker LG. The consequences and costs of chronic kidney disease before ESRD. J Am Soc Nephrol. 2004;15(5):1363–1364.
- 68. Smith DH, Gullion CM, Nichols G, Keith DS, Brown JB. Cost of medical care for chronic kidney disease and comorbidity among enrollees in a large HMO population. J Am Soc Nephrol. 2004;15(5):1300–1306.
- 69. Torres VE. Vasopressin in chronic kidney disease: an elephant in the room? Kidney Int. 2009;76(9):925–928.
- 70. Perico N, Zoja C, Corna D, et al. V1/V2 vasopressin receptor antagonism potentiates the renoprotection of renin-angiotensin system inhibition in rats with renal mass reduction. Kidney Int. 2009;76:960–967.
- 71. Bouby N, Bachmann S, Bichet D, Bankir L. Effect of water intake on the progression of chronic renal failure in the 5/6 nephrectomized rat. Am J Physiol. 1990;258(4, pt 2):F973–f979.
- 72. Sugiura T, Yamauchi A, Kitamura H, et al. High water intake ameliorates tubulointerstitial injury in rats with subtotal nephrectomy: possible role of TGF-β. Kidney Int. 1999;55(5):1800–1810.
- 73. Meijer E, Boertien WE, Zietse R, Gansevoort RT. Potential deleterious effects of vasopressin in chronic kidney disease and particularly autosomal dominant polycystic kidney disease. Kidney Blood Press Res. 2011;34(4):235–244.
- 74. Bouby N, Fernandes S. Mild dehydration, vasopressin and the kidney: animal and human studies. Eur J Clin Nutr. 2003;57(Suppl 2):S39–S46.
- 75. Torres VE, Chapman AB, Devuyst O, et al. Tolvaptan in patients with autosomal dominant polycystic kidney disease. N Engl J Med. 2012;367(25):2407–2418.
- 76. Boertien WE, Meijer E, Zittema D, et al. Copeptin, a surrogate marker for vasopressin, is associated with kidney function decline in subjects with autosomal dominant polycystic kidney disease. Nephrol Dial Transplant. 2012;27(11):4131–4137.
- 77. Keller T, Tzikas S, Zeller T, et al. Copeptin improves early diagnosis of acute myocardial infarction. J Am Coll Cardiol. 2010;55(19):2096–2106.
- 78. Khan SQ, Dhillon OS, O’Brien RJ, et al. C-terminal provasopressin (Copeptin) as a novel and prognostic marker in acute myocardial infarction. Circulation. 2007;115(16):2103–2110.