Individuals infected with Mycobacterium tuberculosis are at highest risk of developing tuberculosis (TB) disease in the initial years following infection []. Infected individuals who do not progress to TB disease are classified as having latent TB infection (LTBI), and remain at risk of developing TB disease over the rest of their lifetime. Although evidence suggests that incidence rates continue to decline with time since infection [], there is uncertainty about how rates of LTBI reactivation change for individuals with remote infection. Although individuals infected many years ago face lower risks compared to recently infected individuals, progression of old infections can be important in low-incidence settings, if there are many individuals with remote infection and relatively few with recent infection. This is the situation in the United States, where most TB is attributed to historical infections [, ].
Even though most TB cases in the United States occur among non-US–born persons [], older individuals account for a disproportionate share of TB incidence and TB-related mortality regardless of nativity []. LTBI prevalence is highest in the older population [], reflecting greater lifetime exposure to infection. Moreover, TB incidence has been shown to increase with age [].
Previous analyses of TB among other US populations have decomposed incidence rates to identify underlying mechanisms and risk differences [, ], and these types of studies can help target prevention interventions. In this study we analyzed TB cases arising during 2001–2019 among US-born persons aged 50 and over in the United States, to describe age trends in TB risk within birth cohorts, as well as risk differences across successive birth cohorts and between sex and race/ethnicity strata.
METHODS
TB Case Data
We obtained National TB Surveillance System (NTSS) [] data for TB cases reported during 2001–2019 in the 50 US states and District of Columbia and extracted year of report, national origin (US-born or non-US–born, following US Census definitions), age, sex, and race/ethnicity. We also extracted a Centers for Disease Control and Prevention (CDC)-estimated indicator, available since 2011, of whether a case was attributed to recent transmission (RT), derived from analyses of genotypic data and spatiotemporal clustering []. We retained data on US-born individuals aged 50–90, comprising 59 birth-year cohorts (1911–1969). We excluded individuals with multiple/unknown race/ethnicity or unknown sex (0.6%).
Population Estimates
We obtained population data from the American Community Survey []. We extracted variables for year, age, sex, race/ethnicity, and survey weight, and fitted generalized additive regression models (GAMs) to create smoothed population estimates for individual analytic strata [, ].
Outcome of Interest and Analysis Strata
The primary outcome was the annual percentage change in TB incidence rates (TB cases per 100 000) within individual birth cohorts, and how this value varied as a function of age, sex, and race/ethnicity. Additional outcomes included differences in TB incidence rates between birth cohorts, stratified by sex and race/ethnicity, and racial/ethnic differences in TB incidence rates controlling for age and birth cohort.
Statistical Analysis
We constructed GAM regression models to estimate TB incidence rates as a function of birth cohort and age. In sensitivity analyses we tested more flexible models that allowed for period effects in addition to age and cohort effects. We assumed quasi-Poisson distributed errors to allow for overdispersion. We modeled differences between birth cohorts using Gaussian processes, allowing for flexible nonparametric trends across cohorts, and with flexibility chosen using 10-fold cross-validation. We specified linear and quadratic terms for age, allowing for linear changes in the annual percentage change within each birth cohort. We fit this regression model to (a) all data (ie, all sex and race/ethnicity categories combined) and (b) each sex-race/ethnicity stratum separately (12 separate regression models). From each model we extracted incidence rate estimates by age and cohort, and estimated the annual percentage change for each additional year of age. We estimated equal-tailed 95% confidence intervals by simulating from the uncertainty distributions of the model coefficients. Analyses were performed in R v.3.6.2 [] using the “mgcv” library v.1.8–33 [].
Analyses of Recent Transmission Data
Since 2011, the NTSS has included an estimate of whether each TB case is attributable to recent transmission (RT). This indicator categorizes each genotyped case according to the presence or absence of a plausible source case within the last 2 years, based on data included in the NTSS and the Tuberculosis Genotyping Information Management System []. Cases were identified as a plausible source case if they had the same Mycobacterium tuberculosis genotype (via spoligotype and 24-locus MIRU-VNTR), an infectious form of TB disease, residential location within 10 miles of the given case, age >10 years, and diagnosis date <2 years before the given case [, ]. We fit separate regression models for each RT category. The RT variable can only be calculated for culture-positive TB cases where the TB isolate has been genotyped and for this reason is missing for many cases (24% since 2011). To account for these missing values, we calculated the non-missing fraction of each analytic stratum (by age and cohort) and multiplied the population denominator of each stratum by these values. This adjusted denominator was used for analyses of both recent and remote infection. This approach assumes RT missingness is unrelated to the RT outcome, conditional on observed covariates. We tested alternative assumptions in sensitivity analyses.
Sensitivity Analyses
We tested the impact of alternative regression specifications. In the first specification, we replaced the Gaussian process with random effects for each birth cohort, while retaining the linear and quadratic terms for age. In the second specification, we replaced the linear and quadratic age terms with a Gaussian process, allowing for flexible age trends. In the third specification, we specified a 2-dimensional Gaussian process for age and cohort. In the fourth specification, we added calendar year random effects. The third and fourth specifications relaxed the assumption of additive effects for birth year and age, allowing for period effects.
We also tested alternative assumptions about missing RT values. Because a missing RT value may be more likely with recent transmission (due to the possibility of lower culture positivity in TB cases identified through contact investigation), we imputed missing RT values with an odds ratio for recent infection that varied between 1 and 10, where this ratio defined the odds of recent infection in missing data relative to observed data, by age and cohort. We then recalculated results under these alternative assumptions.
RESULTS
From 2001 to 2019, 42 000 TB cases were reported among US-born individuals aged 50–90 years, of which 41 874 cases (99.7%) had complete demographic data and were included in the analysis. Table 1 summarizes TB and population data for major population subgroups. Among the 10 470 cases with available RT data, 8326 (80%) were attributed to remote infection, whereas 2144 (20%) were attributed to recent infection.
Incidence rate trends
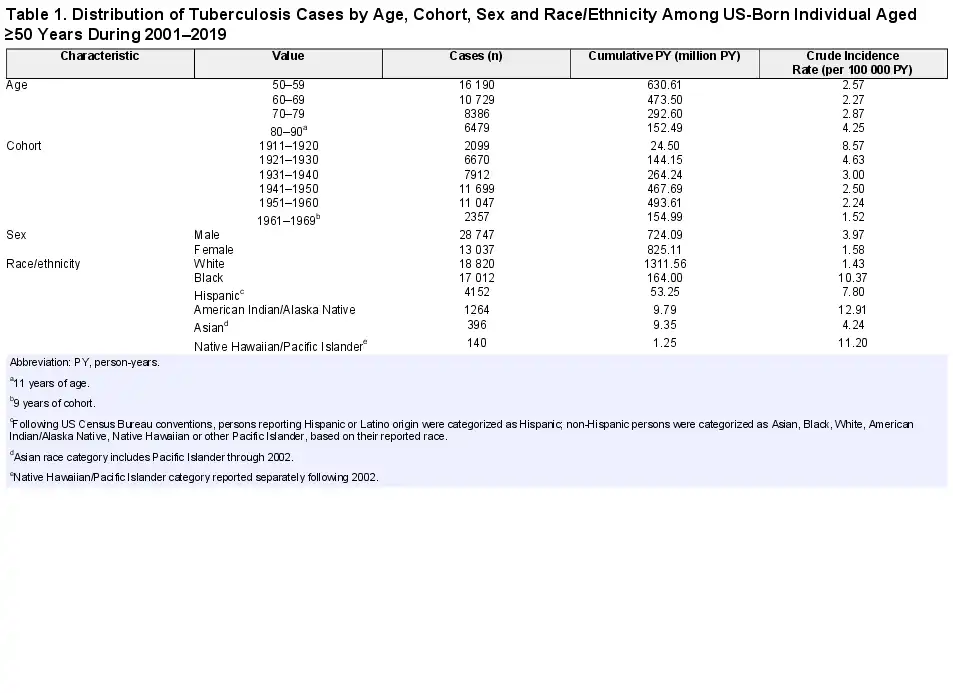
Figure 1A shows unadjusted TB incidence rates pooled into 5-year birth cohorts during 2001–2019. Figure 1B shows model-estimated incidence rate trends over the same period, stratified by birth cohort (1911 to 1969). After regression adjustment, TB incidence rates are shown to decline as a function of age, and earlier birth cohorts have higher rates than later birth cohorts, controlling for age.
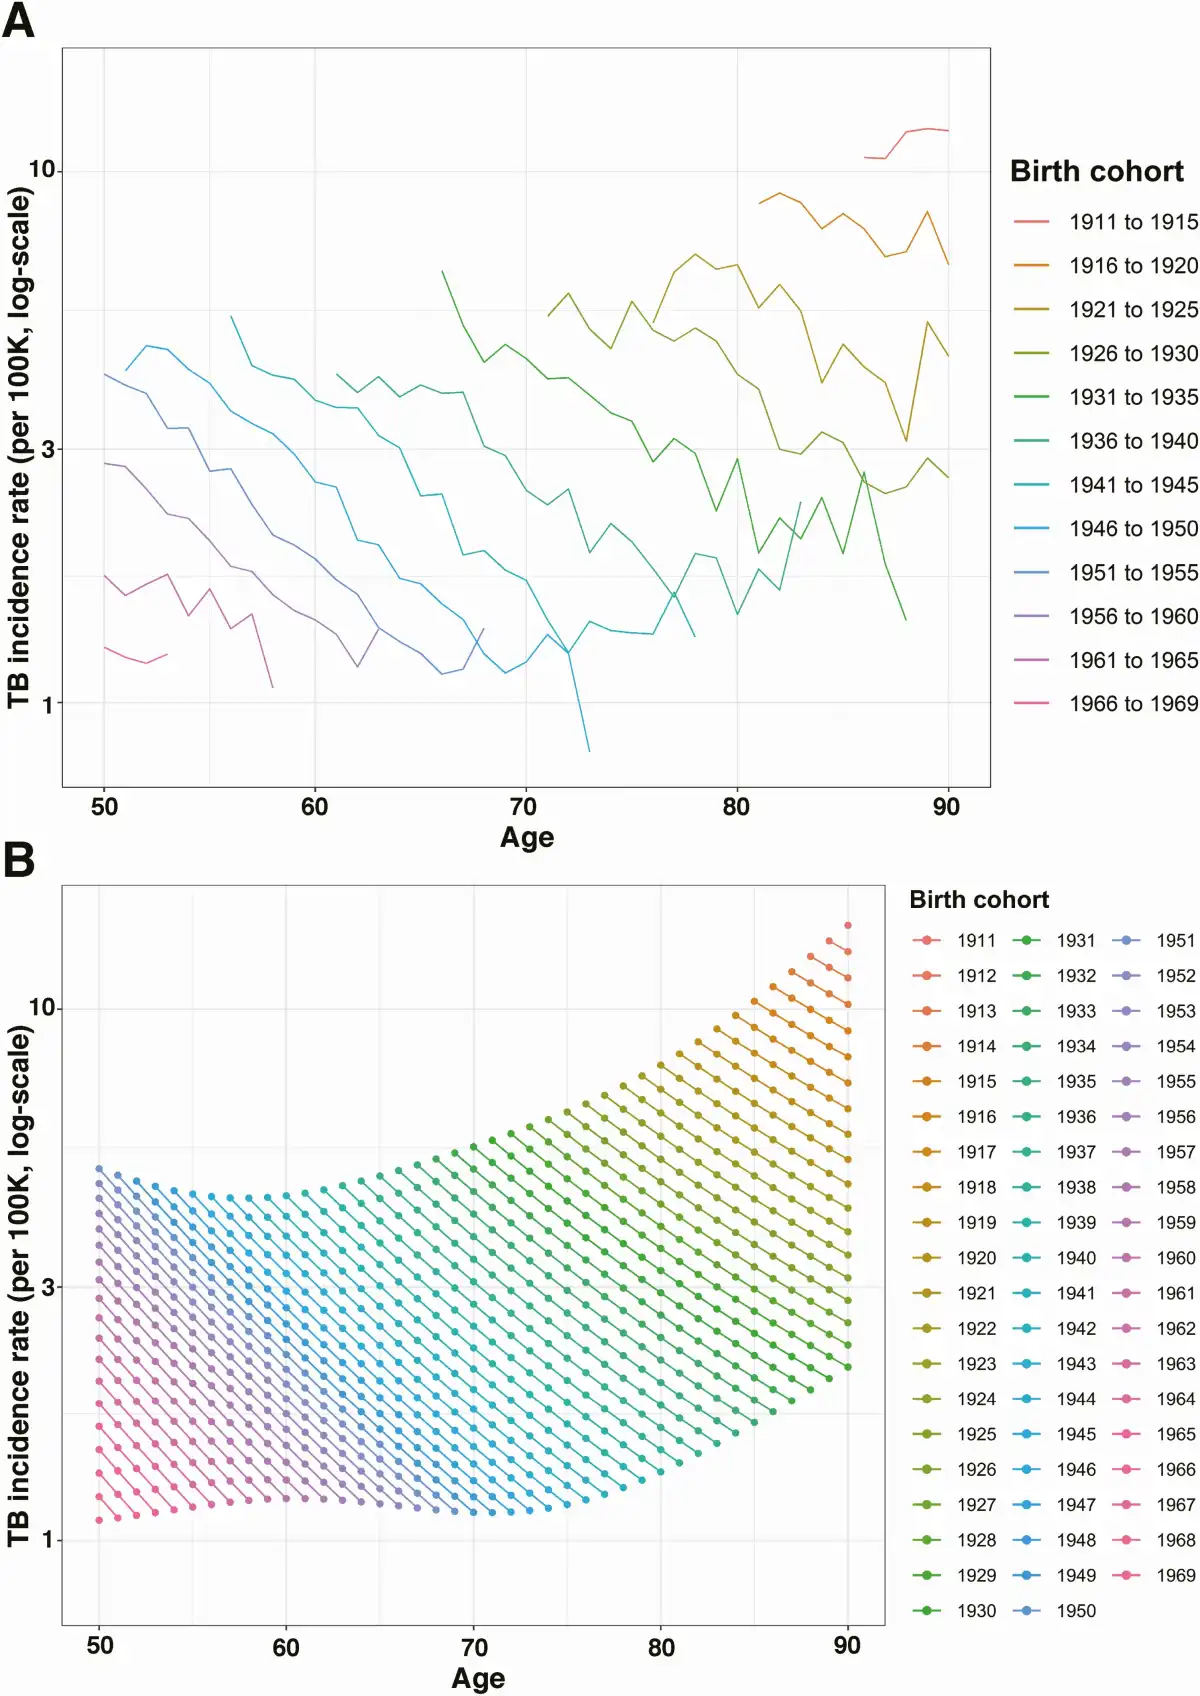
Figure 1
Raw and estimated TB incidence rate among US-born individuals aged ≥50 years during 2001–2019. A, Raw TB incidence rate of 5-year birth cohorts. B, Estimated TB incidence rate as a function of age. Abbreviation: TB, tuberculosis.
Change in TB Incidence Rates Within Birth Cohorts
Based on the main regression analysis, we estimated declining incidence rates within each birth cohort, across the whole age range (50–90 years of age) included in the analysis. Figure 2A shows the annual percentage decline in incidence rates by age, for the overall cohort during 2001–2019. The annual decline in incidence rates was 8.80% (8.34–9.23) for 51-year-olds and dropped to 4.51% (3.87–5.14) for 90-year-olds.
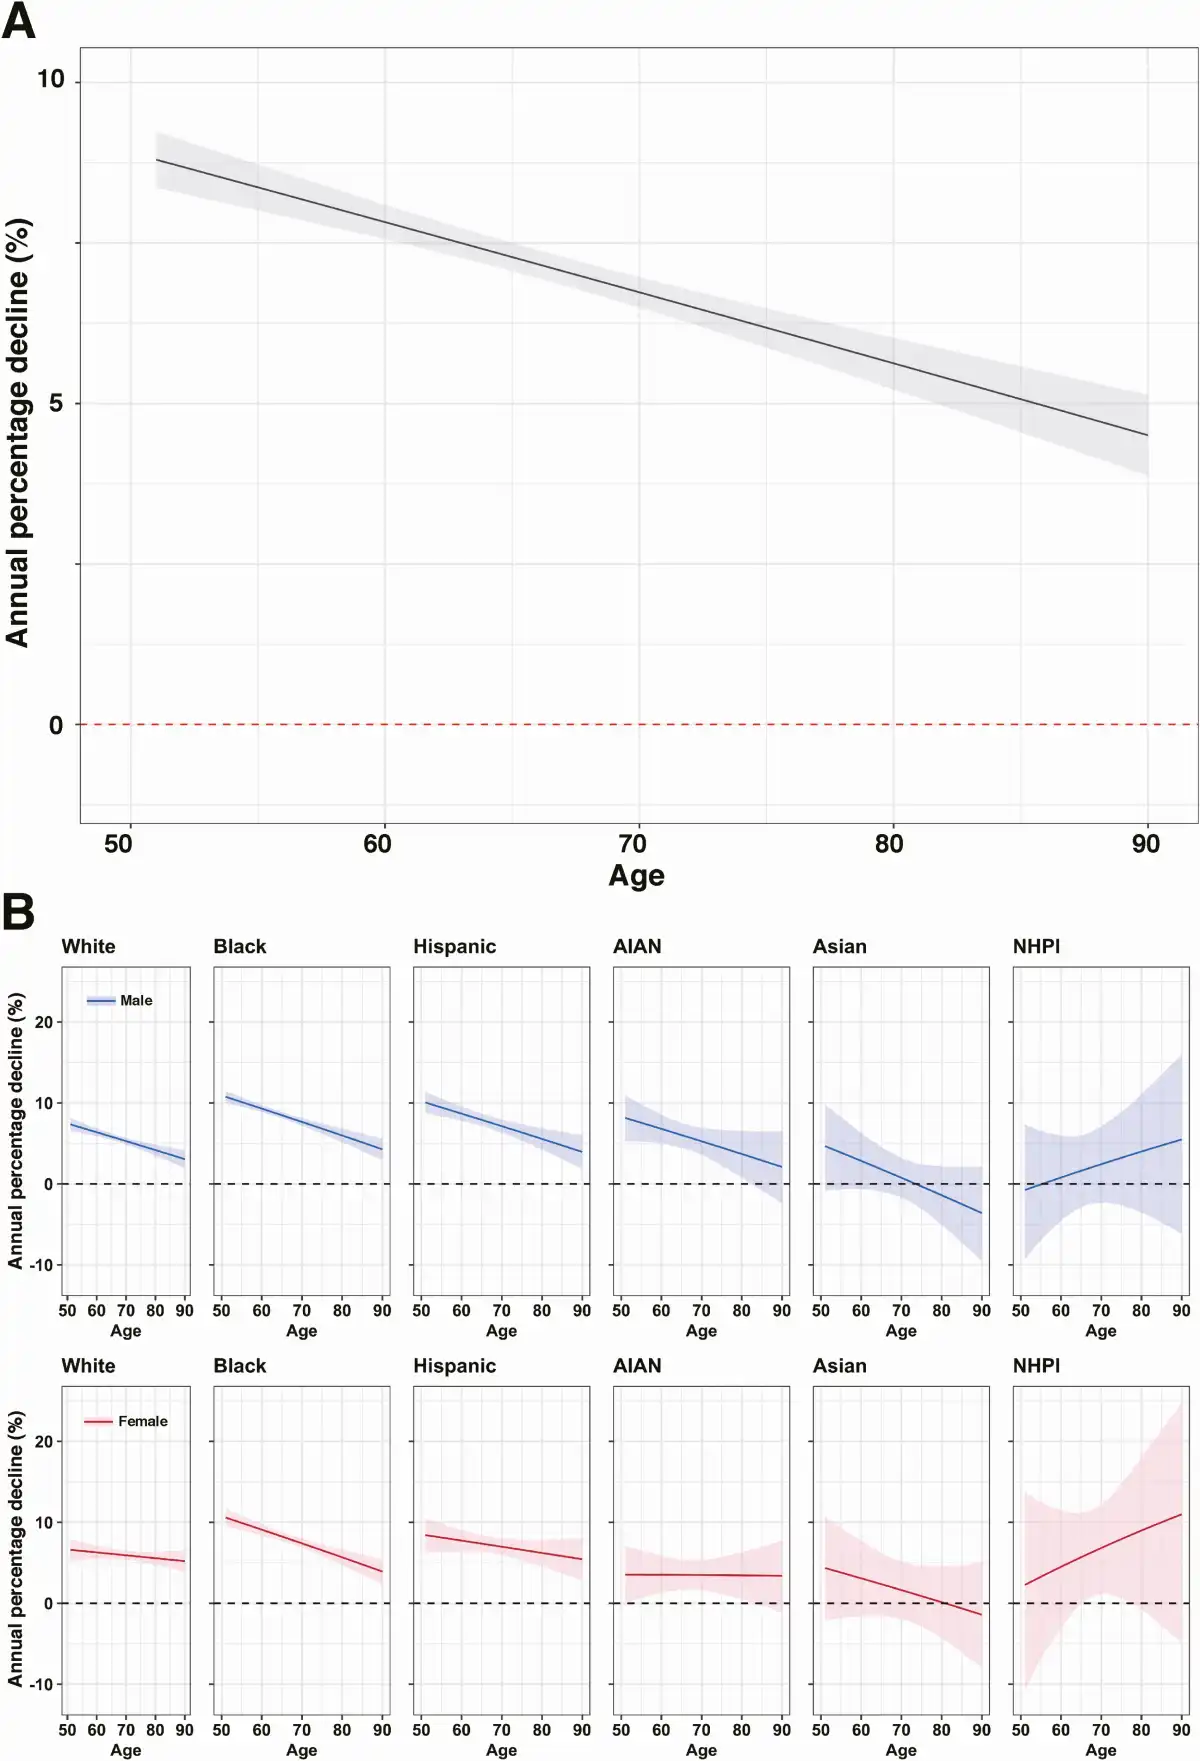
Figure 2
Annual percentage decline in TB incidence1 in the overall cohort and in each sex and race/ethnicity group. A, Annual percentage decline (%) in TB incidence by age in the overall cohort. B, Annual percentage decline (%) in each sex and race/ethnicity group.2 Panels were arranged in decreasing order of TB case counts (left to right). Solid line indicates point estimates and shaded region indicates 95% confidence intervals. Rates are based on the incidence observed among US-born individuals aged 50 and over during 2001–2019. Abbreviation: AIAN, American Indian/Alaska Native; NHPI, Native Hawaiian/Pacific Islander; TB, tuberculosis.
1Analytic model assumes the annual percentage decline is the same for each birth cohort. This assumption is relaxed in the sensitivity analyses.
2 Following US Census Bureau conventions, persons reporting Hispanic or Latino origin were categorized as Hispanic; non-Hispanic persons were categorized as Asian, Black, White, American Indian/Alaska Native, Native Hawaiian or other Pacific Islander, based on their reported race.
Change in TB Incidence Rates Within Birth Cohorts, by Race/Ethnicity and Sex
Figure 2B shows age trends in TB incidence rates, stratified by race/ethnicity and sex. Trends in individual strata were generally consistent with results estimated in the overall cohort, with declining incidence rates across all ages, and lower annual percentage declines at older age. For Asian men and women, estimated annual percentage changes were close to zero. For Native Hawaiian/Pacific Islander men and women, the annual percentage decline accelerated with age; however, this result was not statistically significant. Results for both of these populations were relatively imprecise due to a lower total number of cases. For 5 out of 6 race/ethnicity groups, the estimated annual percentage decline with age was greater in males than in females (not statistically significant). Supplementary Tables 1 and 2 report the estimated annual percentage declines for each decade of age in each race/ethnicity-sex group.
Figure 3 describes the results of analyses of TB case data decomposed into TB from recent and remote infection, for the period 2011–2019. For both outcomes, incidence rates declined as a function of age within individual birth cohorts, and earlier birth cohorts had higher incidence rates compared to later birth cohorts for a given age. However, for a given calendar year, “the” incidence rate attributed to recent infection was higher in younger individuals compared to the older individuals, although the rate from remote infection was higher among older individuals. For TB attributed to remote infection, the annual percentage decline in “the” incidence rate was 6.62% (5.14–8.08) for 51-year-olds and dropped to 1.13% (−0.91 to 3.14) for 90-year-olds. For TB attributed to recent infection, the annual percentage decline in the incidence rate was relatively stable with increasing age, ranging from 9.55% (7.00–12.14) in 51-year-olds to 10.73% (4.66–16.53) in 90-year-olds.
Figure 3
Estimated TB incidence rate and the annual percentage decline in TB incidence attributed to remote infection and recent infection. A, Estimated TB incidence rate in TB attributed to remote infection. B, Estimated TB incidence rate in TB attributed to recent infection. C, The annual percentage decline in TB attributed to remote infection. D, The annual percentage decline in TB attributed to recent infection. Solid line indicates point estimates and shaded region indicates 95% confidence intervals. The rates are based on the incidence observed among US-born individuals aged 50 and over during 2011–2019. Abbreviation: TB, tuberculosis.
Change in TB Incidence Rate Between Birth Cohorts
Figure 4A compares incidence rate estimates for individuals of the same age from successive birth cohorts. Across all age groups, each successive birth cohort experienced lower incidence rates than previous cohorts, with each successive cohort associated with an average 8.79% (6.13–11.26) decline in TB incidence rate relative to the preceding cohort. This annual percentage decline was consistent across the birth cohorts in the study, with average annual declines of 10.27% (9.49–11.03), 8.95% (8.54–9.38), and 8.08% (7.54–8.63), estimated across the 1920, 1940, and 1960 birth cohorts, respectively.
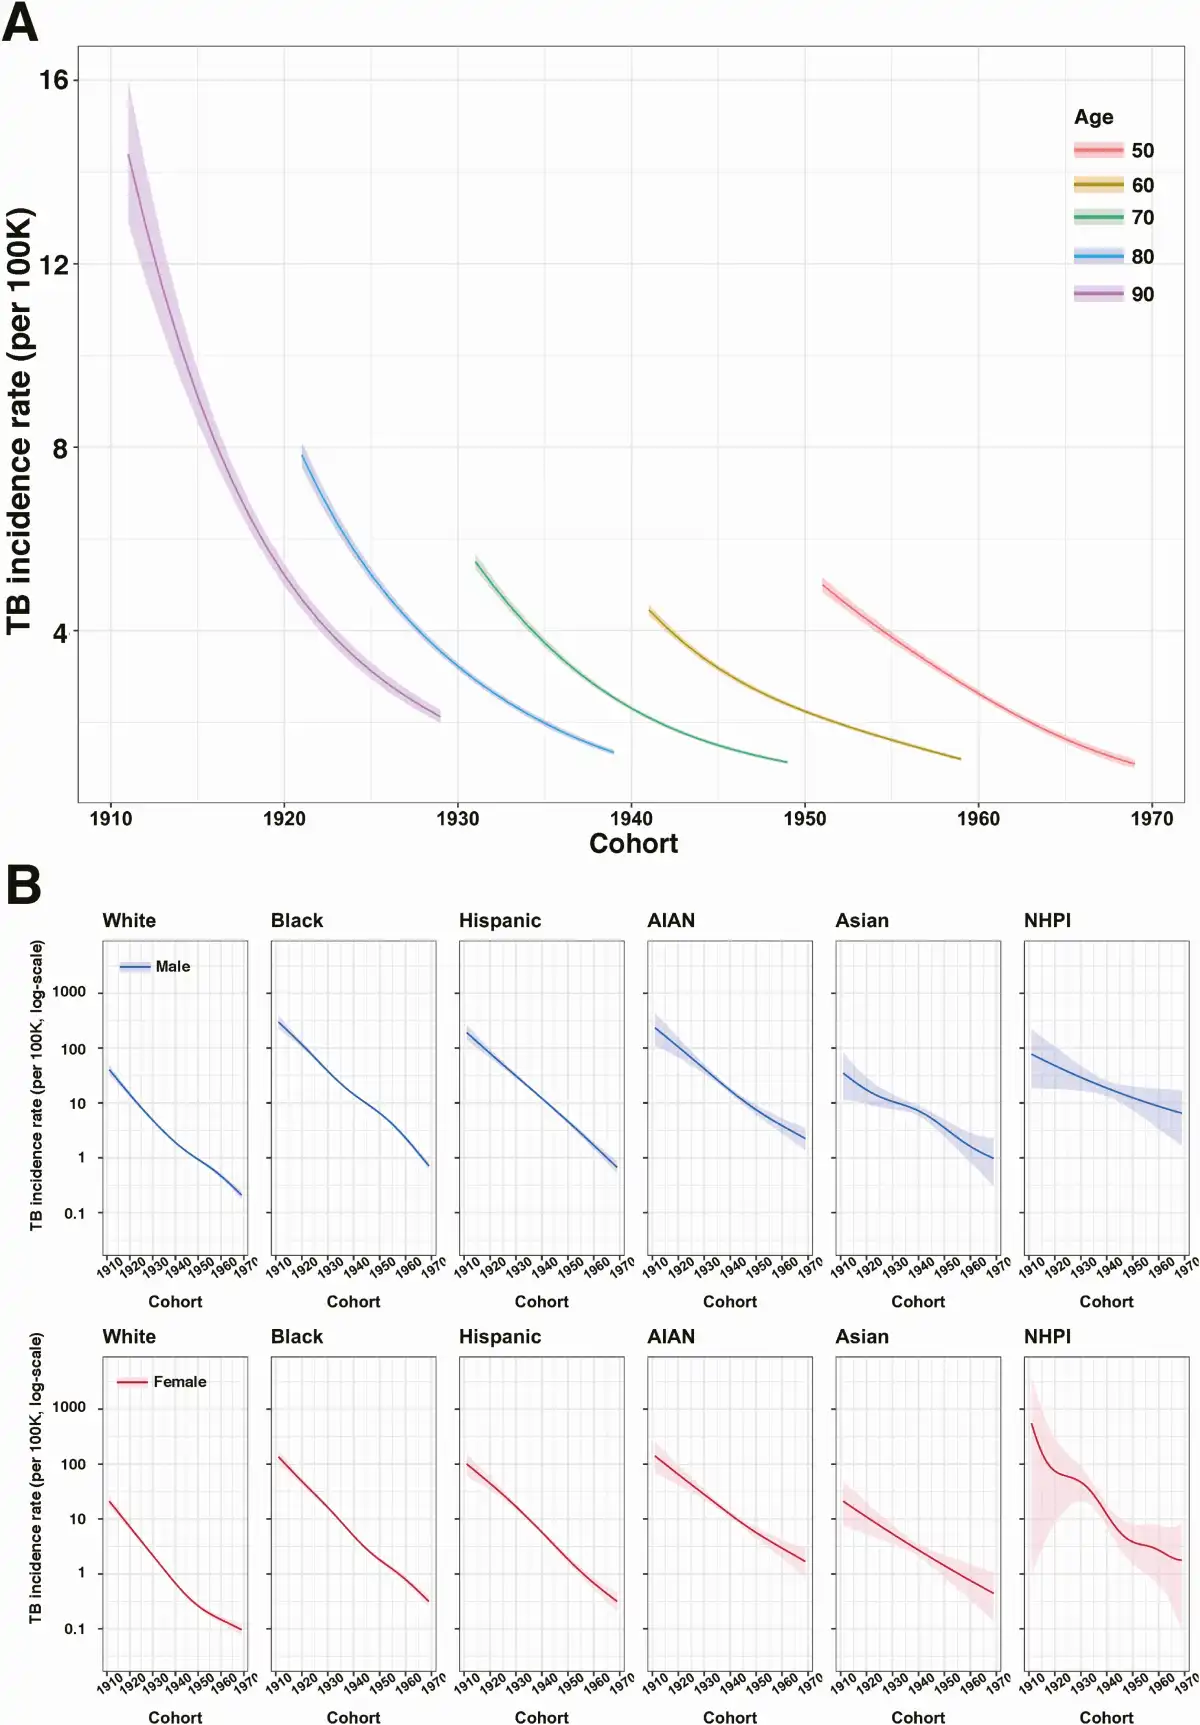
Figure 4
Estimated TB incidence rate as a function of birth cohort for the combined cohort and in each sex and race/ethnicity group. A, Estimated TB incidence rate as a function of cohort in the overall cohort. B, TB incidence rate as a function of cohort in each sex and race/ethnicity group,1 controlling for age (assuming the age of 70). Solid line indicates point estimates and shaded region indicates 95% confidence intervals. Abbreviations: AIAN, American Indian/Alaska Native; NHPI, Native Hawaiian/Pacific Islander; TB, tuberculosis.
1Following US Census Bureau conventions, persons reporting Hispanic or Latino origin were categorized as Hispanic; non-Hispanic persons were categorized as Asian, Black, White, American Indian/Alaska Native, Native Hawaiian or other Pacific Islander, based on their reported race.
Change in TB Incidence Rate Between Birth Cohorts, by Race/Ethnicity and Sex
Figure 4B shows estimated changes in TB incidence rate between successive birth cohorts, stratified by sex and race/ethnicity, and controlling for age (assuming the age of 70 years). For all race/ethnicity-sex groups, estimated incidence rates declined for more recent birth cohorts. Average annual percentage declines were: 8.54% (8.08–9.01) in White males and 8.74% (8.16–9.31) in White females; 9.73% (9.17–10.26) in Black males and 9.78% (9.14–10.42) in Black females; 10.59% (9.49–11.69) in Hispanic males and 9.70% (8.57–10.84) in Hispanic females; 7.54% (6.04–8.98) in American Indian/Alaska Native males and 7.22% (5.57–8.84) in American Indian/Alaska Native females; 5.89% (3.48–8.38) in Asian males and 6.37% (3.36–9.29) in Asian females; and 4.07% (0.20–7.84) in Native Hawaiian/Pacific Islander males and 6.70% (−1.45 to 14.30) in Native Hawaiian/Pacific Islander females. Figure 5 reports estimated incidence rate ratios (IRR) between each race/ethnicity group compared to White individuals of the same birth cohort and sex (additional results in Supplementary Tables 3 and 4).
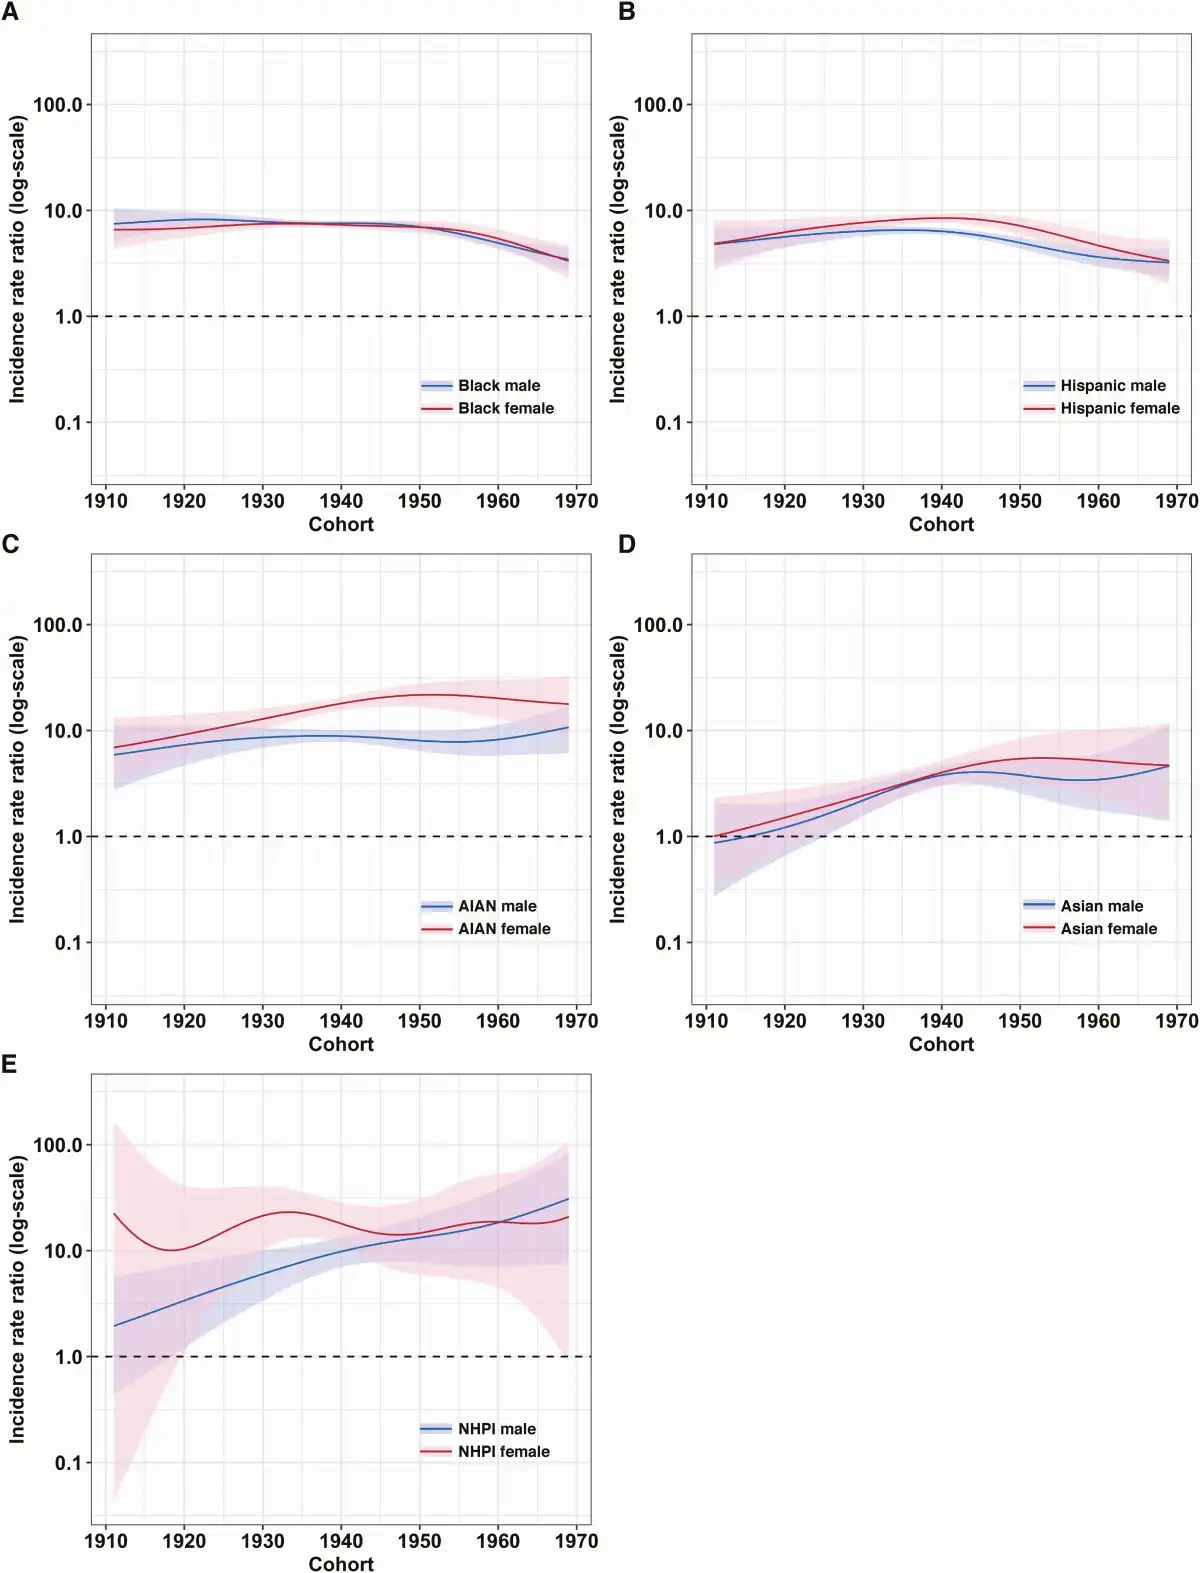
Figure 5
Estimated incidence rate ratio of each sex and race/ethnicity group to Whites. Panels A–E representing differences in TB burden between each race/ethnicity-sex group1 relative to Whites. Solid line indicates point estimates and shaded region indicates 95% confidence intervals. Supplementary Tables 3 and 4 report the point estimates for each decade of cohort in each group. Abbreviations: AIAN, American Indian/Alaska Native; NHPI, Native Hawaiian/Pacific Islander; TB, tuberculosis.
1 Following US Census Bureau conventions, persons reporting Hispanic or Latino origin were categorized as Hispanic; non-Hispanic persons were categorized as Asian, Black, White, American Indian/Alaska Native, Native Hawaiian, or other Pacific Islander, based on their reported race.
Sensitivity Analyses
Results of the sensitivity analyses were similar to those of the main analyses. Supplementary Figure 1 in the appendix shows the result of the first alternative specification (cohort random effects). Based on the second specification (Gaussian process smooth for age, Supplementary Figure 2), the annual percentage decline appeared to be slightly concave compared to its linear downward slope in the main model (Figure 2A), increasing from 5.38% at age 51 to peak at 8.81% at age 58 then decreased to 0.53% by age 90. Results of the third specification (two-dimensional Gaussian process for age and cohort) appeared to be similar to that of the second specification, indicating that adding additional flexibility does not change the outcome substantially (Supplementary Figure 3). Results of the fourth specification (calendar year random effects) appeared to be similar to the main analysis (Supplementary Figure 4). Supplementary Figure 5 shows the annual percentage decline in TB from recent and remote infection after imputing missing values in RT status under different assumptions about the likelihood of recent transmission for these missing data. These alternative assumptions produce small changes in the estimates of annual percent change in TB incidence.
Discussion
In the United States, older individuals face higher risks of developing TB compared to younger individuals []. Our analyses show that although TB incidence rates in the population over 50 years of age are high, they are declining rapidly within each birth cohort, and that this trend is consistent across most sex and race/ethnicity strata. As a consequence, the average 50-year-old in 2001 could expect their annual TB risk to decline by 77% by the time that person turned 68 in 2019. Although we found strong evidence that the annual percentage decline was shallower for older individuals, annual reductions in TB risk were still over 4% in the oldest age group in our sample.
The analyses also revealed lower incidence rates for each successive birth cohort compared to previous cohorts, for each year of age, consistent with previous studies [, ]. Furthermore, these trends were consistent across sex and race/ethnicity strata and suggest an average 8% annual reduction in TB risk for each successive birth cohort. Although trends between and within birth cohorts were similar across strata, the absolute level of TB incidence rates varied widely. We identified substantial racial/ethnic differences in estimated incidence rates, with minority racial/ethnic groups having TB incidence rates 0.9 to 30.9 times those of White individuals when controlling for age, sex, and birth year (Supplementary Tables 3 and 4). Notwithstanding modest reductions in incidence rate ratios for Black and Hispanic individuals in more recent birth cohorts, these findings suggest racial/ethnic disparities in TB incidence rates in older US-born populations have not meaningfully diminished over time, and may be widening for some minority populations (American Indian/Alaska Native, Native Hawaiian/Pacific Islander), consistent with earlier analyses describing differential TB trends by race/ethnicity in the overall population [].
In analyses that decomposed TB incidence rates into cases from recent versus remote infection, we estimated declining trends by age for both these causes, mirroring trends in the main analysis. However, TB rates from recent transmission declined more rapidly with age, particularly for older individuals, potentially reflecting reductions in exposure to infection with age []. For TB from both recent and remote infection we observed lower TB incidence rates for more recent birth cohorts, controlling for age. For TB from recent infection, these cohort effects were smaller than the age effects, such that in a given calendar year incidence rate attributed to recent infection was higher in younger individuals. The opposite was true for TB from remote infection, such that in a given calendar year incidence rate attributed to remote infection was higher in older individuals.
We found ongoing declines in TB progression risk many years after infection. This is consistent with the hypothesis of progressive clearance of M. tuberculosis infection over time, or ongoing reductions in progression risk for individuals with viable infection [, ]. This is an area for which there is little published empirical evidence. Although emerging evidence supports the idea of ongoing declines in LTBI progression risk many years after infection [, ], many modeled policy analyses assume constant progression rates among individuals with remote infection []. We also found that the annual percentage decline in TB incidence rates slowed at older ages, consistent with the possibility of greater susceptibility to LTBI progression as older individuals age. There are several possible mechanisms to explain this, including age-based weakening in immune function, the accumulation of known risk factors (eg, diabetes) with age [], and subtle changes in the distribution of time since infection.
There are several limitations to this study. First, we assumed complete case detection and reporting. Although case detection in the United States is strong [], it is possible a small fraction of incident cases are not diagnosed, and this fraction could be higher in marginalized populations. Second, these analyses assume that US-born residents in the United States can be treated as a closed cohort and ignore the potential emigration and re-entry of US-born individuals. Third, selective mortality (ie, nonindependence of TB risk and mortality rates) could induce survivorship bias. For example, individuals with diabetes experience elevated risks of both mortality and LTBI progression, so the analysis of a cohort combining diabetic and nondiabetic individuals could induce bias. Although mortality rates for younger individuals in our sample are low enough that they are unlikely to impact our results, this is a plausible bias for older age groups. If there were a survivorship bias, we expect that the effect would be to increase the annual percentage decline in TB rates, particularly in older age groups.
The trends estimated in this analysis, with incidence rates within cohorts falling as individuals age and lower for more recent birth cohorts, reflect the broad patterns of TB epidemiology in a declining epidemic, produced by progressive improvements in TB control and lower infectious exposure for more recent birth cohorts []. Our findings have important implications for TB prevention services for older adults in the United States and other low-incidence settings. First, TB cases are increasingly attributable to progression of established LTBI as individuals age. Second, although there is some evidence of increasing susceptibility to progression at older ages, we did not see increasing incidence rates within individual cohorts. Finally, the large disparities in TB incidence rates by race/ethnicity point to a long historical period of elevated TB exposure for racial/ethnic minorities across all birth cohorts in the sample, as well as a higher prevalence of comorbid conditions that predispose to LTBI progression. Ensuring that TB prevention services are designed to meet the needs of vulnerable and high-risk populations will likely increase the impact of prevention services and ameliorate the health impact of the disparities estimated in this analysis.
Notes
Acknowledgments. The authors thank Drs Maryam Haddad and Cindy Imai for their valuable comments to the manuscript.
Disclaimer. The findings of this study are those of the authors and do not represent the views of the U.S. Centers for Disease Control and Prevention or other institutions.
Financial support. This work was supported by the US Centers for Disease Control and Prevention, National Center for HIV/AIDS, Viral Hepatitis, STD, and TB Prevention Epidemiologic and Economic Modeling Agreement (NEEMA, grant number #1NU38PS004651).
Potential conflicts of interest. T. C. reports grants or contracts from the National Institutes of Health (NIH), Gates Foundation, and USAID paid to their institution and support for attending meetings and/or travel from the Gates Foundation paid to their institution. J. W. M. reports support for the study from the NIH/NIAID (National Institute of Allergy and Infectious Diseases ) (grant number 5R01AI146555-02 “Optimal targeting for individual and population-level TB prevention”). All other authors report no potential conflicts.
All authors have submitted the ICMJE Form for Disclosure of Potential Conflicts of Interest. Conflicts that the editors consider relevant to the content of the manuscript have been disclosed.
References
- 1. Ferebee SH. Controlled chemoprophylaxis trials in tuberculosis: a general review. Bibl Tuberc1970; 26:28–106.
- 2. Menzies NA, Swartwood N, Testa C, et al Time since infection and risks of future disease for individuals with Mycobacterium tuberculosis infection in the United States. Epidemiology2021; 32:70–8.
- 3. Emery JC, Richards AS, Dale KD, et al Self-clearance of Mycobacterium tuberculosis infection: implications for lifetime risk and population at-risk of tuberculosis disease. Proc Biol Sci2021; 288:20201635.
- 4.
- 5.
- 6.
- 7. Pratt RH, Winston CA, Kammerer JS, Armstrong LR. Tuberculosis in older adults in the United States, 1993–2008. J Am Geriatr Soc2011; 59:851–7.
- 8. Miramontes R, Hill AN, Woodruff RSY, et al Tuberculosis infection in the United States: prevalence estimates from the national health and nutrition examination survey, 2011–2012. PLOS ONE2015; 10:e0140881.
- 9. Hochberg NS, Horsburgh CR Jr. Prevention of tuberculosis in older adults in the United States: obstacles and opportunities. Clin Infect Dis2013; 56:1240–7.
- 10. Hill AN, Cohen T, Salomon JA, Menzies NA. High-resolution estimates of tuberculosis incidence among non-U.S.-born persons residing in the United States, 2000–2016. Epidemics2020; 33:100419.
- 11. Iqbal SA, Winston CA, Bardenheier BH, Armstrong LR, Navin TR. Age-period-cohort analyses of tuberculosis incidence rates by nativity, United States, 1996–2016. Am J Public Health2018; 108:S315–20.
- 12. France AM, Grant J, Kammerer JS, Navin TR. A field-validated approach using surveillance and genotyping data to estimate tuberculosis attributable to recent transmission in the United States. Am J Epidemiol2015; 182:799–807.
- 13. Ruggles S, Flood S, Goeken R, et al IPUMS USA. 2020. doi:10.18128/D010.V10.0.
- 14. Hastie TJ, Tibshirani RJ. Generalized additive models. 1st ed. Boca Raton: CRC Press, 1990. doi:10.1201/9780203753781.
- 15. Wood SN. Thin plate regression splines. J R Stat Soc Ser B2003; 65:95–114.
- 16.
- 17. Wood SN. Generalized additive models: an introduction with R. 2nd ed. Boca Raton: CRC Press/Taylor & Francis Group, 2017.
- 18. Ghosh S, Moonan PK, Cowan L, Grant J, Kammerer S, Navin TR. Tuberculosis genotyping information management system: enhancing tuberculosis surveillance in the United States. Infect Genet Evol2012; 12:782–8.
- 19. Winston CA, Navin TR. Birth cohort effect on latent tuberculosis infection prevalence, United States. BMC Infect Dis2010; 10:206.
- 20. Khan A, Marks S, Katz D, et al Changes in tuberculosis disparities at a time of decreasing tuberculosis incidence in the United States, 1994–2016. Am J Public Health2018; 108:S321–6.
- 21. Mossong J, Hens N, Jit M, et al Social contacts and mixing patterns relevant to the spread of infectious diseases. PLoS Med2008; 5:e74.
- 22. Horsburgh CR Jr. Priorities for the treatment of latent tuberculosis infection in the United States. N Engl J Med2004; 350:2060–7.
- 23. Behr MA, Edelstein PH, Ramakrishnan L. Is Mycobacterium tuberculosis infection life long?BMJ2019; 367:l5770.
- 24.
- 25. Menzies NA, Wolf E, Connors D, et al Progression from latent infection to active disease in dynamic tuberculosis transmission models: a systematic review of the validity of modelling assumptions. Lancet Infect Dis2018; 18:e228–38.
- 26. Woodruff RSY, Pratt RH, Armstrong LR. The US National Tuberculosis surveillance system: a descriptive assessment of the completeness and consistency of data reported from 2008 to 2012. JMIR Public Health and Surveill2015; 1:e4991.
- 27. Comstock GW. Frost revisited: the modern epidemiology of tuberculosis: the third Wade Hampton Frost Lecture. Am J Epidemiol2008; 168:692–711.