Introduction
The immunosuppressive receptor programmed cell death protein 1 (PD-1) is one of the so-called immune checkpoint (IC) molecules and is a master regulator of immune homeostasis. Recently, it has been clarified that the majority of tumors escape from immune surveillance by utilizing the interaction between PD-1 on T cells and one of its ligands (PD-L1) in the tumor microenvironment (TME). Compared with conventional treatment, such as surgery, chemotherapy and radiation therapy, PD-1 blockade-based cancer immunotherapy has led to a paradigm shift in cancer treatment owing to improved survival, fewer side effects and applicability to a wide range of tumors (). However, three main problems remain to be solved: (i) a substantial number of patients show unresponsiveness to PD-1 blockade therapy; (ii) precise predictive biomarkers have not been identified to discriminate responders and non-responders; and (iii) the best combination therapy is not yet known. To address these issues, it is important to understand the complexity of mechanisms that cause unresponsiveness, which include immune escape systems other than the PD-1–PD-L1 interaction.
The TME consists of heterogeneous cell populations and various cell-derived factors. Tumor cells escape immune attack by utilizing a broad range of suppressive factors that are directly derived from the tumor and/or bystander tumor-related factors (Fig. 1). Direct tumor factors that inhibit T-cell activity include (i) negative IC-associated molecules, such as PD-L1, Galectin 9, CD112, CD155, P-selectin glycoprotein ligand-1 (PSG-L1), B7-H3 and B7-H4 expressed on the cell surface (, ); (ii) secreted suppressive cytokines such as IL-6, IL-10 and TGF-β () and (iii) released small molecules, which are also mentioned among the metabolic products discussed below ().
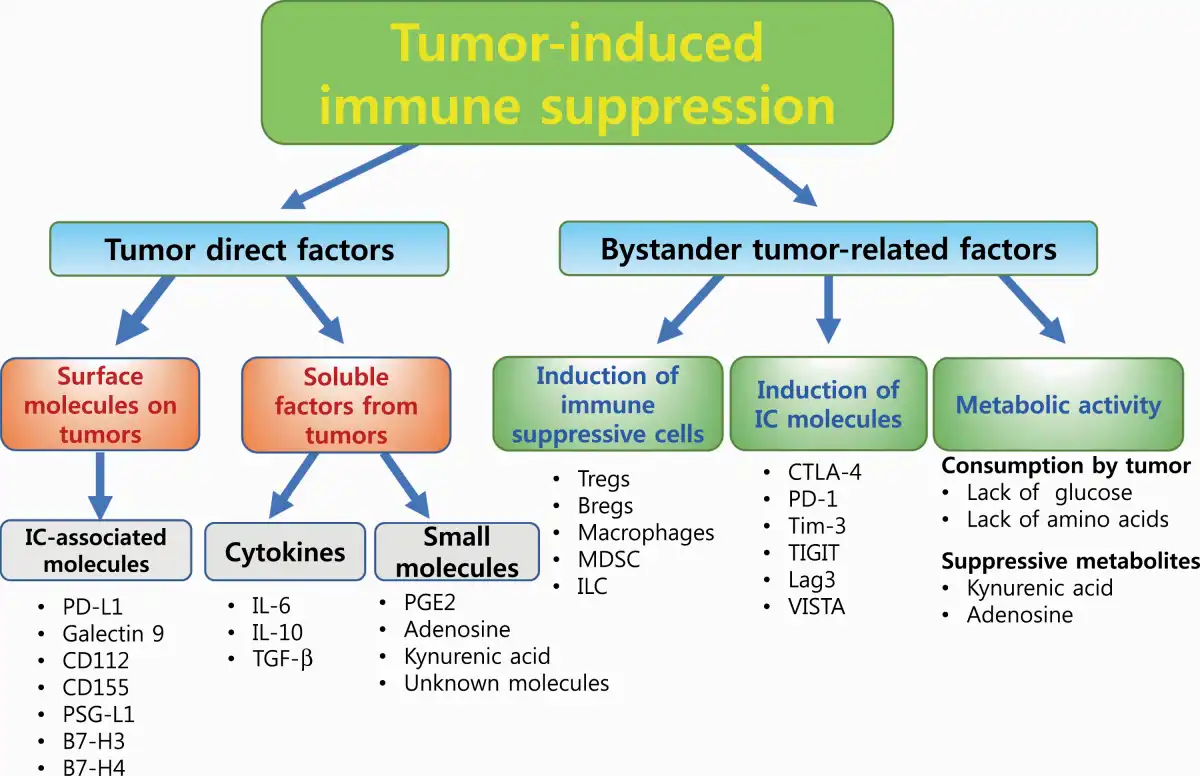
Fig. 1
Different mechanisms of tumor-induced immune suppression. Schematic diagrams of different immune escape mechanisms utilized by tumors are shown. There are two main mechanisms: factors that are directly derived from the tumor and bystander tumor-related factors. Lag3, lymphocyte activation gene 3; TIGIT, T-cell immunoreceptor with immunoglobulin and ITIM domains; VISTA, V-domain immunoglobulin suppressor of T-cell activation.
Bystander factors indirectly suppress tumor-reactive T-cell activity (Fig. 1): (i) by producing particular cytokines and chemokines, tumors induce immunosuppressive cells such as regulatory T cells (Tregs), regulatory B cells (Bregs), suppressive macrophages and some types of innate lymphoid cells (ILCs); (ii) chronic stimulation with tumor antigens induces the expression of IC molecules on T cells, such as PD-1, cytotoxic T lymphocyte antigen 4 (CTLA-4) and T-cell immunoglobulin mucin-domain containing 3 (Tim-3), which inhibit antitumor responses; and (iii) nutrient consumption by cancer cells causes nutrient competition with T cells that ultimately dampens T-cell responses. In addition, several metabolic products in the TME, such as lactic acid, kynurenine (KYN) and adenosine, are known as immunosuppressive factors that inhibit the effector functions of immune cells (). Tumor activity can thus create an unfavorable microenvironment for T-cell survival and activation.
Among the immunosuppressive and/or immune escape systems shown in Fig. 1, the metabolic status of the TME is thought to play a critical role in regulating the antitumor immune responses (). We and other groups have demonstrated that T-cell energy and/or mitochondrial metabolism are good biomarkers and targets of combination therapies (, ). Both the metabolic environment and intracellular metabolism determine the fate and functions of immune cells in the TME. In this review, we will discuss the metabolic profiles and regulation of tumor cells and immune cells, particularly T cells, with further emphasis on how metabolic manipulation improves the immunotherapeutic responses during PD-1 blockade-based cancer immunotherapy.
Immune suppression by tumor metabolic properties
Immune suppression by the Warburg effect in tumor cells
Metabolic reprogramming is a hallmark of cancer progression (). Cancer cells preferentially use glycolytic energy metabolism even under aerobic conditions to meet the increased anabolic and energy demands for rapid proliferation. The aerobic form of glycolysis (known as the Warburg effect) in cancer cells was identified for the first time by Dr Otto Warburg in the 1920s (, ). The dominant glycolytic program in cancer cells facilitates the rapid generation of ATP and the accumulation of lactic acid. Skewing the metabolic profile towards glycolysis in vitro up-regulates and down-regulates the expression of oncogenes and tumor suppressor genes, respectively, resulting in enhanced tumor growth in vivo. In contrast, forced up-regulation of oxidative phosphorylation (OXPHOS) in tumor cells slows their growth in vivo (, ).
An increased concentration of lactic acid prevents T-cell infiltration into the tumor mass and inhibits the up-regulation of nuclear factor of activated T cells (NFAT) in T and NK cells, resulting in reduced IFN-γ production in the TME and allowing escape from antitumor immunity (, ). Fantin et al. showed that inhibiting lactate dehydrogenase A (LDH-A) prevents the conversion of pyruvate to lactate and reduces tumorigenicity (). Inhibition of LDH-A activity up-regulates OXPHOS and compromises cancer cell growth in hypoxic TME conditions. High levels of LDH-A in serum before treatment have been considered an independent, negative risk factor for the survival of patients with hematologic or solid neoplasms (). In 2009, the LDH-A serum level was included in the cancer staging system predefined by the American Joint Committee on Cancer (AJCC) (, ). Notably, a high serum LDH-A level is also associated with poor outcomes in PD-1-blockade and/or CTLA-4 blockade therapies in patients with melanoma or non-small cell lung cancer (NSCLC) ().
Glutamine is the only amino acid that can generate all other nonessential amino acids and also acts as a currency to pay for the import of other amino acids into the cells. Glutamine metabolism is important for the production of the anti-oxidative metabolite glutathione and the cellular pool of NADPH to maintain a normal redox state, and provides α-ketoglutarate for entry into the tricarboxylic acid cycle (TCA cycle; also known as Krebs cycle) cycle to generate energy (, ). Since pyruvate generated by glycolysis is being converted into lactate instead of being used in the TCA cycle in cancer cells, they rely on glutaminolysis for OXPHOS-mediated energy production. Therefore, glutamine blockade reduces ATP levels in cancer cells, resulting in adenosine monophosphate (AMP)-activated protein kinase (AMPK) up-regulation and glycolysis inhibition, whereas T cells can replenish TCA cycle metabolites from glycolysis (). Glutamine blockade might be one of the promising strategies of cancer therapy by targeting a weak point of the Warburg effect.
In summary, the glycolytic profile of tumor cells makes them metabolically fit for rapid proliferation under hypoxic conditions and shapes the immunosuppressive environment.
Metabolic immune suppression in the TME
Similar to cancer cells, T cells also switch their metabolism to a glycolytic profile upon recognition of tumor antigens to meet the biosynthetic and bioenergetic demand for rapid proliferation, although T cells preferentially use anaerobic glycolysis to produce pyruvic acid but not lactic acid (, , ). Because of the similar manners by which cancer and T cells proliferate, there is competition for energy sources and metabolic substrates for anabolic pathways. Several reports have shown that excessive glucose consumption by tumors metabolically restricts T-cell glycolytic activity, leading to T-cell dysfunction (Fig. 2) (, ).
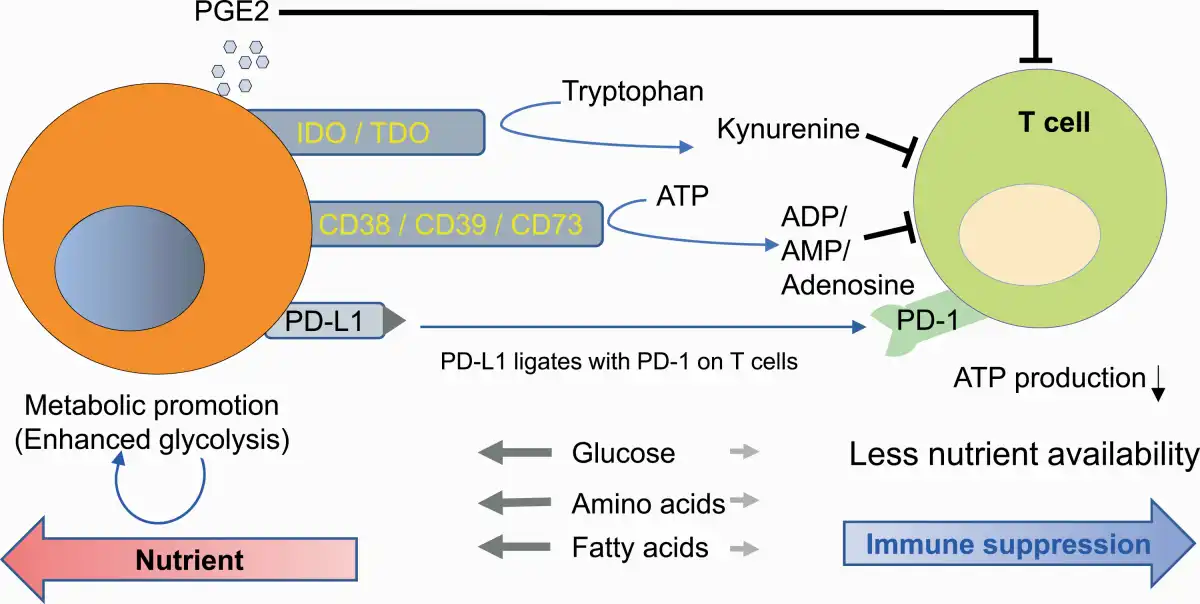
Fig. 2
Metabolic competition by cancer cells induces immune suppression and T-cell exhaustion.
In addition, particular biochemical programs in cancer cells produce metabolites that dampen the function of T cells in the TME. Apart from amino acid synthesis and consumption, cancer cells catabolize some amino acids and generate catabolites that are suppressive, as one of the immune suppressive mechanisms. Cancer cells avidly consume tryptophan, an essential amino acid for T-cell activation and proliferation, and metabolize it to the downstream catabolites KYNs through two enzymes: indoleamine-2,3-dioxygenase (IDO) and tryptophan-2,3-dioxygenase (TDO) (Fig. 2) (). Competition for tryptophan is one of the immunosuppressive mechanisms in the TME, as previously mentioned (), and KYNs are immune suppressors in nature and inhibit the effector activity of T cells (). KYNs are transported in the cells through the system L transporter SLC7A5 binding with aryl hydrocarbon receptor (AhR), a cytosolic transcription factor () and induce the differentiation of CD4+ T cells into Foxp3+ immunosuppressive Tregs (, ). KYN has been also reported to induce reactive oxygen species (ROS), which inhibit IL-2 signaling and impair the generation and function of memory T cells ().
Following activation, T cells consume L-arginine for their anabolic profile and rapid proliferation. L-Arginine serves as a building block for protein synthesis. Elevating L-arginine levels induces global metabolic change and shifts the metabolic profile from glycolysis to OXPHOS that maintains the T cells as central memory (Tcm)-like cells with higher survival capability (). In the TME, myeloid-derived suppressor cells (MDSCs) secrete the enzyme arginase that degrades the arginine present in the vicinity and causes T cells to be deprived of arginine (). Targeting arginase or supplementing L-arginine enhances the efficacy of IC blockade therapies ().
Another metabolic product that suppresses immune responses is adenosine, which is generated by the enzymatic activity of CD38, CD39 and CD73. Adenosine is known to suppress T-cell functions via the A2A receptor, which leads to the synthesis of cyclic AMP (cAMP) (). cAMP activates multifunctional cAMP kinase (cAMPK)-dependent protein kinase (PKA). One of the major mechanisms for T-cell inhibition is PKA-mediated inhibition of protein kinase B (PKB) and signal transducer and activator of transcription 5 (STAT5) phosphorylation, which are downstream of the T-cell antigen receptor (TCR) and IL-2 receptor (IL-2R), respectively (, ). In addition, PKA phosphorylates the transcription factor CREB, which is essential for inducing Tregs (). Since the cell surface enzymes CD38, CD39 and CD73 are highly expressed on tumors, macrophages and apoptotic Tregs, the TME is rich in adenosine, which maintains a suppressive environment ().
Prostaglandin E2 (PGE2), a small molecule lipid mediator synthesized from arachidonic acid by the sequential actions of cyclooxygenase 2 (COX-2) and microsomal prostaglandin E synthase-1 (mPGES-1), has been demonstrated to suppress Th1 differentiation, B-cell functions, T-cell activation and allergic reactions (). PGE2 exerts its action through G-protein-coupled receptors (GPCRs), which are ubiquitously expressed in response to various stimuli under pathophysiological conditions (). PGE2 inhibits T-cell proliferation at two distinct levels: inhibition of IL-2 production and down-regulation of the transferrin receptor via a cAMP-dependent signal transduction pathway (, ). Research and development of drugs targeting IDO, adenosine and PGE2 are progressing, and the combined effect of anti-PD-1 and/or anti-PD-L1 antibodies has been verified in clinical practices ().
Recently, our group showed that some unresponsive tumors release small molecules that directly inhibit the mitochondria of T cells (). To understand whether the tumor is unresponsive because of local immune evasion (a tumor intrinsic property that allows the tumor to be undetected by immune cells) or the induction of systemic immune suppression, we devised a novel bilateral tumor model, in which responsive and unresponsive tumors were injected bilaterally and the growth of the responsive tumor was evaluated. In this model, if responsive tumors became unresponsive under PD-1 blockade conditions, the unresponsive tumor must at least use systemic immune suppression. With this model, we successfully classified unresponsive tumors into two groups—those with or without a systemic immunosuppressive property (SIP). Furthermore, we found that SIP-positive tumors (for example, LLC and CT26) release uncharacterized non-proteinaceous small molecules that directly inhibit mitochondrial activation and proliferation of T cells. We ruled out the possibility of previously reported small molecules such as adenosine, KYNs and PGE2. Therefore, there are still unknown suppressive tumor-derived small molecules (metabolites) in the TME (Fig. 1).
The metabolic program in T-cell differentiation
Impact of energy metabolism on T-cell function
The final effector immune cells in IC blockade cancer immunotherapy (ICI) are T cells. Indeed, the number of T cells that infiltrate the tumor site is one of the predictive and/or prognostic factors in ICI (). Therefore, it is necessary to decipher the mechanism by which energy metabolism regulates T-cell activation, function and differentiation. Glycolysis provides not only fast energy production but also pentose phosphate pathway-mediated NADPH generation for subsequent redox control in T cells (). In addition, glycolysis produces metabolic intermediates that are used in the subsequent mitochondrial TCA cycle to produce large amounts of ATP in mitochondria. Therefore, both robust glycolysis and mitochondrial metabolism are essential for the rapid proliferation of T cells (Fig. 3).
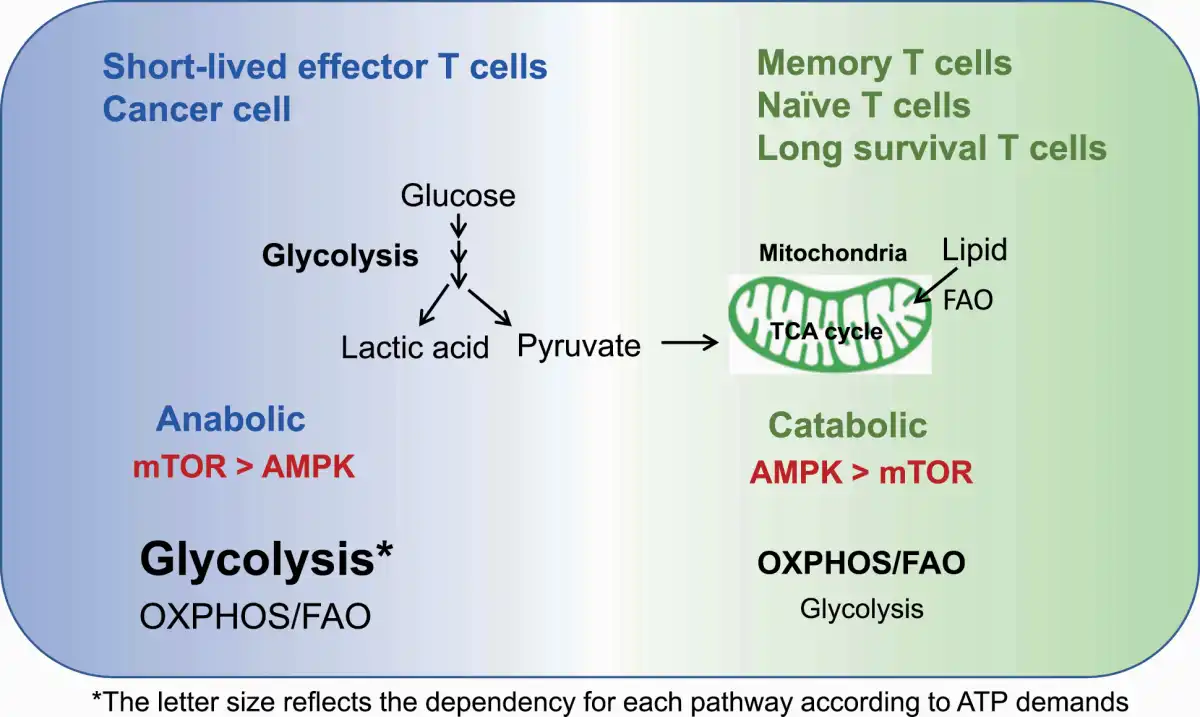
Fig. 3
Distinct metabolic states of naive, effector and memory T cells. Effector T cells are highly metabolic by both the glycolysis and OXPHOS/FAO pathways to meet the high energy demands, with preferential dependence on glycolysis. Memory T cells have an energetically low state and rely on the AMPK-mediated catabolic and OXPHOS/FAO pathways.
Accumulating evidence over the last two decades suggests a critical role of mitochondria in T-cell activation and proliferation. Mitochondrial ROS (mROS) generated at complex III during OXPHOS are converted into H2O2 by manganese superoxide dismutase (MnSOD) and ultimately activate NFAT to regulate T-cell activation (, ). Sena et al. showed that in Uqcrfs1–/– mice (lacking the gene encoding Rieske iron-sulfur protein, a component of complex III in mice), T cells had greatly reduced mROS production, leading to a reduction in NFAT activity, as well as reduced IL-2 production, and the T cells could not proliferate upon antigen stimulation in vivo (, ). On the other hand, Fisicaro et al. reported that mROS induces mitochondrial dysfunction in T cells, and antioxidant reagents attenuate the induction of T-cell exhaustion ().
These apparently contradictory reports suggest that a low amount of mROS is critical for the early phase of T-cell differentiation, whereas accumulation of mROS damages the mitochondria in the later phase and induces an exhausted (unresponsive) state. Therefore, mitochondrial activation, as well as glycolysis, controls T-cell functionality.
Balanced energy sensors are involved in T-cell differentiation
Immunological memory is a hallmark of adaptive immunity. During the activation of immune responses against foreign antigens or against neoantigens on cancer cells, T cells differentiate from metabolically dormant naive cells to active, highly proliferative effector cells. After antigen clearance, some of these cells become long-lasting memory T cells with a dormant metabolism, but these memory T cells have a rapid and robust recall ability upon antigen recognition (, ). To meet the high demands for ATP during anabolic processes, effector T cells utilize both glycolysis and OXPHOS pathways more than naive and memory T cells do, although effector T cells depend more on glycolysis than OXPHOS. In contrast, memory T cells depend more on OXPHOS-mediated catabolic pathways than on glycolysis because they do not need to proliferate (Fig. 3) (, ).
Dependence on anabolic and catabolic pathways is mainly regulated by two opposing key energy sensors—mechanistic target of rapamycin (mTOR) and AMPK, respectively (). The mTOR complex 1 (mTORC1) pathway preferentially activates anabolic glycolytic metabolism under nutrient and energy-rich conditions and the AMPK pathway regulates catabolic mitochondrial metabolism [OXPHOS and fatty acid oxidation (FAO)] under restricted (or lower) nutrient and energy conditions though there are unsolved points in the interaction of mTOR and AMPK (, ). AMPK competes with mTORC1 via mainly two cross-talk mechanisms (): (i) AMPK phosphorylates and activates the tuberous sclerosis complex (TSC), which in turn inactivates RHEB and mTORC1 signaling () and (ii) AMPK phosphorylates raptor, which is a subunit of mTORC1, resulting in preferential binding of raptor to protein 14-3-3 rather than mTORC1 ().
Memory T cells rely on catabolic AMPK metabolism and use fatty acids as an energy source rather than glycolysis. Therefore, memory T cells preferentially depend on FAO and OXPHOS more than they depend on glycolysis (Fig. 3) (, , ). Indeed, mice with deleted tumor necrosis factor (TNF) receptor-associated factor 6 (TRAF6), a critical regulator of FAO, show reduced memory T-cell formation and mount strong effector T-cell responses. In contrast, inhibitors of glycolysis or mTOR signaling enhance the AMPK pathway and induce memory T cells in vivo (). These findings underscore that controlling the metabolic balance could modulate the functional phenotype of T cells.
Both mTOR and AMPK signaling are associated with the ultrastructure and cristae organization in mitochondria (). Buck et al. showed that effector T cells show punctate mitochondria, whereas in memory T cells, the mitochondria have a fused network (). Opa1, a protein required for mitochondrial fusion, is expressed in memory T cells but not effector T cells during adaptive immune responses. Altering the morphology of cristae by fusion configures the associations of electron transport chain (ETC) complexes, and they become condensed (tight), which favors OXPHOS and FAO (, ). On the other hand, mitochondrial fission preferentially used in effector T cells, expands cristae (i.e. loosens them) and reduces ETC efficiency but is required for mitophagy-based anabolism ().
However, the mechanism by which fusion and fission are regulated has not been established. Morita et al. reported that mTORC1 regulates translation of mitochondrial fission process 1 (MTFP1) and mitochondrial recruitment of the fission GTPase dynamin-related protein 1 (DRP1) via signaling downstream of mTORC1 (). Other studies have demonstrated that AMPK directly induces mitochondrial fission by activating mitochondrial fission factor (MFF) and armadillo-containing protein 10 (ARMC10) (). Further studies are necessary to clarify the interaction between T-cell function, energy sensor balance and mitochondrial morphology.
PD-1 signaling and metabolic regulation
PD-1 signaling recruits the phosphatase SHP-2 and dephosphorylates downstream signals from the TCR and CD28, which is a positive costimulatory IC molecule (, ). PD-1 engagement on T cells attenuates glycolysis, glutaminolysis and metabolism associated with branched-chain amino acids (). PD-1 signaling also affects mitochondrial ultrastructure, reducing the expression of Mic19 and Mic14, which are two important proteins for the organization of mitochondrial cristae. PD-1-engaged T cells have reduced mitochondrial depolarization with fewer mitochondrial cristae that lead to mitochondrial dysfunction in T cells (). In contrast, PD-1 engagement reprograms T-cell metabolism towards FAO of endogenous lipids by enhancing the expression of CPT1A, an FAO rate-limiting enzyme (). Therefore, PD-1 engagement attenuates the overall metabolic activity of T cells while it rescues effector T cells from terminal differentiation and a quick death induced by boosted glycolysis by skewing the metabolic balance towards a fat-based metabolic profile, resulting in longevity (Fig. 4) ().
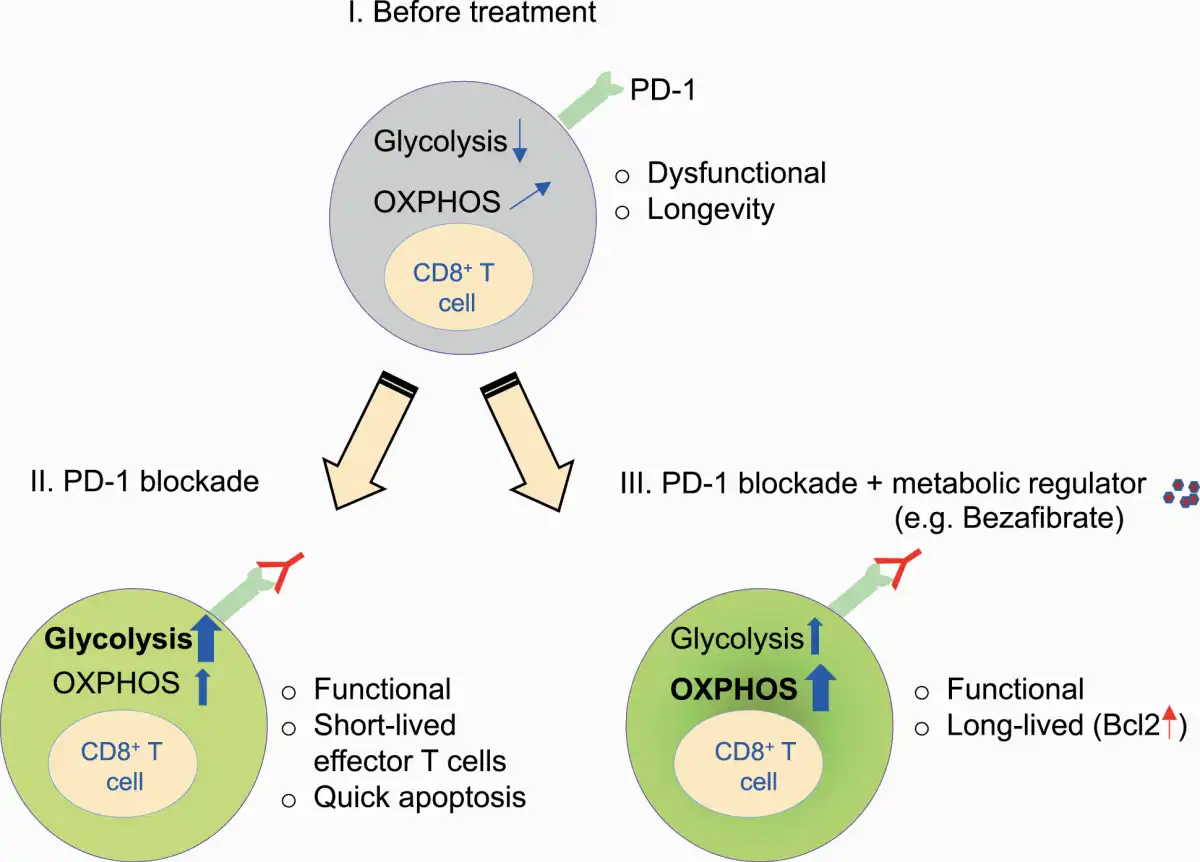
Fig. 4
Combination therapy with metabolic regulators enhances the function and longevity of T cells by up-regulating FAO and OXPHOS during PD-1 blockade. (I) CD8+ T cells with PD-1 engagement rely on less glycolysis and more FAO/OXPHOS. (II) PD-1 blockade monotherapy causes a shift towards a glycolytic profile, leading to terminal differentiation. (III) PD-1 blockade combination therapy with bezafibrate (a pan-PPAR agonist) skews OXPHOS/FAO with Bcl2 up-regulation, leading to maintained longevity and functionality.
Accordingly, blocking PD-1 signaling triggers glycolysis-based terminal differentiation of effector T cells, ultimately leading to clonal deletion by apoptosis (). It is likely that during PD-1 blockade monotherapy, some patients initially show a response but later become unresponsive; the possible explanation may be the reduced availability of effector T cells, as PD-1 blockade induces cell death through overactivation of effector T cells.
Enhancement of antitumor immunity by controlling immune metabolic regulation
As mentioned in the previous sections, the balance between AMPK and mTOR regulates T-cell fate. Effector T cells rely on the mTOR pathway, whereas memory T cells show dependence on AMPK. Metformin (dimethylbiguanide), a drug prescribed for patients with type 2 diabetes, has been reported to have an anticancer effect. Metformin protects CD8+ tumor-infiltrating lymphocytes (TILs) from apoptosis by decreasing caspase-3 expression, leading to an increase in TIL number and function (). The levels of phosphorylated AMPK (pAMPK) are increased, but the levels of a downstream target of mTOR, pS6 are decreased by metformin. Therefore, metformin reprograms T cells towards AMPK and away from the mTOR pathway, which endows T cells with memory-like longevity, although the precise mechanism of the enhancement effect of metformin is still unknown.
Fatty acid metabolism, which mainly includes fatty acid biosynthesis and FAO, is tightly associated with T-cell differentiation. Fatty acids serve as a component of cells and an energy source. Lipid biosynthesis is, therefore, increased in activated T cells and reduced in memory T cells, which preferentially use FAO (, ). Endo et al. showed that the inhibition of fatty acid biosynthesis by an inhibitor or deletion of acetyl coenzyme A carboxylase 1 (ACC1), which is a master regulator of fatty acid biosynthesis, increased memory CD4+ T-cell formation by shifting the intrinsic metabolic profiles from fatty acid synthesis to FAO ().
We reported that combinations of small molecules which improve mitochondrial metabolic pathway (OXPHOS and FAO) of CD8+ T cells could improve PD-1 blockade treatment (, ). As previously discussed, PD-1 blockade recovers T-cell function and boosts the terminal differentiation of T cells via up-regulation of the glycolysis pathway (, ). We hypothesized that this terminal differentiation resulted in the apoptosis of tumor-reactive T cells after PD-1 blockade and is one of the mechanisms associated with unresponsiveness (Fig. 4). Even under glycolysis-dependent metabolism during PD-1 blockade, we showed that enhancement of mitochondria-mediated FAO by metabolic drugs increases antiapoptotic gene expression, increases T-cell longevity and boosts their function. For example, skewing the metabolism of T cells towards FAO by enhancing the peroxisome proliferator-activated receptor (PPAR)/PPAR-γ gamma coactivator-1α (PGC-1α) axis using bezafibrate (a pan-PPAR agonist) rescues T cells from apoptosis, and they become long-lived under PD-1 blockade. This combination therapy ameliorated the tumor rejection rate and the survival of tumor-bearing hosts (, ). Therefore, mitochondria-mediated FAO activation in T cells during PD-1 blockade therapy is a promising strategy to maintain functional effector T cells.
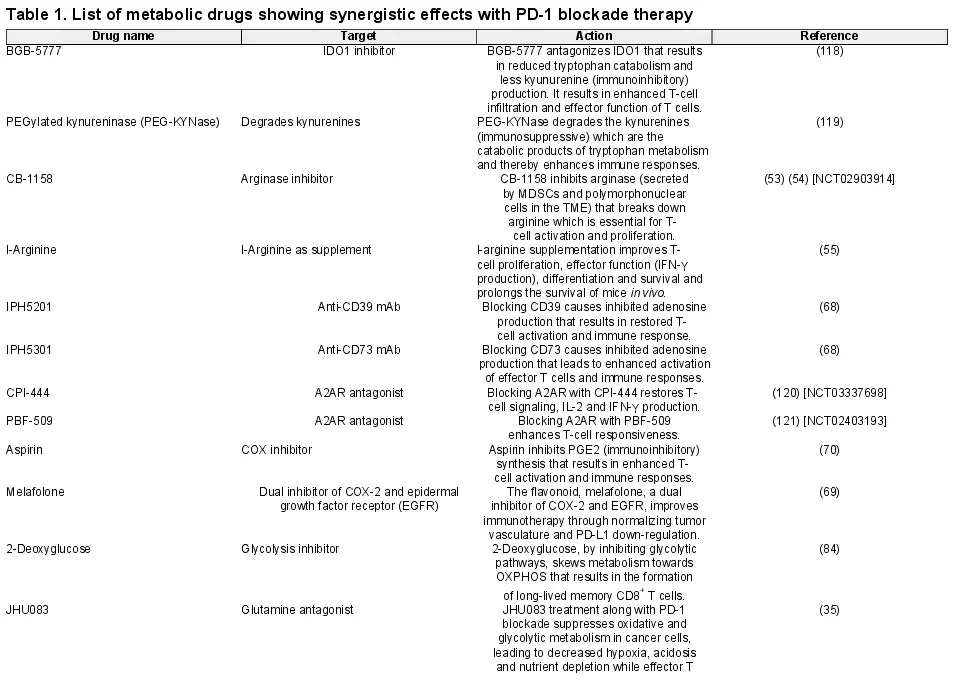
Together, metabolic regulation in tumors or immune cells has received attention, and several trials of combination therapies with ICI therapy are being tested. We have summarized the metabolic modulators tested in combination therapy with PD-1 blockade to improve treatment efficacy in Table 1.
Metabolic biomarkers of PD-1 blockade cancer immunotherapy
Although few studies have been reported on the efficacy-predictive biomarkers related to immune metabolism in ICI therapy, the concept of immune metabolism would be very useful for biomarker development. We reported that PD-1 blockade activates the mitochondria in T cells (). Accordingly, a mitochondrial surge was observed in T cells from draining lymph nodes of hosts bearing responsive tumors but not unresponsive tumors during PD-1 blockade (). Miyajima et al. reported that the levels of serum metabolites associated with energy metabolism, including amino acids, are reduced in PD-1–/– mice because of consumption by constitutively activated T cells (). It has also been shown that blood metabolite levels related to the TCA cycle was reduced in models of PD-1 blockade cancer immunotherapy (). T-cell activation and the blood levels of metabolites are tightly co-regulated. The metabolic profile of responsive patients should therefore be altered and contain effective biomarkers.
We investigated plasma metabolites in patients with NSCLC before and after treatment with the PD-1 blocking antibody nivolumab (). Responsive patients reduced levels of the TCA cycle (α-ketoglutaric acid) and FAO-related metabolites (acylcarnitine families). Unexpectedly, reposnders showed higher levels of microbiome-related metabolites (hippuric acid and 4-cresol) and redox-related metabolites (glutathione disulfide and cysteine) before and/or after PD-1 blockade therapy. These results suggest that flora, redox and energy metabolism interact in antitumor immune responses in cancer patients.
Additionally, we extracted peripheral blood mononuclear cells from the same blood samples and analyzed cellular markers, including those related to T-cell mitochondria, by flow cytometry. The combination of four T-cell markers—(i) markers associated with mitochondrial activity (PGC-1α/β expression in CD8+ T cells), (ii) markers associated with the oxidative state (ROS expression in CD8+ T cells), (iii) the frequency of PD-1high CD8+ T cells and (iv) the frequency of CD4+ T cells—was highly predictive for responders (mean AUC = 0.956 by machine learning cross-validation). Among all plasma metabolites and cellular markers tested, these four cellular markers were exclusively selected as the best combination for predicting the responding patients.
Subsequent correlation analysis revealed that metabolite markers related to microbiota, FAO and redox reactions are strongly linked to the cellular markers of PGC-1α/β expression, the frequency of PD-1high cells and ROS expression in CD8+ killer T cells, respectively. We concluded that this strong linkage excludes metabolite markers, which suggests that the metabolite markers could reflect T cell immune responses against tumors. Therefore, a combination of markers including metabolites and/or T-cell mitochondria-associated molecules is quite valuable. It should also be noted that an examination of immune biomarkers using blood cells would be less traumatic for patients than a tumor tissue biopsy, which is clinically used as ICI biomarkers (, ).
Conclusions
Energy metabolism is a fundamental physiological activity in cells and individuals. As shown in Table 1, various clinical trials and animal models of combination therapies using metabolic modulators have been reported. Encouraged by the increased knowledge of tumor and T-cell metabolism, efforts should be made to manipulate anti-tumor immune responses for clinical benefit as a next step.
However, the metabolic system is still complicated, especially the cross-talk between cancer cells and immune cells. We focused on conventional T-cell metabolism in this review, but there are various types of immune cells involved in antitumor activity, such as Tregs, macrophages, dendritic cells and B cells, that use different pathways of metabolic regulation (). Suppressive immune cells such as Tregs and macrophages (M2) depend more on FAO/OXPHOS for their survival (). Although we discussed the benefits of FAO/OXPHOS introduction in T cells for antitumor efficacy, we need to consider the balance of these other suppressive immune cells.
It has also been reported that the microbiota and aging affect the metabolic state not only in the whole body but also at the level of single cells (). Even at the single-cell level, the cross-talk between mTOR and AMPK signaling is controversial, which is exemplified by the fact that both mTOR and AMPK activators enhance the efficacy of IC inhibitors (, , ). Therefore, more mechanistic analysis of immune metabolism is required to precisely control immune reactions in the future.
References
- 1. Chowdhury P. S., Chamoto K., Honjo T. 2018. Combination therapy strategies for improving PD-1 blockade efficacy: a new era in cancer immunotherapy. J. Intern. Med. 283:110.
- 2. Iwai Y., Hamanishi J., Chamoto K., Honjo T. 2017. Cancer immunotherapies targeting the PD-1 signaling pathway. J. Biomed. Sci. 24:26.
- 3. Chamoto K., Hatae R., Honjo T. 2020. Current issues and perspectives in PD-1 blockade cancer immunotherapy. Int. J. Clin. Oncol. 25:790.
- 4. Andrews L. P., Yano H., Vignali D. A. A. 2019. Inhibitory receptors and ligands beyond PD-1, PD-L1 and CTLA-4: breakthroughs or backups. Nat. Immunol. 20:1425.
- 5. Kusmartsev S., Gabrilovich D. I. 2006. Effect of tumor-derived cytokines and growth factors on differentiation and immune suppressive features of myeloid cells in cancer. Cancer Metastasis Rev. 25:323.
- 6. Brand A., Singer K., Koehl G. E., et al 2016. LDHA-associated lactic acid production blunts tumor immunosurveillance by T and NK cells. Cell Metab. 24:657.
- 7. Katz J. B., Muller A. J., Prendergast G. C. 2008. Indoleamine 2,3-dioxygenase in T-cell tolerance and tumoral immune escape. Immunol. Rev. 222:206.
- 8. Ohta A. 2016. A metabolic immune checkpoint: adenosine in tumor microenvironment. Front. Immunol. 7:109.
- 9. Kumar A., Chamoto K., Chowdhury P. S., Honjo T. 2020. Tumors attenuating the mitochondrial activity in T cells escape from PD-1 blockade therapy. ELife9:e52330.
- 10. Fox C. J., Hammerman P. S., Thompson C. B. 2005. Fuel feeds function: energy metabolism and the T-cell response. Nat. Rev. Immunol. 5:844.
- 11. Siska P. J., Rathmell J. C. 2015. T cell metabolic fitness in antitumor immunity. Trends Immunol. 36:257.
- 12. Renner K., Singer K., Koehl G. E., et al 2017. Metabolic hallmarks of tumor and immune cells in the tumor microenvironment. Front. Immunol. 8:248.
- 13. Buck M. D., O’Sullivan D., Klein Geltink R. I., et al 2016. Mitochondrial dynamics controls T cell fate through metabolic programming. Cell166:63.
- 14. Chamoto K., Chowdhury P. S., Kumar A., et al 2017. Mitochondrial activation chemicals synergize with surface receptor PD-1 blockade for T cell-dependent antitumor activity. Proc. Natl Acad. Sci. USA114:E761.
- 15. Chowdhury P. S., Chamoto K., Kumar A., Honjo T. 2018. PPAR-induced fatty acid oxidation in T cells increases the number of tumor-reactive CD8+ T cells and facilitates anti-PD-1 therapy. Cancer Immunol. Res. 6:1375.
- 16. Hatae R., Chamoto K., Kim Y. H., et al 2020. Combination of host immune metabolic biomarkers for the PD-1 blockade cancer immunotherapy. JCI Insight5:e133501.
- 17. Wan H., Xu B., Zhu N., Ren B. 2020. PGC-1α activator-induced fatty acid oxidation in tumor-infiltrating CTLs enhances effects of PD-1 blockade therapy in lung cancer. Tumori106:55.
- 18. Hanahan D., Weinberg R. A. 2011. Hallmarks of cancer: the next generation. Cell144:646.
- 19. DeBerardinis R. J., Thompson C. B. 2012. Cellular metabolism and disease: what do metabolic outliers teach us?Cell148:1132.
- 20. Galluzzi L., Kepp O., Vander Heiden M. G., Kroemer G. 2013. Metabolic targets for cancer therapy. Nat. Rev. Drug Discov. 12:829.
- 21. Warburg O., Wind F., Negelein E. 1927. The metabolism of tumors in the body. J. Gen. Physiol. 8:519.
- 22. Potter M., Newport E., Morten K. J. 2016. The Warburg effect: 80 years on. Biochem. Soc. Trans. 44:1499.
- 23. Kroemer G., Pouyssegur J. 2008. Tumor cell metabolism: cancer’s Achilles’ heel. Cancer Cell13:472.
- 24. Vander Heiden M. G., Cantley L. C., Thompson C. B. 2009. Understanding the Warburg effect: the metabolic requirements of cell proliferation. Science324:1029.
- 25. Scott K. E., Cleveland J. L. 2016. Lactate wreaks havoc on tumor-infiltrating T and NK Cells. Cell Metab. 24:649.
- 26. Fantin V. R., St-Pierre J., Leder P. 2006. Attenuation of LDH-A expression uncovers a link between glycolysis, mitochondrial physiology, and tumor maintenance. Cancer Cell9:425.
- 27. Oei R. W., Ye L., Kong F., et al 2018. Pre-treatment serum lactate dehydrogenase is predictive of survival in patients with nasopharyngeal carcinoma undergoing intensity-modulated radiotherapy. J. Cancer9:54.
- 28. Balch C. M., Gershenwald J. E., Soong S. J., et al 2009. Final version of 2009 AJCC Melanoma Staging and Classification. J. Clin. Oncol. 27:6199.
- 29. Gershenwald J. E., Scolyer R. A., Hess K. R., et al; for members of the American Joint Committee on Cancer Melanoma Expert Panel and the International Melanoma Database and Discovery Platform. 2017. Melanoma staging: evidence-based changes in the American Joint Committee on Cancer eighth edition cancer staging manual. CA Cancer J. Clin. 67:472.
- 30. Dick J., Lang N., Slynko A., et al 2016. Use of LDH and autoimmune side effects to predict response to ipilimumab treatment. Immunotherapy8:1033.
- 31. Petrelli F., Ardito R., Merelli B., et al 2019. Prognostic and predictive role of elevated lactate dehydrogenase in patients with melanoma treated with immunotherapy and BRAF inhibitors: a systematic review and meta-analysis. Melanoma Res. 29:1.
- 32. Zhang Z., Li Y., Yan X., et al 2019. Pretreatment lactate dehydrogenase may predict outcome of advanced non small-cell lung cancer patients treated with immune checkpoint inhibitors: a meta-analysis. Cancer Med. 8:1467.
- 33. Cluntun A. A., Lukey M. J., Cerione R. A., Locasale J. W. 2017. Glutamine metabolism in cancer: understanding the heterogeneity. Trends Cancer3:169.
- 34. Yaqoob P., Calder P. C. 1997. Glutamine requirement of proliferating T lymphocytes. Nutrition13:646.
- 35. Leone R. D., Zhao L., Englert J. M., et al 2019. Glutamine blockade induces divergent metabolic programs to overcome tumor immune evasion. Science366:1013.
- 36. Jones R. G., Thompson C. B. 2007. Revving the engine: signal transduction fuels T cell activation. Immunity27:173.
- 37. Chang C. H., Qiu J., O’Sullivan D., et al 2015. Metabolic competition in the tumor microenvironment is a driver of cancer progression. Cell162:1229.
- 38. Ho P. C., Bihuniak J. D., Macintyre A. N., et al 2015. Phosphoenolpyruvate is a metabolic checkpoint of anti-tumor T cell responses. Cell162:1217.
- 39. Zhai L., Ladomersky E., Lenzen A., et al 2018. IDO1 in cancer: a Gemini of immune checkpoints. Cell. Mol. Immunol. 15:447.
- 40. Munn D. H., Zhou M., Attwood J. T., et al 1998. Prevention of allogeneic fetal rejection by tryptophan catabolism. Science281:1191.
- 41. Mellor A. L., Munn D. H. 1999. Tryptophan catabolism and T-cell tolerance: immunosuppression by starvation?Immunol. Today20:469.
- 42. Widner B., Weiss G., Fuchs D. 2000. Tryptophan degradation to control T-cell responsiveness. Immunol. Today21:250.
- 43. Liu P., Xie B. L., Cai S. H., et al 2009. Expression of indoleamine 2,3-dioxygenase in nasopharyngeal carcinoma impairs the cytolytic function of peripheral blood lymphocytes. BMC Cancer9:416.
- 44. Mellor A. L., Munn D. H. 2004. IDO expression by dendritic cells: tolerance and tryptophan catabolism. Nat. Rev. Immunol. 4:762.
- 45. Platten M., Litzenburger U., Wick W. 2012. The aryl hydrocarbon receptor in tumor immunity. Oncoimmunology1:396.
- 46. Sinclair L. V., Neyens D., Ramsay G., Taylor P. M., Cantrell D. A. 2018. Single cell analysis of kynurenine and System L amino acid transport in T cells. Nat. Commun. 9:1981.
- 47. Xue P., Fu J., Zhou Y. 2018. The aryl hydrocarbon receptor and tumor immunity. Front. Immunol. 9:286.
- 48. Quintana F. J., Basso A. S., Iglesias A. H., et al 2008. Control of T(reg) and T(H)17 cell differentiation by the aryl hydrocarbon receptor. Nature453:65.
- 49. Mezrich J. D., Fechner J. H., Zhang X., Johnson B. P., Burlingham W. J., Bradfield C. A. 2010. An interaction between kynurenine and the aryl hydrocarbon receptor can generate regulatory T cells. J. Immunol. 185:3190.
- 50. Dagenais-Lussier X., Aounallah M., Mehraj V., et al 2016. Kynurenine reduces memory CD4 T-cell survival by interfering with interleukin-2 signaling early during HIV-1 infection. J. Virol. 90:7967.
- 51. Geiger R., Rieckmann J. C., Wolf T., et al 2016. L-Arginine modulates T cell metabolism and enhances survival and anti-tumor activity. Cell167:829.
- 52. Rodriguez P. C., Ernstoff M. S., Hernandez C., et al 2009. Arginase I-producing myeloid-derived suppressor cells in renal cell carcinoma are a subpopulation of activated granulocytes. Cancer Res. 69:1553.
- 53. Steggerda S. M., Bennett M. K., Chen J., et al 2017. Inhibition of arginase by CB-1158 blocks myeloid cell-mediated immune suppression in the tumor microenvironment. J. Immunother. Cancer5:101.
- 54. Papadopoulos K. P., Tsai F. Y.-C., Bauer T. M., et al 2017. CX-1158-101: a first-in-human phase 1 study of CB-1158, a small molecule inhibitor of arginase, as monotherapy and in combination with an anti-PD-1 checkpoint inhibitor in patients (pts) with solid tumors. J. Clin. Oncol. 35(suppl. 15):3005.
- 55. He X., Lin H., Yuan L., Li B. 2017. Combination therapy withL-arginine and alpha-PD-L1 antibody boosts immune response against osteosarcoma in immunocompetent mice. Cancer Biol. Ther. 18:94.
- 56. Zhang H., Conrad D. M., Butler J. J., Zhao C., Blay J., Hoskin D. W. 2004. Adenosine acts through A2 receptors to inhibit IL-2-induced tyrosine phosphorylation of STAT5 in T lymphocytes: role of cyclic adenosine 3’,5’-monophosphate and phosphatases. J. Immunol. 173:932.
- 57. Bono M. R., Fernández D., Flores-Santibáñez F., Rosemblatt M., Sauma D. 2015. CD73 and CD39 ectonucleotidases in T cell differentiation: beyond immunosuppression. FEBS Lett. 589:3454.
- 58. Wen A. Y., Sakamoto K. M., Miller L. S. 2010. The role of the transcription factor CREB in immune function. J. Immunol. 185:6413.
- 59. Maj T., Wang W., Crespo J., et al 2017. Oxidative stress controls regulatory T cell apoptosis and suppressor activity and PD-L1-blockade resistance in tumor. Nat. Immunol. 18:1332.
- 60. Kunikata T., Yamane H., Segi E., et al 2005. Suppression of allergic inflammation by the prostaglandin E receptor subtype EP3. Nat. Immunol. 6:524.
- 61. Sreeramkumar V., Fresno M., Cuesta N. 2012. Prostaglandin E2 and T cells: friends or foes?Immunol. Cell Biol. 90:579.
- 62. Kalinski P. 2012. Regulation of immune responses by prostaglandin E2. J. Immunol. 188:21.
- 63. Hirata T., Narumiya S. 2011. Prostanoid receptors. Chem. Rev. 111:6209.
- 64. Chouaib S., Welte K., Mertelsmann R., Dupont B. 1985. Prostaglandin E2 acts at two distinct pathways of T lymphocyte activation: inhibition of interleukin 2 production and down-regulation of transferrin receptor expression. J. Immunol. 135:1172.
- 65. Wehbi V. L., Taskén K. 2016. Molecular mechanisms for cAMP-mediated immunoregulation in T cells—role of anchored protein kinase A signaling units. Front. Immunol. 7:222.
- 66. Platten M., von Knebel Doeberitz N., Oezen I., Wick W., Ochs K. 2014. Cancer immunotherapy by targeting IDO1/TDO and their downstream effectors. Front. Immunol. 5:673.
- 67. Labadie B. W., Bao R., Luke J. J. 2019. Reimagining IDO pathway inhibition in cancer immunotherapy via downstream focus on the tryptophan-kynurenine-aryl hydrocarbon axis. Clin. Cancer Res. 25:1462.
- 68. Perrot I., Michaud H. A., Giraudon-Paoli M., et al 2019. Blocking antibodies targeting the CD39/CD73 immunosuppressive pathway unleash immune responses in combination cancer therapies. Cell Rep. 27:2411.
- 69. Tang H., Liu Y., Wang C., et al 2019. Inhibition of COX-2 and EGFR by melafolone improves Anti-PD-1 therapy through vascular normalization and PD-L1 downregulation in lung cancer. J. Pharmacol. Exp. Ther. 368:401.
- 70. Zelenay S., van der Veen A. G., Böttcher J. P., et al 2015. Cyclooxygenase-dependent tumor growth through evasion of immunity. Cell162:1257.
- 71. Galon J., Costes A., Sanchez-Cabo F., et al 2006. Type, density, and location of immune cells within human colorectal tumors predict clinical outcome. Science313:1960.
- 72. Tumeh P. C., Harview C. L., Yearley J. H., et al 2014. PD-1 blockade induces responses by inhibiting adaptive immune resistance. Nature515:568.
- 73. van der Woude L. L., Gorris M. A. J., Halilovic A., Figdor C. G, de Vries I. J. M. 2017. Migrating into the tumor: a roadmap for T cells. Trends Cancer3:797.
- 74. Bonaventura P., Shekarian T., Alcazer V., et al 2019. Cold tumors: a therapeutic challenge for immunotherapy. Front. Immunol. 10:168.
- 75. Patsoukis N., Bardhan K., Weaver J., et al 2016. The role of metabolic reprogramming in T cell fate and function. Curr. Trends Immunol. 17:1.
- 76. Turrens J. F. 2003. Mitochondrial formation of reactive oxygen species. J. Physiol. 552(Pt 2):335.
- 77. Weinberg S. E., Sena L. A., Chandel N. S. 2015. Mitochondria in the regulation of innate and adaptive immunity. Immunity42:406.
- 78. Sena L. A., Li S., Jairaman A., et al 2013. Mitochondria are required for antigen-specific T cell activation through reactive oxygen species signaling. Immunity38:225.
- 79. Murphy M. P., Siegel R. M. 2013. Mitochondrial ROS fire up T cell activation. Immunity38:201.
- 80. Fisicaro P., Barili V., Montanini B., et al 2017. Targeting mitochondrial dysfunction can restore antiviral activity of exhausted HBV-specific CD8 T cells in chronic hepatitis B. Nat. Med. 23:327.
- 81. van der Windt G. J., O’Sullivan D., Everts B., et al 2013. CD8 memory T cells have a bioenergetic advantage that underlies their rapid recall ability. Proc. Natl Acad. Sci. USA110:14336.
- 82. Martin M. D., Badovinac V. P. 2018. Defining memory CD8 T cell. Front. Immunol. 9:2692.
- 83. Pearce E. L., Walsh M. C., Cejas P. J., et al 2009. Enhancing CD8 T-cell memory by modulating fatty acid metabolism. Nature460:103.
- 84. Sukumar M., Liu J., Ji Y., et al 2013. Inhibiting glycolytic metabolism enhances CD8+ T cell memory and antitumor function. J. Clin. Invest. 123:4479.
- 85. Inoki K., Kim J., Guan K. L. 2012. AMPK and mTOR in cellular energy homeostasis and drug targets. Annu. Rev. Pharmacol. Toxicol. 52:381.
- 86. Xu J., Ji J., Yan X. H. 2012. Cross-talk between AMPK and mTOR in regulating energy balance. Crit. Rev. Food Sci. Nutr. 52:373.
- 87. Vadlakonda L., Dash A., Pasupuleti M., Anil Kumar K., Reddanna P. 2013. The paradox of Akt-mTOR interactions. Front. Oncol. 3:165.
- 88. Buck M. D., O’Sullivan D., Pearce E. L. 2015. T cell metabolism drives immunity. J. Exp. Med. 212:1345.
- 89. Hindupur S. K., González A., Hall M. N. 2015. The opposing actions of target of rapamycin and AMP-activated protein kinase in cell growth control. Cold Spring Harb. Perspect. Biol. 7:a019141.
- 90. Inoki K., Zhu T., Guan K. L. 2003. TSC2 mediates cellular energy response to control cell growth and survival. Cell115:577.
- 91. Gwinn D. M., Shackelford D. B., Egan D. F., et al 2008. AMPK phosphorylation of raptor mediates a metabolic checkpoint. Mol. Cell30:214.
- 92. Araki K., Turner A. P., Shaffer V. O., et al 2009. mTOR regulates memory CD8 T-cell differentiation. Nature460:108.
- 93. Parra V., Verdejo H. E., Iglewski M., et al 2014. Insulin stimulates mitochondrial fusion and function in cardiomyocytes via the Akt-mTOR-NFκB-Opa-1 signaling pathway. Diabetes63:75.
- 94. Toyama E. Q., Herzig S., Courchet J., et al 2016. Metabolism. AMP-activated protein kinase mediates mitochondrial fission in response to energy stress. Science351:275.
- 95. Morita M., Prudent J., Basu K., et al 2017. mTOR controls mitochondrial dynamics and cell survival via MTFP1. Mol. Cell67:922.
- 96. Chen Z., Lei C., Wang C., et al 2019. Global phosphoproteomic analysis reveals ARMC10 as an AMPK substrate that regulates mitochondrial dynamics. Nat. Commun. 10:104.
- 97. Xue R. Q., Zhao M., Wu Q., et al 2019. Regulation of mitochondrial cristae remodelling by acetylcholine alleviates palmitate-induced cardiomyocyte hypertrophy. Free Radic. Biol. Med. 145:103.
- 98. Cogliati S., Frezza C., Soriano M. E., et al 2013. Mitochondrial cristae shape determines respiratory chain supercomplexes assembly and respiratory efficiency. Cell155:160.
- 99. Civiletto G., Varanita T., Cerutti R., et al 2015. Opa1 overexpression ameliorates the phenotype of two mitochondrial disease mouse models. Cell Metab. 21:845.
- 100. Okazaki T., Maeda A., Nishimura H., Kurosaki T., Honjo T. 2001. PD-1 immunoreceptor inhibits B cell receptor-mediated signaling by recruiting src homology 2-domain-containing tyrosine phosphatase 2 to phosphotyrosine. Proc. Natl Acad. Sci. USA98:13866.
- 101. Hui E., Cheung J., Zhu J., et al 2017. T cell costimulatory receptor CD28 is a primary target for PD-1-mediated inhibition. Science355:1428.
- 102. Patsoukis N., Bardhan K., Chatterjee P., et al 2015. PD-1 alters T-cell metabolic reprogramming by inhibiting glycolysis and promoting lipolysis and fatty acid oxidation. Nat. Commun. 6:6692.
- 103. Ogando J., Sáez M. E., Santos J., et al 2019. PD-1 signaling affects cristae morphology and leads to mitochondrial dysfunction in human CD8+ T lymphocytes. J. Immunother. Cancer7:151.
- 104. Eikawa S., Nishida M., Mizukami S., Yamazaki C., Nakayama E., Udono H. 2015. Immune-mediated antitumor effect by type 2 diabetes drug, metformin. Proc. Natl Acad. Sci. USA112:1809.
- 105. Kidani Y., Elsaesser H., Hock M. B., et al 2013. Sterol regulatory element-binding proteins are essential for the metabolic programming of effector T cells and adaptive immunity. Nat. Immunol. 14:489.
- 106. O’Sullivan D., van der Windt G. J., Huang S. C., et al 2014. Memory CD8(+) T cells use cell-intrinsic lipolysis to support the metabolic programming necessary for development. Immunity41:75.
- 107. Endo Y., Onodera A., Obata-Ninomiya K., et al 2019. ACC1 determines memory potential of individual CD4+ T cells by regulating de novo fatty acid biosynthesis. Nat. Metabol. 1:261.
- 108. Miyajima M., Zhang B., Sugiura Y., et al 2017. Metabolic shift induced by systemic activation of T cells in PD-1-deficient mice perturbs brain monoamines and emotional behavior. Nat. Immunol. 18:1342.
- 109. Nixon A. B., Schalper K. A., Jacobs I., Potluri S., Wang I. M., Fleener C. 2019. Peripheral immune-based biomarkers in cancer immunotherapy: can we realize their predictive potential?J. Immunother. Cancer7:325.
- 110. Kim K. H., Kim C. G., Shin E. C. 2020. Peripheral blood immune cell-based biomarkers in anti-PD-1/PD-L1 therapy. Immune Netw. 20:e8.
- 111. Michalek R. D., Gerriets V. A., Jacobs S. R., et al 2011. Cutting edge: distinct glycolytic and lipid oxidative metabolic programs are essential for effector and regulatory CD4+ T cell subsets. J. Immunol. 186:3299.
- 112. Galgani M., De Rosa V., La Cava A., Matarese G. 2016. Role of metabolism in the immunobiology of regulatory T cells. J. Immunol. 197:2567.
- 113. Shi H., Chi H. 2019. Metabolic control of Treg cell stability, plasticity, and tissue-specific heterogeneity. Front. Immunol. 10:2716.
- 114. Viola A., Munari F., Sánchez-Rodríguez R., Scolaro T., Castegna A. 2019. The metabolic signature of macrophage responses. Front. Immunol. 10:1462.
- 115. Barzilai N., Huffman D. M., Muzumdar R. H., Bartke A. 2012. The critical role of metabolic pathways in aging. Diabetes61:1315.
- 116. Levy M., Thaiss C. A., Elinav E. 2016. Metabolites: messengers between the microbiota and the immune system. Genes Dev. 30:1589.
- 117. Quinn K. M., Palchaudhuri R., Palmer C. S., La Gruta N. L. 2019. The clock is ticking: the impact of ageing on T cell metabolism. Clin. Transl. Immunol. 8:e01091.
- 118. Ladomersky E., Zhai L., Lenzen A., et al 2018. IDO1 inhibition synergizes with radiation and PD-1 blockade to durably increase survival against advanced glioblastoma. Clin. Cancer Res. 24:2559.
- 119. Triplett T. A., Garrison K. C., Marshall N., et al 2018. Reversal of indoleamine 2,3-dioxygenase-mediated cancer immune suppression by systemic kynurenine depletion with a therapeutic enzyme. Nat. Biotechnol. 36:758.
- 120. Willingham S. B., Ho P. Y., Hotson A., et al 2018. A2AR antagonism with CPI-444 induces antitumor responses and augments efficacy to anti-PD-(L)1 and anti-CTLA-4 in preclinical models. Cancer Immunol. Res. 6:1136.
- 121. Mediavilla-Varela M., Castro J., Chiappori A., et al 2017. A novel antagonist of the immune checkpoint protein adenosine A2a receptor restores tumor-infiltrating lymphocyte activity in the context of the tumor microenvironment. Neoplasia19:530.
- 122. Pietrocola F., Pol J., Vacchelli E., et al 2016. Caloric restriction mimetics enhance anticancer immunosurveillance. Cancer Cell30:147.
- 123. Saibil S. D., St Paul M., Laister R. C., et al 2019. Activation of peroxisome proliferator-activated receptors α and δ synergizes with inflammatory signals to enhance adoptive cell therapy. Cancer Res. 79:445.
- 124. Moore E. C., Cash H. A., Caruso A. M., et al 2016. Enhanced tumor control with combination mTOR and PD-L1 inhibition in syngeneic oral cavity cancers. Cancer Immunol. Res. 4:611.
- 125. Langdon S., Hughes A., Taylor M. A., et al 2018. Combination of dual mTORC1/2 inhibition and immune-checkpoint blockade potentiates anti-tumour immunity. Oncoimmunology7:e1458810.
- 126. Hirayama Y., Gi M., Yamano S., et al 2016. Anti-PD-L1 treatment enhances antitumor effect of everolimus in a mouse model of renal cell carcinoma. Cancer Sci. 107:1736.
- 127. Scholz G., Jandus C., Zhang L., et al 2016. Modulation of mTOR signalling triggers the formation of stem cell-like memory T cells. EBioMedicine4:50.