Introduction
Measuring mechanical properties of cell walls presents a significant but important challenge. One of the key factors contributing to the complexity of plant cell walls is the non-uniform spatial distribution of mechanical properties such as the elastic modulus. This effect has recently been demonstrated at the tissue level for shoot apical meristems (SAMs) of Arabidopsis thaliana. found that hypo-osmotic treatment of the meristems causes 45–80% surface expansion of peripheral cells but only 25% for cells in the central area. These results are supported by direct nano-mechanical measurements on plasmolysed SAMs using atomic force microscopy (AFM), where the elastic modulus of cells in the apex is measured to be 5±2MPa compared with only 1.5±0.7MPa at the periphery (). The significance of such local wall mechanical heterogeneities has become increasingly relevant in a number of biological processes and was again highlighted upon discovering that the auxin transporter PIN1 responds to mechanical cues, indicating that the mechanical map of the meristem may co-ordinate polarity ().
Mechanical properties of walls are determined by the composition and organization of both the macromolecular components of the wall and the water content. These components provide structural support as well as a signalling function via a feedback mechanism that informs the interior biochemical machinery of the cell of its mechanical environment, as well as placing constraints on possible realizations of plant cell wall microstructure. The latter stems from the fact that not all microstructures that can be assembled for a given cell wall composition provide an adequate mechanical barrier that (i) counter-balances the turgor pressure; and (ii) has tuneable properties that enable cell growth and deformation. Little, however, is known about mechanical heterogeneity within walls at the cellular level.
We hypothesize that mechanical heterogeneity and the resultant local gradients of mechanical stress are important factors driving the assembly of polysaccharides at the cell wall level. Such local mechanical stresses acting in concert with intermolecular interactions such as hydrogen bonding provide a physical mechanism of formation of different types of microstructures with a wide range of mechanical properties. During their development, cells may ‘utilize’ this mechanism to adopt a certain mechanical phenotype, ‘stiff’ or ‘soft’, which is essential for the formation of growth zones and morphogenic specialization.
While there are reports suggesting mechanical heterogeneities at the level of a single cell, the magnitude of the variations remains uncharacterized. Using AFM indentation on Arabidopsis suspension-cultured cells (SCCs), observed ‘stiffness’ to range from ~20 kPa to 800 kPa. Although nano-scale mechanical heterogeneities have not been widely reported for higher plants, they are seen in yeast cells in the form of raft-like structures; the microstructure of the chitin wall is readily revealed using AFM imaging of the cell surface (). The structural basis for mechanical heterogeneities is suggested to be associated with the microstructural arrangement of cellulose fibrils in the wall, including their density and degree of association/aggregation. Recently, the presence of cellulose fibril bundles that inform such structural heterogeneity was documented in onion (Allium cepa) epidermal cells (; ) and maize (Zea mays) parenchyma (). These bundles, in addition to the preferred in-plane orientation of cellulose fibrils in the wall, are responsible for anisotropic mechanical properties; that is, the mechanical response to applied deformation in the longitudinal direction (along the length of fibrils) is different from that in the transverse direction (perpendicular to the fibrils’ preferred orientation) (; ; ; ; ; ). Differences in stiffness may also arise from the heterogeneous composition of the wall, which is extensively documented (; ; ), with nearly all constituent cell wall polymers displaying at least some level of chemical heterogeneity. We do not yet have the measurement capability to provide direct links between cell wall composition and local micromechanical properties, but a step towards achieving this goal is to provide a robust methodology for mapping nano-scale mechanical properties.
Currently, the effect of microstructure-based heterogeneities on the overall mechanical properties of tissues and plant organs is not well understood. The models applicable for direct experimental analysis are generally based on continuum mechanics (; ; ) and do not incorporate consideration of the underlying microstructure. Microstructure is a term used to describe the appearance or arrangement of structural components (or phases) in a material across a broad range of length scales (from nanometres to centimetres). Although continuum models shed some light on static mechanical properties (), they are inadequate for developing the structure–property–function relationships that are necessary to describe the complex dynamic and transient mechanical properties of plant cell walls, plant cells, and tissues (). Recently, showed that the expression patterns of some genes correlates with the elasticity of the cell walls. Observations of such correlations provide key evidence of a connection between the mechanics of the wall and its biosynthesis.
In this study, we examine the mechanical properties of plant cell walls using SCCs derived from Italian ryegrass (Lolium multiflorum) starchy endosperm. The use of Lolium SCCs enables us to probe mechanical heterogeneity in a commelinoid monocot, which, in contrast to eudicots, is rich in mixed-linkage glucan (MLG) and heteroxylans (HXs), and with relatively low levels of cellulose, xyloglucan, and pectin (Table 1). We use novel microfabricated microwell arrays to entrap cells physically without the need for clamps, sticky tape, or adhesive layers that can disturb plant material and produce artefacts associated with adhesion and uncontrolled deformation. A detailed characterization of micromechanical properties using AFM nanoindentation and our advanced multiregime analysis (MRA) routine () reveals heterogeneous distribution of elastic moduli on the outer wall surface of Lolium SCCs, including ‘soft’ and ‘hard’ domains. We also quantify micromechanical heterogeneity in planta using leaf epidermal cells of Arabidopsis thaliana and L. multiflorum seedlings as a representative dicot and commelinoid monocot, respectively. The results suggest that the domain structure of mechanical heterogeneity at the micrometre level is an inherent property of plant cells and tissues, and may have significant repercussions for our understanding of cell growth and morphogenesis.
Materials and methods
Plant materials
Lolium multiflorum SCCs:
The Lolium SCCs were derived from the starchy endosperm of L. multiflorum grains 9–10 d post-anthesis (). Briefly, endosperms were placed onto solid modified White’s medium () for 7 d and the resulting calli were placed into liquid medium for bulking at 27 °C in the dark in a shaking incubator at 130rpm. After establishment, the cell culture was grown in 250ml Erlenmeyer flasks containing 150ml of modified White’s medium (); ionic strength 0.435mol l–1, osmotic pressure 1.17MPa. The cultures were maintained in the dark at 27 °C with constant shaking at 130rpm. Subculturing was conducted every 10 d by weighing 30g (fresh weight) of cells and transferring the cells to 150ml of fresh medium. The polysaccharide composition of the primary cell walls of these cells was determined to be 30–50% (1,3;1,4)-β-glucan (MLG), 20–30% HX, and 5–15% cellulose.
Arabidopsis thaliana and Lolium multiflorum plant growth conditions:
Arabidopsis thaliana seeds (Columbia-0 ecotype) were surface sterilized with 70% (v/v) ethanol and 0.01% (v/v) Tween-20 for 5min, rinsed in absolute ethanol, air-dried, and individual seeds plated on half-strength Murashige and Skoog (MS) medium (Sigma) with 2% (w/v) sucrose and 0.8% (w/v) agarose (Sigma) in Nunclon Petri dishes (35×10mm, Thermo Scientific). Plates were incubated at 4 °C for 3 d in the dark then grown for 3 weeks in a growth chamber (120 µmol m−2 s−1) under a 16h day (20 ºC)/8h night (17 ºC) regime. Lolium multiflorum seeds were imbibed in water overnight then placed on filter paper (Whatman) in a Nunclon Petri dish and grown for 7 d in natural light (12h light, 12h dark, 22 ºC).
Cell preparations
Cell preparation for AFM force curve spectroscopy (FCS) and confocal laser scanning microscopy (CLSM):
Prior to conducting analytical measurements, the Lolium SCCs were sieved using steel mesh sieves (ISO 3310 Test Sieves, Essa, Australia) to isolate small cell clusters and individual cells. First, a steel sieve with 300 µm mesh was used; the filtrate was then passed through a 90 µm mesh sieve. Two volumes of culture medium were used for sieving 1vol. of cells. To ensure maximum longevity of the cells, the sieving procedure was conducted every time before running AFM or CLSM measurements. Measurements were conducted within 2h of sieving.
Cell preparation for AFM imaging of untreated walls:
To image the surface of the cell walls, the L. multiflorum cells were washed with a 10× volume of White’s medium and then the medium was exchanged to de-ionized water. A copious amount of water (24 ºC) was used to remove all loosely bound components of the wall. After washing, the cell suspension was frozen overnight at –18 ºC. Before milling, samples were pre-cooled for 5min in liquid nitrogen. Cryo-milling was done in the Freezer/Mill 6850 SPEX (Metuchen, NJ, USA) for two cycles with 2min of cooling time in between the cycles; each milling cycle was performed at 10 strokes s–1 for 5min. The thawed suspensions of the cell wall fragments were sieved through a 90 µm mesh sieve, and the filtrate was collected. Then the filtrate was passed through a 40 µm nylon mesh cell strainer (Falcon™ Cell Strainer, Fisher Scientific), and the retentate was washed with copious amounts of water. After washing, the wet cake of the cell wall fragments with rough sizes between 40µm and 90 µm was re-suspended in 0.01% sodium azide solution in de-ionized water. The samples were kept in the fridge and used for AFM microscopy analysis within 3 d.
Treatment of the cells with the Updegraff reagent:
To elucidate the underlying microstructure of the cellulose network, L. multiflorum cells were treated using Updegraff reagent by the procedure outlined in . The reagent was prepared using 30ml of de-ionized water mixed with 120ml of glacial acetic acid and 15ml of concentrated nitric acid (both from Sigma). A suspension of cells was washed with a 10× volume of White’s medium and then the medium was exchanged to de-ionized water. Cells were then separated on a 40 µm nylon mesh cell strainer (Falcon™ Cell Strainer, Fisher Scientific) and drained under vacuum to form a moist cake. The Updegraff reagent was slowly added to the pellet; the final ratio of the reagent was 100mg mg–1 of cell cake. The suspension was then placed on a boiling water bath for 60min. Upon cooling, the cells were centrifuged and Updegraff reagent was replaced with water until pH 7 was reached. The samples were kept in the fridge and used for AFM analysis within 3 d.
Microscopic characterization of Lolium SCCs
Microscopic characterization of Lolium SCCs using CSLM:
Lolium SCCs were assessed by CLSM (Zeiss LSM 710, Germany) with a three-dye staining procedure. Calcofluor white staining solution (1g l–1 in de-ionized H2O) with pre-added Evans blue (0.5g l–1; Sigma Aldrich) was used in 1:10 dilution to visualize glucans of the cell wall. Nile red (Sigma Aldrich) was dissolved in absolute ethanol at a concentration of 200 µg ml–1 to form a 100× stock solution, and was used to visualize lipid inclusions and membranes. Fluorescein diacetate (FDA) (Sigma Aldrich) was dissolved in acetone at a concentration of 2mg ml–1 to form a 100× stock solution, and was used to visualize/assess viable protoplasts. All dyes were used without further purification. If the fraction of viable cells after sieving was >80%, the sample was accepted for further analysis.
Additionally we performed staining using Aniline Blue Fluorochrome (Biosupplies Australia Pty. Ltd, Cat. No. 100-1) and Decolourized Aniline Blue () for callose, but this showed no appreciable fluorescence, indicating low levels of callose in L. multiflorum SCC walls.
Microscopic characterization of Lolium SCCs using transmission electron microscopy (TEM):
To prepare L. multiflorum SCCs for TEM, small drops of liquid suspension containing cells were placed in freezer hats and high pressure frozen in a Leica PACT2 and then freeze substituted in a Leica AFS2 with a loading robot and polymerized in HM20 resin using UV. Once the resin blocks containing the L. multiflorum SCCs were polymerized, ultrathin sections (~80nm) were cut on a Reichert Ultracut E microtome and collected on 100 mesh copper grids. The grids containing the sections were post-stained with uranyl acetate and lead citrate. Sections were then ready for viewing on a Philips CM120 transmission electron microscope ().
Microscopic characterization of Lolium SCCs using AFM imaging:
The AFM imaging was conducted in air in intermittent contact mode using Cypher S (Asylum Research, Santa Barbara, CA, USA). A drop of the dilute suspension of either milled cell fragments or Updegraff reagent-treated cells was placed on freshly cleaved mica and dried in air; this enabled cell fragments to adhere to the substrate. Then the samples were rinsed with water to remove all loosely adhered particles, and blow-dried with nitrogen.
AFM force curve spectroscopy
FCS on Lolium SCCs:
AFM measurements were performed using a Nanowizard II (JPK Instruments, Berlin, Germany) mounted on an inverted fluorescent optical microscope. The Nanowizard II machine was equipped with the CellHesion module that enabled extension of the cantilever movement in the Z direction up to 100 µm. All measurements were performed in the closed loop mode. Indentation curves were recorded using driving speeds ranging from 200nm s–1 to 1000nm s–1 depending on the cantilever stiffness to minimize the impact of hydrodynamic drag that at all times was <5 Å in the deflection equivalent ().
The probes used were pre-manufactured AFM tips; PNP-TR Si3N4 (R <10nm) (NanoWorld AG, Germany), DNP Si3N4 (R ~20nm) (Bruker AFM Probes, CA, USA), and Mikromasch NSC/CSC Si tips (R <10nm) (NanoWorld AG). Immediately before use, probes were cleaned in oxygen plasma for 5min and then were mounted and immersed in the experimental cuvette with buffer. The spring constant (k) of the sensors ranged from 0.05N m–1 to 1.0N m–1, and was determined using the Asylum Research GetReal™ routine that utilizes a combination of the thermal noise and the Sader methods ().
A poly(dimethylsilaxone) (PDMS) microwell substrate measuring 16×23×1mm was designed to retain the individual cells in situ during the AFM indentation. The array contains 21 000 microwells, the diameter of which ranges from 55 µm to 75 µm in 5 µm steps to accommodate variability in cell size. The microwell array was fabricated by a standard soft lithography technique outlined in and . The Petri dish with a microwell array was also equipped with in- and outflow tubing connected to a syringe pump. The system allows solvent exchange and perfusion of hypertonic solutions.
In a typical experiment, the microwell substrates were positioned in the instrument and a 1ml aliquot of filtered Lolium SCCs was added. After ~60s, the substrate was examined using a low magnification objective (×4/×10) to identify microwells with trapped cells of matching size as illustrated in Fig. 1. The cantilever was then positioned in close proximity to the cell, and a set of force–indentation curves (FICs) were then recorded over the PDMS substrate. This was done to cross-check the cantilever spring constant in addition to the standard calibration performed using the thermal noise method (). It was also important to control the position of the AFM tip over the cell’s apex to ensure that the indentation is normal to the cell surface (). The optical image was also a way to control for any motion/rotation of the cell inside the well. The FICs were only recorded on the cells that were stable and seated firmly within the microwell. To avoid cell damage and minimize plastic deformation due to prolonged contact, the maximum indentations were limited to 500nm, and maximal forces to 500 nN, which is considered sufficient for plant cells (). Measurements were done in modified White’s medium filtered twice through a 0.2 µm pore size membrane filter (MillexGS MCE, Millipore, Ireland). After adding the buffer, the system was thermostated for 10–30min to ensure minimal cantilever drift. Thereafter measurements were taken on the cells. All measurements were done at 27 ºC.
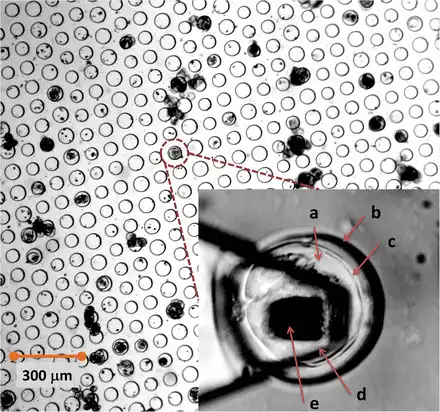
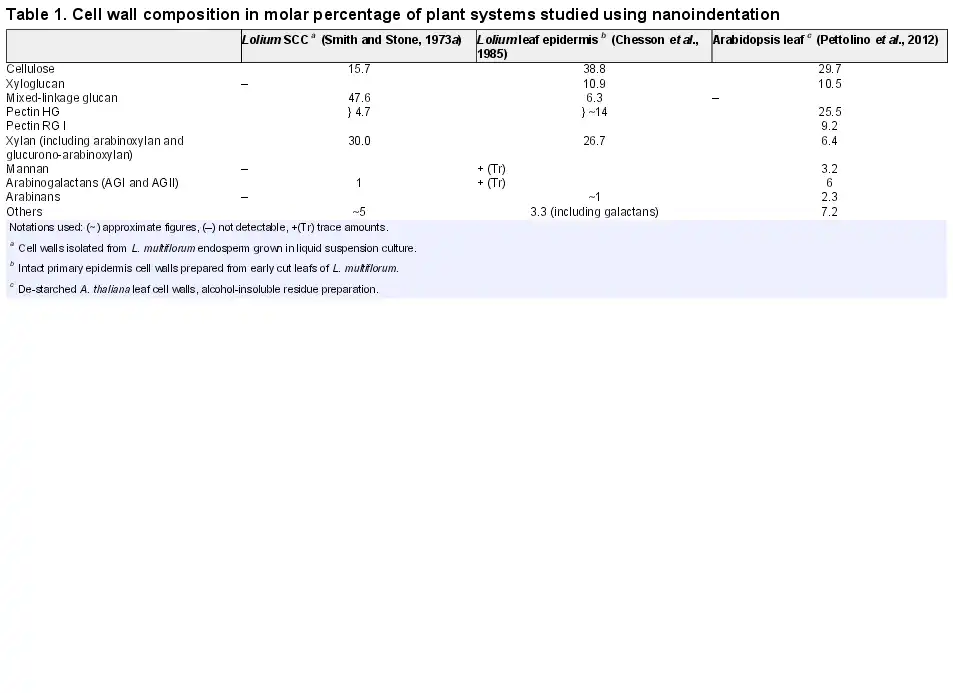
Fig. 1
A bright-field image of a microwell array showing the distribution of cells and cell/clusters that sedimented into the well. The chance occurrence of a single cell sinking into the microwell of the matching size was utilized for AFM nanoindentation measurements. In the inset, a dual illumination (bright-field and reflected light) optical micrograph of a L. multiflorum SCC (a) confined within a PDMS microwell (b). The cell wall (c) is visible as a shell surrounding the cell. An AFM cantilever (d) is positioned above the cell so that the tip (e) is positioned approximately above the apex of the cell. (This figure is available in colour at JXB online.)
For experiments with modulation of the osmotic pressure, a mannitol–trehalose solution was used to induce plasmolysis of the cells. Mannitol (Sigma Aldrich, 0.779M) and trehalose (LabChem, 1.191M) were dissolved in de-ionized water to prepare a 6.6MPa osmotic pressure solution. This solution was added using a syringe pump to elevate the osmotic pressure up to 3.5MPa. Injection speed was 50 µl min–1. The injection was carried out by a stepwise addition of 200 µl aliquots of osmolyte solution.
FCS on A. thaliana plants and L. multiflorum seedlings:
AFM measurements on plants were performed in air using a MFP-3D-BIO (Asylum Research). A Petri dish containing either Arabidopsis or Lolium plantlets was attached to the bottom of the stationary part of a microscope stage (i.e. underneath the XY AFM scanner). A leaf was then attached to the glass substrate using double-sided adhesive tape (3M™ VHB™ Tape 4920, 3M, St. Paul, MN, USA). Due to the high elastic modulus of epithelial cells, stiff cantilevers with spring constants 1 ≤k ≤10N m–1 were used [NSC 35/36 Si tips (R <10nm), Mikromasch, NanoWorld AG, Germany and FMG01 Si tips (R <10nm), NT-MDT, Zelenograd, Russia]. The force–volume two-dimensional 16×16 and 32×32 point maps were recorded with spatial density ranging from ~94nm up to ~313nm. The use of stiff tips was also required for mitigating the adhesive effect of the cuticle, which we found to be of the order of 30–50nm, which is in agreement with previous data (; ; ). During indentation measurements, the maximum load was kept between 100 nN and 1000 nN to avoid cell puncture. The force–volume map areas were always taken around the apex of the cell to minimize the surface curvature bias ().
FCS data processing:
Raw force versus distance curves were recorded as a function of the voltage output from the position-sensitive device versus the calibrated z-position of the piezotranslator. The output voltage of the position-sensitive device was converted into a deflection in metres by calculating the slope of the constant compliance line measured against a glass/Si wafer substrate in the same buffer/solvent used to record the FIC in cells. The force was calculated by multiplying deflection by the cantilever spring constant. The zero position was determined as the cross-section point of the baseline and the tangent line corresponding to the onset of the indentation curve, where cantilever deflection started to deviate from the baseline. Positive values were attributed to the indentation section of the curve. The apparent separation was calculated by subtracting cantilever deflection from the z-position of the piezotranslator. No further assumptions were made as to whether the initial parts of the response corresponded to surface forces or actual indentation. Further analysis was performed using a dedicated custom-written MATLAB code that is described in detail elsewhere ().
Results and Discussion
Interpretation of force indentation profiles for small-scale localized cell deformations using an MRA
In Fig. 2A (and Supplementary Fig. S1 at JXB online), a typical individual cell of L. multiflorum SCCs is shown under fully turgid conditions. The size of the cells ranges from 20 µm to 100 µm. The thickness of the cell wall, as indicated by the Calcofluor white staining, is between 0.5 µm and 2 µm; this result is further verified by TEM imaging (Supplementary Fig. S2). In Fig. 2B, the representative images of cell ‘ghosts’ after treatment with Updegraff reagent show that the cellulose subnetwork of the wall is continuous, and its thickness is comparable with the thickness of unmodified walls. These observations led us to a mechanical model of the SCC as a thick-walled pressurized shell.
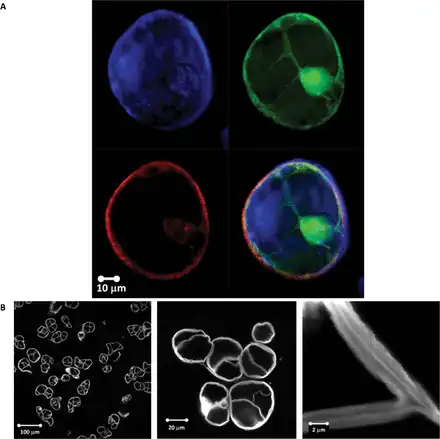
Fig. 2
(A) A typical single cell of L. multiflorum SCCs. The image was taken in modified White’s medium under fully turgid conditions. The Calcofluor white staining (upper left), FDA (upper right), and Nile red (bottom left) channels show cell wall, cell cytoplasm, and lipid membrane and lipid inclusions, respectively. The overlay of all three channels is given in the bottom right panel. (B) Representative images of the L. multiflorum SCCs after treatment with Updegraff reagent taken at different magnifications, the cell walls were stained with Calcofluor white. (This figure is available in colour at JXB online.)
The presence of the wall makes deformation of plant cells complex; a number of mechanical responses occur simultaneously and often with indistinguishable contributions towards the force–indentation profiles (for a conceptualized overview of mechanical parameters used in interpreting complex deformations, see Supplementary Fig. S3; Supplementary Table S1). All types of deformations can be broadly divided into two categories: reversible (or elastic) and non-reversible (or dissipative). The former correspond to a spring-like action; that is, the substrate deforms under the applied force, but reverts back to its original shape once the force is released. The latter category is when the deformation profiles during compression and decompression differ. Typical examples of non-reversible deformations are viscous, plastic, and viscoelastic deformations.
The elastic (reversible) deformations in plant cell systems are non-trivial to interpret. During the indentation cycle (Fig. 3A), the cell wall deforms, as does the turgid protoplast. The total indentation in this example comprises two contributions; one is from the cell wall compression, and another from its bending, as illustrated in Fig. 3B for the case of a blunt AFM tip indenting a small segment of the wall. Although both deformations are assumed to be elastic, the complexity stems from the anisotropy of the wall (properties in transverse and longitudinal directions are different), and the presence of a turgid protoplast. These factors result in a scenario where the observed deformation profile reflects different cell wall properties. The compression component is primarily associated with the transverse Young’s modulus of the wall and its transverse Poisson ratio. The bending can be characterized using an effective membrane spring constant, which is a function of the geometric curvature of the wall, turgor pressure, the longitudinal Young’s modulus, as well as a number of other parameters such as the cell wall shear modulus. (Supplementary Table S1).
(A) A schematic representation of a postulated deformation sequence during the indentation of an SCC using a blunt AFM tip. (B) A physical model of plant cell wall deformation during the nanoindentation with an AFM tip. The AFM spring (with a constant, kAFMcantilever) is balanced by the elastic response from cell deformations that depend on the material properties of the wall; the elastic membrane spring constant (kM) and effective modulus of the wall The latter is a function of the Young’s elastic modulus (E) and the Poisson ratio (v). (This figure is available in colour at JXB online.)
We interpret this complex mechanical response using an MRA that incorporates multiple mechanical models (), whereby the scenario in Fig. 3B is represented as a system of ‘springs’ or ‘mechanical resistors’ that are connected in a series ().
The MRA and the corresponding automated routine allow interpretation of multiple deformation regimes that may be convoluted within a single force–indentation test. The method also ensures that force analysis complies with assumptions and applicability limits of mechanical models.
In Fig. 4 we present typical examples of indentation curves collected from L. multiflorum SCCs plotted in linear (Fig. 4A, C) and logarithmic (Fig. 4B, D ) co-ordinates. The latter enables a better visualization of low force deformations, which otherwise may be obscured by other mechanical responses that dominate the force–distance profile ().
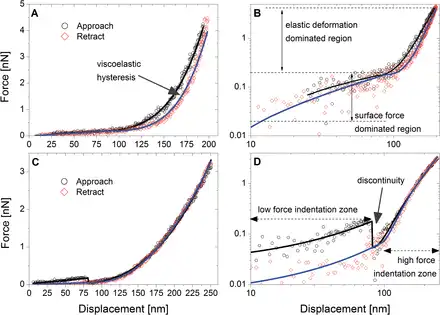
Fig. 4
Typical force–indentation curves (FICs) for L. multiflorum SCCs (A and C) and their corresponding versions in log–log scale (B and D). The majority of FICs were characterized by three resistors: a surface force, linear deformation (elastic membrane), and a thin elastic film. The elastic membrane deformation occurred concomitantly with the other resistors, generating a two-regime response. In both cases, discontinuities associated with penetration of the tip into the voids of the cell wall mesh are present. (This figure is available in colour at JXB online.)
A typical FIC is a sequence of compression and decompression tests (Fig. 3A). The compression is recorded first when the AFM cantilever tip indents the sample, while the decompression is recoded when a tip is retracted from the surface. The low force regime is dominated by a weak repulsive interaction which spans the indentation depth anywhere between 50nm and 500nm. Further indentation results in a high force region dominated by the mechanical deformation of both the cell and cell wall (Fig. 3B). Figure 4 also illustrates the magnitude of the hysteresis between the approach and retraction curves that is suggestive of contributions from both viscoelastic and plastic deformations. The moment the tip detaches from the surface, an adhesive interaction may manifest itself by producing a pull-off peak. Typically little or no adhesion is observed, although at certain locations on the cell surface multiple detachment peaks are recorded, consistent with stretching of surface-bound polymers (Supplementary Fig. S4). Due to the rarity (~1 in 20 curves) of such events, the detailed analysis was not performed; however, a qualitative evaluation suggests that the most likely mechanism of these interactions is through unspecific physical entrapment of loosely attached polysaccharides by the AFM tip during its exit from the wall. Another feature of the indentation profiles is that a significant number of curves have discontinuities, as shown in Fig. 4C and D. These discontinuities are likely to be associated with the penetration of the tip into the voids of the polysaccharide mesh of the wall.
In addition to the MRA of the force–indentation data, the dissipative parameters such as the area of hysteresis (proportional to the dissipated energy) and the plastic deformation have been recorded. The latter is measured as a distance between the approach and retract branches of the FIC at the point of zero force (for reference, see Supplementary Fig. S3B). These measures provide important insights into possible dissipative mechanisms within the system, and therefore have to be considered in interpretation of the results from MRA analysis.
The majority of data sets recorded for Lolium SCCs using an AFM tip display a behaviour characterized by a three-resistor model that describes three types of deformation outlined in Fig. 3A and B: (i) polymer steric repulsion model, n1 <1 (; ; ); (ii) elastic membrane model, n2 ~1 (; ); and (iii) thin film elastic model, n3 ≥2 (; ). The latter is an extension of a well-established Hertzian–Sneddon model (; ) that accounts for a finite thickness of the deformed material, as is the case with plant cell walls (see Supplementary Model S1 for details of each deformation model and the equations used).
First, the low force regime with n <1 is attributed to the interaction of the tip with loosely adsorbed or protruding polymers, which are evident from TEM images (Supplementary Fig. S2). Such dependency is consistent with a mechanism whereby ‘grafting’ density of polymer chains changes with separation. This can be realized either for a polydisperse brush where density increases as the tip ventures deeper into the polymer layer, and starts to probe shorter chains, or through the lateral displacement of polymer molecules originating from the conical shape of an AFM tip that effectively wedges in between the chains (; ; ). The presence of such a loose polymer layer is consistent with the fact that walls of L. multiflorum SCCs have a relatively low content of cellulose (<15%/dry weight), but are rich in MLG and arabinoxylan (Table 1).
The second regime with 0.9 <n <1.4 is identified as a combination of two resistors, n ~1.5 and n ~1; note, if these occur concomitantly, an intermediate value of exponent is observed. A power law response with n ~1.5 is predicted for a Hertzian contact deformation exerted by a spherical punch, which is satisfied for small deformation when δ <2×RTip. A linear response (n ~1) is predicted by theories for deflection of membranes and localized (central) deformations of spherical shells, provided that the relative deformation which is easily satisfied in the small deformation AFM experiments. The values of the spring constant in the MRA model do, however, depend on the scenario that is at play (; ). For small deformations of a pressurized spherical shell, KM is estimated to be 50N m–1 when Pturgor=3 MPa (). However, the measured values of the effective membrane spring constant are found in the range between 0.01 and 2, which is consistent with the case of an unpressurized spherical shell in the bending-dominated regime () or, alternatively, with the indentation of a flat membrane (). In the latter case, one has to assume a membrane cut-off area with radius smaller than where h is cell wall thickness. We always observe this regime to precede the transverse elastic deformation of the wall, which suggests that the characteristic bending length is limited to very narrow areas on the cell surface (lB <<h) (; ; ). Such a scenario is consistent with the tip indenting the areas in between polysaccharide fibres, and where the cellulose fibre mesh would act as a boundary for local deformations due to its intrinsic stiffness.
The third deformation regime observed is consistent with the indentation of the cell wall in the transverse direction, for which 1.5 <n <4. The lower boundary (n=1.5) corresponds to the Hertzian deformation exerted by a spherical indenter, which is consistent for an AFM tip at small indentations that is truncated as a cone or pyramid. For larger indentations, a conventional Sneddon’s solution for a cone predicts n=2. For a majority of FIC curves, however, larger values of the exponent are observed that we attribute to a non-linear deformation of the thin wall, where deformation is comparable with wall thickness (δ ┴ h).
We assume that for n >4 the system is at the limit of the linear (or quasi-linear) elastic approximation; thus, these regions were excluded from the analysis.
Mechanical mapping of individual cells of Lolium SCCs
In order to map the mechanical properties of the Lolium SCC walls reliably, numerous 1D tracks are recorded with 2–3 curves per point and ~100–300 curves per track. By doing so, the distance between spatial points is less than ~30nm, which enables probing of whether the change in the modulus is a continuous function of the position or random. Figure 5 shows typical traces of the effective Young’s modulus as a function of the position on the cell surface recorded on two different cells along a 2.6 µm path. The observed variations in the elastic parameters greatly exceed the accuracy of the measurements at each point, and the measured distribution of heterogeneity is consistent with the hypothesis of micromechanical domains. As shown previously (), the high level of accuracy is also ensured by extracting elastic parameters from both approach and retraction parts of the indentation curve, from which the MRA routine isolates Hertzian components from other types of force response
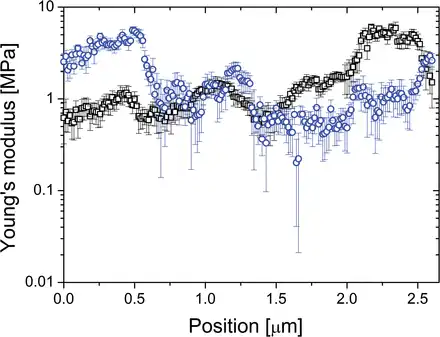
Fig. 5
Typical traces of the effective Young’s modulus as a function of the position on the cell surface recorded on two different Lolium SCCs (rectangles and circles) along a 2.6 µm path. The data are taken along a straight arc over the cell’s surface (~1/20 of the cell radius). Two repetitions per point were performed; the symbols represent the average of four values (two repetitions, each being characterized by two values of the modulus calculated using approach and retract branches of the indentation curves); the bars represent deviations. The track was recorded within the time interval of 15min. (This figure is available in colour at JXB online.)
To illustrate further the presence of mechanical heterogeneities, we have collected 2D force volume plots over 5×5 µm areas. Figure 6 presents a typical map of the effective Young’s modulus and membrane spring constant. The maps allow measurement of the variation in elastic modulus (Fig. 6A) which is found to span at least three orders of magnitude, between 0.01MPa and 10MPa. The median and mean are 120 kPa and 700 kPa, respectively, which are similar to those previously reported for AFM measurements on single plant cell systems (; ). The maps of the membrane spring constant, kM, presented in Fig. 6B reveal similar variations in the magnitude and the spatial distribution. The membrane spring constant is related to the longitudinal elastic modulus of the wall in a localized area around the AFM tip, hence both maps provide complementary data characterizing mechanical heterogeneity of the anisotropic wall.
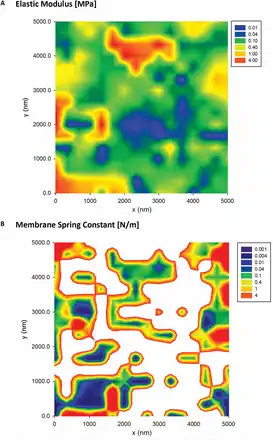
Fig. 6
2D force–volume plots of the elastic modulus (A) and the membrane spring constant (B) of Lolium SCCs. All plots were recorded over a 5×5 µm area. The white areas on the spring constant map (B) correspond to the areas where determining such a type of deformation was not experimentally possible. (This figure is available in colour at JXB online.)
The key finding is that the spatial distribution of heterogeneities of both the Young’s modulus and membrane spring constant has a clear domain structure, covering length scales from several hundreds of nanometres up to a few micrometres. This is because the presence of large-scale domains of mechanical heterogeneities, with the Young’s modulus varying spatially by at least two orders of magnitude, is suggestive of heterogeneity in the microstructure of the deposited cell wall polysaccharides. Figure 7 shows a typical AFM image of the surface of a cryo-milled Lolium SCC wall fragment washed with de-ionized water, which reveals an apparently homogenous and amorphous surface. We note that the deposition of cell wall fragments on the mica surface is random and hence some of the surfaces are representative of the outer surface of the wall and others of the inner surface of the wall, which is in contact with the plasma membrane. From imaging alone we are unable to distinguish between these surfaces. These results suggest that the surfaces of Lolium SCCs are probably covered by loosely associated non-cellulosic polysaccharides, masking any underlying heterogeneity.
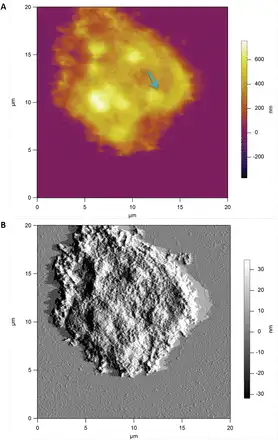
Fig. 7
Height (A) and amplitude (B) AFM images of a wall fragment of Lolium SCCs obtained via cryo-milling. The sample was deposited on mica and imaged in the intermittent contact mode in air. The surface of this wall fragment is dominated by the amorphous layer of polysaccharide. Some features in the form of ‘blobs’ with above average height (indicated by an arrow) may be indicative of underlying microstructure. (This figure is available in colour at JXB online.)
To obtain more detailed representation of the underlying cellulose network, we have treated SCCs with Updegraff reagent. The results presented in Fig. 8 show a heterogeneous distribution of the acid-resistant fragments of cellulose fibrils. The key features of this microstructure are that heterogeneity covers a number of length scales, from tens of micrometres to a few hundred nanometres, as well as containing domains with varying density and orientation of cellulose fibrils. The smallest length scale of such microstructural features corresponds well to that found on the mechanical maps, as can be gauged by comparing images in Figs 8C and 6 (5×5 µm area), and Fig. 8D with a 1D track in Fig. 5 (2.6 µm).
Fig. 8
An AFM image of the surface of a Lolium SCC ‘ghost’ after treatment with Updegraff reagent showing the heterogeneous deposition of cellulose in the wall. Images are taken with increasing magnification, as indicated by boxed areas. Arrows show some representative fragments of acid-resistant cellulose fibrils. The longer fibrils appear as if they are connecting the tufts of tightly packed shorter fibrils. (This figure is available in colour at JXB online.)
The imaging results (Fig. 8A, B) are also suggestive of the presence of even larger scale heterogeneities that may span a few tens of micrometres. In order to test this hypothesis, we performed indentation experiments to generate 1D tracks over a larger area by recording along a spiral trajectory. Figure 9 shows a typical result obtained using a fully turgid cell. The size of the circles in Fig. 9A is proportional to the average Young’s modulus obtained using MRA at a specific point, suggesting the presence of well differentiated soft and stiff areas in the wall. These are shown in more detail in Fig. 9B, where the modulus data are plotted versus the curvilinear position, with x=0 representing the origin of Fig. 9A. One can see a clear minimum in modulus between 100 µm and 150 µm. The location of this minimum also corresponds to a minimum in the elastic membrane spring constant kM (Fig. 9C) and a maximum in plastic deformation (Fig. 9D). We note that for the majority of samples tested, no correlation between plastic deformation and the elastic modulus is observed, which indicates that the observed correlation in a specific location is indeed indicative of an underlying physical mechanism rather than an artefact of analysis. The results clearly show the presence of distinct ‘soft’ regions of the cell wall.
Fig. 9
Comparison of mechanical properties evaluated for 1D tracks calculated using different models. (A) Spiral-like trajectory of indentation onto the surface of a Lolium SCC; the size of the symbols is proportional to the average MRA elastic modulus at the specific point. (B) Average Young’s modulus obtained along the curvilinear position; the origin represents the origin of plot (A). (C) The elastic membrane spring constant. (D) Correlation between MRA modulus and plastic deformation.
The findings reported here are in a good agreement with recent results by , where reticulated deposition of cellulose fibrils as well as heterogeneous spatial distribution of soft and rigid matrix polymers (i.e. pectins and cellulose) in the walls of onion epidermis walls have been extensively documented. We note that measurements by are performed on a recently deposited layer of the wall; that is, the images are taken of the inner layers adjacent to the plasma membrane. In that respect, such a pattern of deposition may share similarity with the outer regions of the Lolium SCC walls probed in our experiments. It is possible to suggest that in the walls of Lolium SCCs formed without restrictions of neighbouring cells, the bundled and reticulated structure of cellulose deposits may persist through to the outer layers. The heterogeneous deposition of the wall, as well as some irregular deposits in the outer surface of the wall, are also reported in the work by , who investigated callus-derived single cells of A. thaliana.
It is therefore possible to conclude that observed domains of mechanical heterogeneity do correspond to the irregular and bundled deposition of cellulose and to that of the corresponding subnetwork of hemicelluloses and/or pectins.
In planta mechanical mapping of leaf epidermal cells of A. thaliana and L. multiflorum
In order to test the nano-scale distribution of the elastic modulus on mature cell walls within a tissue/organ, we tested abaxial and adaxial epidermal pavement cells of A. thaliana and L. multiflorum leaves. Figure 10A shows a typical AFM height image of the abaxial surface of an A. thaliana epidermal pavement cell. The mechanical tests were performed in the 2D force volume regime (32×32 pixels) across a 25 µm2 area. The map of the Young’s modulus (Fig. 10B) shows spatial variability qualitatively similar to that observed in L. multiflorum SCCs. The variation in the modulus for the epidermal cells (both adaxial and abaxial) is markedly smaller than for Lolium SCCs; we suspect this reflects how the more mature epidermal cells have a denser distribution of polysaccharides. Also since the walls have a polylamellate structure of cellulose deposition, we expect the outer lamella to bear less resemblance to the meso-scale structure of the freshly deposited lamellae ().
Fig. 10
AFM height image (A) of the abaxial epidermal layer of an Arabidopsis thaliana leaf epidermal cell. The apex area on one of the cells (boxed area) was also tested using the 2D force–volume mapping technique. The mechanics data are well described by the Hertzian model, with maps of the Young’s modulus (B) showing strong evidence for the presence of heterogeneities. Pixel size 156nm, indenter radius 20nm. (This figure is available in colour at JXB online.)
The MRA analysis of 2D force–volume maps from indentation of L. multiflorum leaf epidermal cells (abaxial) show a marked difference compared with A. thaliana. Most of the data sets are well described by a single elastic membrane resistor, as shown in Fig. 11. This feature is easily detected in the histogram analysis of the power law exponents, which led us to run the MRA with membrane and Hertzian resistors; the latter in anticipation of a small portion of the data with n >1. Interestingly, areas of high KM correspond well to areas of low plasticity, and vice versa. The fact that two parameters estimated through independent methods agree with each other suggests that the soft areas are not only less stiff but also display non-linear yielding behaviour characteristic of viscoplastic deformation.
Fig. 11
AFM height image (A) of the abaxial epidermal layer of a L. multiflorum leaf epidermal cell. The area on one of the cells (boxed area) was also tested using the 2D force–volume mapping technique. The mechanics data are well described by the elastic membrane bending model (B) that shows the presence of heterogeneities. The map of the plastic deformation (C) recorded over the same area showed significant correlation with the elastic spring constant. Pixel size 156nm, indenter radius 20nm. (This figure is available in colour at JXB online.)
We interpret the experimental findings on the three systems studied based on the cell wall composition of each cell type as summarized in Table 1. The Lolium leaf epidermis has the highest cellulose content, which coincides with the minimal transverse deformation of its walls, and the force response is dominated by the membrane-like deformation, namely the ‘thin-walled balloon’ model. It should also be noted that the xyloglucan content that may mediate the links between cellulose fibrils is similar in Arabidopsis and Lolium leaves, and hence one has to be careful with attributing differences in the mechanical response to the difference in the level of xyloglucan-mediated tethers or to the effect of xyloglucan on cellulose–cellulose interfibre links (). This is further supported by the fact that Lolium SCCs have only a very low level of xyloglucans, if any, yet the wall is characterized by an appreciable elastic modulus in the order of megapascals, which is higher than that of A. thaliana leaf epidermis cells. In part, this can be attributed to the postulated layered structure of the A. thaliana walls, with the outer layer being softer than the inner layer (; ). Another possible explanation may be the lubricating effect of pectin on cellulose–cellulose interfibre junctions to effect lower resistance of the wall to deformation.
The substantial presence of MLG and pectin in Lolium SCCs and A. thaliana epidermal walls, respectively (Table 1), results in softer walls, compression of which can be measured even at small indentations. This is in contrast to the L. multiflorum epidermis cells that exhibit undetectable cell wall compression, with the mechanical response being dominated by the wall deflection. We note that the average values of the membrane spring constants, kM, for Lolium SCCs and L. multiflorum leaf epidermis are of the same order of magnitude, which indicates that elastic properties in the longitudinal direction (in the plane of the wall) are not too dissimilar. It is possible, therefore, to deduce that the absence of the wall compression modes in Lolium leaf does not stem from the fact that its wall is ‘softer’ in the longitudinal direction, and the apparent absence of wall compression is likely to be associated with the lower levels of MLGs and pectins. This conclusion is consistent with the force curves for Lolium SCCs and A. thaliana leaf epidermis cells which feature well-pronounced deformations associated with a fluid-like layer which precedes the elastic deformation of the wall, and which is consistent with a layer of gel-like polysaccharides such as MLG or pectin.
Based on the different composition of the walls in the plant systems studied, it is also possible to propose a hypothesis about the role of xylans in the mechanics of the wall, as both Lolium systems feature similar and rather substantial amounts of xylan (~30 molar %). One possible mechanism is via poroelastic control of water permeability that creates a condition where fluid resistance results in the elastic-like response. Such pressurization may also contribute to the non-linear wall deformation that was observed for Lolium SCCs, whereby the effective elastic modulus increases with indentation. The role of xylans can also be inferred from the observed values of the plastic deformation characteristic for both Lolium systems. Such irreversible deformation would be consistent with the viscous drainage of water-solubilized xylan during poroelastic deformation (, ; ). We also note that although the values of maximum indentations used in this study are of the order of a few micrometres, they are still insufficient to induce a buckling transition within the area around the indenter which also could manifest itself as an irreversible deformation (). The buckling zone is expected for indentations of the order of which for a typical cell with the radius of 30 µm and wall thickness of 3 µm are of the order of 8 µm ().
Non-turgid cells of Lolium SCCs
In Fig. 12A and B, representative examples of plasmolysed (non-turgid) cells are presented. One can see that plasmolysis at its extreme causes either partial (Fig. 12A) or complete detachment of the protoplast (Fig. 12B). This serves as an important validation that, at least at the highest value of the differential osmotic pressure, the plasma membrane is not in contact with the wall, and hence the mechanical properties of the wall would be close to those of an unpressurized elastic shell. We note that even under turgor, the shape of the cells often deviates from perfectly spherical (see Fig. 2A). This non-spherical shape of the majority of cells suggests that the magnitude of the turgor pressure is not sufficient to put the wall under a significant level of pre-stress. In other words, the SCCs deposit a wall that is tougher than required to counter-balance the turgor pressure. Hence results for plasmolysed SCCs should be treated with a degree of caution, as they may not fully reflect the behaviour of cells in tissues.
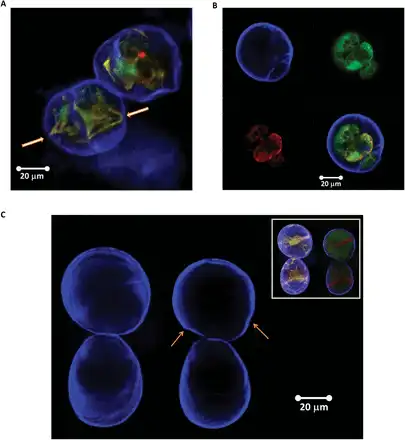
Fig. 12
Typical examples of Lolium SCCs after plasmolysis (mannitol–trehalose solution) in which either partial detachment (arrows show residual attachment points) (A) or full detachment (B) of the protoplast from the cell wall was observed. In (B), staining with Calcofluor white (upper left), FDA (upper right), and Nile red (bottom left) shows cell wall, cell cytoplasm, and lipid membrane and lipid inclusions, respectively. The overlay of all three channels is given in the bottom right panel. (C) Lolium SCC walls before and after plasmolysis. The inset shows additional Nile red and FDA staining to visualize changes in the cytoplasm following the osmotic treatment. The arrows point to the areas of buckling and regions of irregular deformation (both in the top cell). Deformation of the bottom cell is mostly homogenous and can be used as a reference. (This figure is available in colour at JXB online.)
Figure 12C shows the same cells before and after plasmolysis. One can clearly see patterns where deformations around the circumference of the cells are non-homogeneous. Some regions (indicated by the arrows on the figure) appear to have undergone buckling transition, which provides indirect, although visually clear evidence for the presence of mechanical heterogeneities. The analysis by shows that mechanical and geometrical heterogeneities of the shells greatly reduce the threshold of buckling, making buckled shapes less sensitive to imperfections. This predicts, in a rather counter-intuitive fashion, that introducing heterogeneity could make the buckling transition more reliable than for a uniform shell.
The 1D track method was used to map the mechanical properties of Lolium SCCs before and after exposure to high osmotic pressure solutions. Figure 13 presents an example where selected mechanical properties are recorded along a 1D track over an ~30 µm arc on the cell surface, thus covering a distance comparable with the cell’s diameter. One can see two microscopic domains, a stiffer one (between ~20 µm and 30 µm) and a softer one (between 0 µm and ~20 µm). Upon changes in osmotic pressure, the elastic modulus of the softer domain did not exhibit much change, while the opposite is observed for the stiffer domain, where the elastic modulus dropped. These results suggest that these two locations differ in the level of pre-stress they exhibit: the higher modulus should be attributed to the areas where wall properties are influenced by strain stiffening. Upon a reduction in differential pressure and subsequent relaxation, the changes in modulus correspond to the reduction in strain stiffening. This interpretation is also supported by the fact that the non-linear elastic modulus (which effectively probes stiffening properties) shows a much more modest reduction compared with the Hertzian modulus.
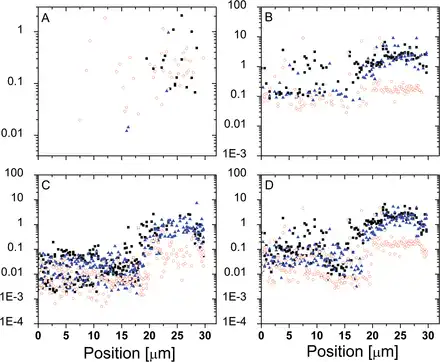
Fig. 13
Mechanical properties recorded across a Lolium SCC before and after plasmolysis. The filled symbols (squares and triangles) correspond to the two consecutive tracks and illustrate the reproducibility of the measurement and analysis. The open symbols correspond to the data recorded after plasmolysis along the very same trajectory. (A) Membrane spring constant (N m–1). (B) Hertzian Young’s modulus (MPa). (C) Thin film elastic modulus (MPa). (D) Average elastic modulus (MPa). (This figure is available in colour at JXB online.)
The membrane spring constant showed little change in response to variation in osmotic pressure, which supports the hypothesis that this quantity is associated with the localized deformation of the domains of gel-like cell wall material confined between cellulosic scaffolds. Indeed, the bending deformations are limited by the longitudinal extensional elastic modulus of the wall (; ; ), which, due to the predominantly longitudinal orientation of cellulose fibrils, is expected to be much higher than the transverse one (; ).
In comparison with other nanoindentation studies on plant cells, where no effect of osmotic pressure is found, we emphasize that these were restricted to much smaller deformations than in our current study. This includes the study of , where the amplitude of applied deformations was negligible compared with cell size and much smaller than wall thickness. Similarly, measured mechanical properties on live Arabidopsis roots before and after plasmolysis and found no statistically significant effect of turgor pressure. This was attributed to the small radius of the tip used to probe cell elasticity. Our results are, however, in agreement with more recent studies in which larger indentations were employed (; ). It appears that in order to probe the effect of turgor pressure, one needs to apply deformations comparable with wall thickness (i.e. δ~hwall). This conclusion is based on knowledge from the mechanics of elastic shells that the component of stress in the transverse direction is changing from –PT at the boundary with the turgid membrane to that of the atmospheric pressure in the outer layers (). Meanwhile, the longitudinal components of the stress are only weakly changing with the position along the thickness of the wall, and hence can be safely assumed as constant. This implies that the force response towards small indentations in the transverse direction is identical irrespective of cell turgidity.
Concluding remarks: implications of heterogeneous mechanical properties on plant cell growth
Mechanical forces in cell walls are a key feedback control mechanism in plant growth, morphogenesis, and development (; ; ; ; ). In addition to a direct effect on signalling, mechanical stress is a part of the intercellular communication mechanism that determines a cell’s response to environmental stresses and interactions with pathogens (). However, our understanding of the effect of mechanical forces on biological signalling is limited due to the inherent complexity and anisotropy of the plant cell wall microstructure, as well as its heterogeneous composition and distribution of polysaccharides (; ; ; ; ; ; ; ). Our results strongly suggest that variations in microstructure and composition have a major influence on mechanics, with values of Young’s modulus of the cell wall spanning several orders of magnitude. Our results contribute to the existing evidence for the heterogeneous distribution and variability of plant cell mechanical properties (; ), and for the first time provide mapping data and size characterization of such heterogeneities.
The biological implications of nano-scale mechanical heterogeneities remain unknown; we hypothesize that they may serve as an important prerequisite for development of mechanical zones and patterns which have a strong association with plant cell expansion; so-called reaction–diffusion patterns (). In addition, the domain structure of mechanical properties may also be related to the distribution and clustering of microtubules (). It is possible that the non-homogeneous distribution of microtubules impacts the wall mechanics via non-uniform deposition of cellulose. However, the opposite is also possible, whereby mechanical feedback favours certain clustering of cytoskeletal elements in a way analogous to how mechanical heterogeneity induces fragmentation of actin filaments in animal cells ().
In conclusion, we hypothesize that multi-scale and microstructural factors may act alongside the variability in wall polymer composition, degree of cross-linking, and molecular architecture of constituent polysaccharides to affect the mechanical properties of the cell walls (; ; ; ). This work demonstrates that the presence of inherent heterogeneities in primary plant cell walls contributes to their mechanical properties. Future developments should be aimed at correlating the different inherent levels of microheterogeneities, derived from mechanical, compositional, and structural properties, into a model of primary plant cell walls that explicitly reflects its function as a ‘mechano-sensor’ regulating plant form and function.
Supplementary data
Supplementary data are available at JXB online.
Figure S1. Typical examples of Lolium SCCs imaged in modified White’s medium under fully turgid conditions.
Figure S2. A representative TEM image of the Lolium SCC wall.
Figure S3. Schematic examples of force–deformation curves for different types of mechanical deformations, such as elastic, plastic, viscoelastic, and viscous.
Figure S4. Typical examples of FICs observed on Lolium SCCs.
Table S1. A conceptualized summary of mechanical parameters expected to be involved in mechanical responses of the cell wall during AFM nanoindentation.
Model S1. Mechanical resistor models.
Acknowledgements
This work was performed in part at the Queensland node of the Australian National Fabrication Facility (ANNF-Q), a company established under the National Collaborative Research Infrastructure Strategy to provide nano- and microfabrication facilities for Australia’s researchers. The authors thank Chee Meng (Tony) Chin (UM) for supply of the Lolium SCCs and polysaccharide analysis; Dr Kim L. Johnson (UM) for A. thaliana and L. multiflorum plant growth; Dr Sarah M. Wilson (UM) for TEM imaging of L. multiflorum SCCs; Dr Allison Van De Meene (UM) for SEM imaging of L. multiflorum SCCs; Dr Patricia Lopez-Sanchez (UQ) for protocols on cell viability assay and cell sieving; Dr Wei Zeng (UM) for preparation of plant materials; and Dr Sushil Dhital (UQ) for cryo-milling of SCC suspensions. HC and GY acknowledge Professor Justin Cooper-White (AIBN, UQ) for his support of this project. Professor Herman Höfte (INRA, France) and Professor Daniel Cosgrove (Penn State, USA) are gratefully acknowledged for many helpful discussions. MSD, AB, and MJG wish to acknowledge the support of the Australian Research Council for funding to the ARC Centre of Excellence in Plant Cell Walls (CE110001007).
References
- Altartouri B, Geitmann A. 2015. Understanding plant cell morphogenesis requires real-time monitoring of cell wall polymers. Current Opinion in Plant Biology 23, 76–82.
- Arnoldi M, Fritz M, Bauerlein E, Radmacher M, Sackmann E, Boulbitch A. 2000. Bacterial turgor pressure can be measured by atomic force microscopy. Physical Review E 62, 1034–1044.
- Audoly B, Boudaoud A. 2008. Buckling of a stiff film bound to a compliant substrate. Part I: formulation, linear stability of cylindrical patterns, secondary bifurcations. Journal of the Mechanics and Physics of Solids 56, 2401–2421.
- Balastre M, Li F, Schorr P, Yang JC, Mays JW, Tirrell MV. 2002. A study of polyelectrolyte brushes formed from adsorption of amphiphilic diblock copolymers using the surface forces apparatus. Macromolecules 35, 9480–9486.
- Beauzamy L, Derr J, Boudaoud A. 2015. Quantifying hydrostatic pressure in plant cells by using indentation with an atomic force microscope. Biophysical Journal 108, 2448–2456.
- Begley MR, Mackin TJ 2004. Spherical indentation of freestanding circular thin films in the membrane regime. Journal of the Mechanics and Physics of Solids 52, 2005–2023.
- Bonilla MR, Lopez-Sanchez P, Gidley MJ, Stokes JR. 2016. Micromechanical model of biphasic biomaterials with internal adhesion: application to nanocellulose hydrogel composites. Acta Biomaterialia 29, 149–160.
- Bonilla MR, Stokes JR, Gidley MJ., Yakubov GE. 2015. Interpreting atomic force microscopy nanoindentation of hierarchical biological materials using multi-regime analysis. Soft Matter 11, 1281–1292.
- Boudaoud A. 2010. An introduction to the mechanics of morphogenesis for plant biologists. Trends in Plant Science 15, 353–360.
- Boulbitch A. 2000. Deformation of the envelope of a spherical Gram-negative bacterium during the atomic force microscopic measurements. Journal of Electron Microscopy 49, 459–462.
- Boulbitch AA. 1998. Deflection of a cell membrane under application of a local force. Physical Review E 57, 2123–2128.
- Boulbitch A, Quinn B, Pink D. 2000. Elasticity of the rod-shaped Gram-negative eubacteria. Physical Review Letters 85, 5246–5249.
- Braybrook SA, Peaucelle A. 2013. Mechano-chemical aspects of organ formation in Arabidopsis thaliana: the relationship between auxin and pectin. PLoS One 8, e57813.
- Bremmell KE, Britcher L, Griesser HJ. 2013. Steric and electrostatic surface forces on sulfonated PEG graft surfaces with selective albumin adsorption. Colloids and Surfaces B: Biointerfaces 106, 102–108.
- Burton RA, Gidley MJ, Fincher GB. 2010. Heterogeneity in the chemistry, structure and function of plant cell walls. Nature Chemical Biology 6, 724–732.
- Chen H, Li J, Zhang H, Li M, Rosengarten G, Nordon RE. 2011. Microwell perfusion array for high-throughput, long-term imaging of clonal growth. Biomicrofluidics 5, 044117.
- Chesson A, Gordon AH, Lomax JA. 1985. Methylation analysis of mesophyll, epidermis, and fibre cell-walls isolated from the leaves of perennial and italian ryegrass. Carbohydrate Research 141, 137–147.
- Cornuault V, Manfield IW, Ralet M-C, Knox JP. 2014. Epitope detection chromatography: a method to dissect the structural heterogeneity and inter-connections of plant cell-wall matrix glycans. The Plant Journal 78, 715–722.
- Cosgrove DJ. 2000. Expansive growth of plant cell walls. Plant Physiology and Biochemistry 38, 109–124.
- Cosgrove DJ. 2005. Growth of the plant cell wall. Nature Reviews Molecular Cell Biology 6, 850–861.
- Cosgrove DJ, Jarvis MC. 2012. Comparative structure and biomechanics of plant primary and secondary cell walls. Frontiers in Plant Science 3, 204.
- Cuellar JL, Llarena I, Moya SE, Donath E. 2013. Indentation of highly charged pspm brushes measured by force spectroscopy: application of a compressible fluid model. Macromolecules 46, 2323–2330.
- De la Cruz EM, Martiel J-L, Blanchoin L. 2015. Mechanical heterogeneity favors fragmentation of strained actin filaments. Biophysical Journal 108, 2270–2281.
- Digiuni S, Berne-Dedieu A, Martinez-Torres C, Szecsi J, Bendahmane M, Arneodo A, Argou F. 2015. Single cell wall nonlinear mechanics revealed by a multiscale analysis of AFM force–indentation curves. Biophysical Journal 108, 2235–2248.
- Dimitriadis EK, Horkay F, Maresca J, Kachar B, Chadwick RS. 2002. Determination of elastic moduli of thin layers of soft material using the atomic force microscope. Biophysical Journal 82, 2798–2810.
- Ding S-Y, Zhao S, Zeng Y. 2014. Size, shape, and arrangement of native cellulose fibrils in maize cell walls. Cellulose 21, 863–871.
- Doblin MS, Johnson KL, Humphries J, Newbigin EJ, Bacic A. 2014. Are designer plant cell walls a realistic aspiration or will the plasticity of the plant’s metabolism win out? Current Opinion in Biotechnology 26, 108–114.
- Dominguez E, Cuartero J, Heredia A. 2011. An overview on plant cuticle biomechanics. Plant Science 181, 77–84.
- Dufrene YF, Boonaert CJP, van der Mei HC, Busscher HJ, Rouxhet PG. 2001. Probing molecular interactions and mechanical properties of microbial cell surfaces by atomic force microscopy. Ultramicroscopy 86, 113–120.
- Dumais J. 2007. Can mechanics control pattern formation in plants? Current Opinion in Plant Biology 10, 58–62.
- Dyson RJ, Band LR, Jensen OE. 2012. A model of crosslink kinetics in the expanding plant cell wall: yield stress and enzyme action. Journal of Theoretical Biology 307, 125–136.
- Fernandes AN, Chen X, Scotchford CA, Walker J, Wells DM, Roberts CJ, Everitt NM. 2012. Mechanical properties of epidermal cells of whole living roots of Arabidopsis thaliana: an atomic force microscopy study. Physical Review E 85, 021916.
- Gavara N, Chadwick RS. 2012. Determination of the elastic moduli of thin samples and adherent cells using conical atomic force microscope tips. Nature Nanotechnology 7, 733–736.
- Gibson LJ. 2005. Biomechanics of cellular solids. Journal of Biomechanics 38, 377–399.
- Gutierrez R, Lindeboom JJ, Paredez AR, Emons AMC, Ehrhardt DW. 2009. Arabidopsis cortical microtubules position cellulose synthase delivery to the plasma membrane and interact with cellulose synthase trafficking compartments. Nature Cell Biology 11, 797–806.
- Hertz H. 1882. Ueber die Berührung fester elastischer Körper Journal für die reine und angewandte Mathematik 92, 156–171.
- Higgins MJ, Proksch R, Sader JE, Polcik M, Mc Endoo S, Cleveland JP, Jarvis SP. 2006. Noninvasive determination of optical lever sensitivity in atomic force microscopy. Review of Scientific Instruments 77, 013701.
- Huang R, Becker A, Jones I. 2012. Modelling cell wall growth using a fibre-reinforced hyperelastic–viscoplastic constitutive law. Journal of the Mechanics and Physics of Solids 60, 750–783.
- Iyer S, Gaikwad RM, Subba-Rao V, Woodworth CD, Sokolov I. 2009. Atomic force microscopy detects differences in the surface brush of normal and cancerous cells. Nature Nanotechnology 4, 389–393.
- Kafle K, Xi X, Lee C, Tittmann B, Cosgrove D, Park Y, Kim S. 2014. Cellulose microfibril orientation in onion (Allium cepa L.) epidermis studied by atomic force microscopy (AFM) and vibrational sum frequency generation (SFG) spectroscopy. Cellulose 21, 1075–1086.
- Kierzkowski D, Nakayama N, Routier-Kierzkowska A-L, Weber A, Bayer E, Schorderet M, Reinhardt D, Kuhlemeier C, Smith RS. 2012. Elastic domains regulate growth and organogenesis in the plant shoot apical meristem. Science 335, 1096–1099.
- Kosma DK, Bourdenx B, Bernard A, Parsons EP, Lue S, Joubes J, Jenks MA. 2009. The impact of water deficiency on leaf cuticle lipids of Arabidopsis. Plant Physiology 151, 1918–1929.
- Kurdyukov S, Faust A, Nawrath C, et al.. 2006. The epidermis-specific extracellular BODYGUARD controls cuticle development and morphogenesis in Arabidopsis. The Plant Cell 18, 321–339.
- Landau LD, Lifshits EM. 1959. Theory of elasticity . London; Reading, MA: Pergamon Press; Addison-Wesley Pub. Co.
- Lee KJD, Cornuault V, Manfield IW, Ralet M-C, Knox JP. 2013. Multi-scale spatial heterogeneity of pectic rhamnogalacturonan I (RG-I) structural features in tobacco seed endosperm cell walls. The Plant Journal 75, 1018–1027.
- Lee KJD, Marcus SE, Knox JP. 2011. Cell wall biology: perspectives from cell wall imaging. Molecular Plant 4, 212–219.
- Li XD, Bhushan B. 2002. A review of nanoindentation continuous stiffness measurement technique and its applications. Materials Characterization 48, 11–36.
- Lopez-Sanchez P, Cersosimo J, Wang D, Flanagan B, Stokes JR, Gidley MJ. 2015. Poroelastic mechanical effects of hemicelluloses on cellulosic hydrogels under compression. PLoS One 10, e0122132.
- Lopez-Sanchez P, Rincon M, Wang D, Brulhart S, Stokes JR, Gidley MJ. 2014. Micromechanics and poroelasticity of hydrated cellulose networks. Biomacromolecules 15, 2274–2284.
- Lucas M, Kenobi K, von Wangenheim D, et al.. 2013. Lateral root morphogenesis is dependent on the mechanical properties of the overlaying tissues. Proceedings of the National Academy of Sciences, USA 110, 5229–5234.
- McCann MC, Chen L, Roberts K, Kemsley EK, Sene C, Carpita NC, Stacey NJ, Wilson RH. 1997. Infrared microspectroscopy: sampling heterogeneity in plant cell wall composition and architecture. Physiologia Plantarum 100, 729–738.
- Milani P, Gholamirad M, Traas J, Arneodo A, Boudaoud A, Argoul F, Hamant O. 2011. In vivo analysis of local wall stiffness at the shoot apical meristem in Arabidopsis using atomic force microscopy. The Plant Journal 67, 1116–1123.
- Milani P, Mirabet V, Cellier C, Rozier F, Hamant O, Das P, Boudaoud A. 2014. Matching patterns of gene expression to mechanical stiffness at cell resolution through quantitative tandem epifluorescence and nanoindentation. Plant Physiology 165, 1399–1408.
- Mirabet V, Das P, Boudaoud A, Hamant O. 2011. The role of mechanical forces in plant morphogenesis. Annual Review of Plant Biology 62, 365–385.
- Mori T, Kuroiwa H, Higashiyama T, Kuroiwa T. 2006. GENERATIVE CELL SPECIFIC 1 is essential for angiosperm fertilization. Nature Cell Biology 8, 64–71.
- Nagata W, Zangeneh HRZ, Holloway DM. 2013. Reaction–diffusion patterns in plant tip morphogenesis: bifurcations on spherical caps. Bulletin of Mathematical Biology 75, 2346–2371.
- Nasto A, Ajdari A, Lazarus A, Vaziri A, Reis PM. 2013. Localization of deformation in thin shells under indentation. Soft Matter 9, 6796–6803.
- Park YB, Cosgrove DJ. 2012. A revised architecture of primary cell walls based on biomechanical changes induced by substrate-specific endoglucanases. Plant Physiology 158, 1933–1943.
- Paulose J, Nelson DR. 2013. Buckling pathways in spherical shells with soft spots. Soft Matter 9, 8227–8245.
- Peaucelle A, Braybrook SA, Le Guillou L, Bron E, Kuhlemeier C, Hoefte H. 2011. Pectin-induced changes in cell wall mechanics underlie organ initiation in Arabidopsis. Current Biology 21, 1720–1726.
- Pettolino FA, Walsh C, Fincher GB, Bacic A. 2012. Determining the polysaccharide composition of plant cell walls. Nature Protocols 7, 1590–1607.
- Radotic K, Roduit C, Simonovic J, Hornitschek P, Fankhauser C, Mutavdzic D, Steinbach G, Dietler G, Kasas S. 2012. Atomic force microscopy stiffness tomography on living Arabidopsis thaliana cells reveals the mechanical properties of surface and deep cell-wall layers during growth. Biophysical Journal 103, 386–394.
- Routier-Kierzkowska A-L, Smith RS. 2013. Measuring the mechanics of morphogenesis. Current Opinion in Plant Biology 16, 25–32.
- Routier-Kierzkowska A-L, Weber A, Kochova P, Felekis D, Nelson BJ, Kuhlemeier C, Smith RS. 2012. Cellular force microscopy for in vivo measurements of plant tissue mechanics. Plant Physiology 158, 1514–1522.
- Santiago R, Barros-Rios J, Malvar RA. 2013. Impact of cell wall composition on maize resistance to pests and diseases. International Journal of Molecular Sciences 14, 6960–6980.
- Smith MM, Stone BA. 1973 a. Chemical composition of the cell walls of Lolium multiflorum endosperm. Phytochemistry 12, 1361–1367.
- Smith MM, Stone BA. 1973 b. Studies on Lolium multiflorum endosperm in tissue-culture. 1. Nutrition. Australian Journal of Biological Sciences 26, 123–133.
- Sneddon IN. 1965. The relation between load and penetration in the axisymmetric boussinesq problem for a punch of arbitrary profile. International Journal of Engineering Science 3, 47–57.
- Sultan E, Boudaoud A. 2008. The buckling of a swollen thin gel layer bound to a compliant substrate. Journal of Applied Mechanics-Transactions of the ASME 75, 051002.
- Touhami A, Nysten B, Dufrene YF. 2003. Nanoscale mapping of the elasticity of microbial cells by atomic force microscopy. Langmuir 19, 4539–4543.
- Updegraf D. 1969. Semimicro determination of cellulose in biological materials. Analytical Biochemistry 32, 420–424.
- Vella D, Ajdari A, Vaziri A, Boudaoud A. 2012. The indentation of pressurized elastic shells: from polymeric capsules to yeast cells. Journal of the Royal Society Interface 9, 448–455.
- Vinogradova OI, Butt HJ, Yakubov GE, Feuillebois F. 2001. Dynamic effects on force measurements. I. Viscous drag on the atomic force microscope cantilever. Review of Scientific Instruments 72, 2330–2339.
- Vogler H, Draeger C, Weber A, et al.. 2013. The pollen tube: a soft shell with a hard core. The Plant Journal 73, 617–627.
- Weber A, Braybrook S, Huflejt M, Mosca G, Routier-Kierzkowska A-L, Smith RS. 2015. Measuring the mechanical properties of plant cells by combining micro-indentation with osmotic treatments. Journal of Experimental Botany 66, 3229–3241.
- Wilson SM, Bacic A. 2012. Preparation of plant cells for transmission electron microscopy to optimize immunogold labeling of carbohydrate and protein epitopes. Nature Protocols 7, 1716–1727.
- Wolf S, Hematy K, Hoefte H. 2012. Growth control and cell wall signaling in plants. Annual Review of Plant Biology 63, 381–407.
- Xiao C, Zhang T, Zheng Y, Cosgrove DJ, Anderson CT. 2016. Xyloglucan deficiency disrupts microtubule stability and cellulose biosynthesis in Arabidopsis, altering cell growth and morphogenesis. Plant Physiology 170, 234–249.
- Yi H, Puri VM. 2012. Architecture-based multiscale computational modeling of plant cell wall mechanics to examine the hydrogen-bonding hypothesis of the cell wall network structure model. Plant Physiology 160, 1281–1292.
- Zhang T, Mahgsoudy-Louyeh S, Tittmann B, Cosgrove D. 2014. Visualization of the nanoscale pattern of recently-deposited cellulose microfibrils and matrix materials in never-dried primary walls of the onion epidermis. Cellulose 21, 853–862.
- Zhang T, Zheng Y, Cosgrove DJ. 2016. Spatial organization of cellulose microfibrils and matrix polysaccharides in primary plant cell walls as imaged by multichannel atomic force microscopy. The Plant Journal 85, 179–192.