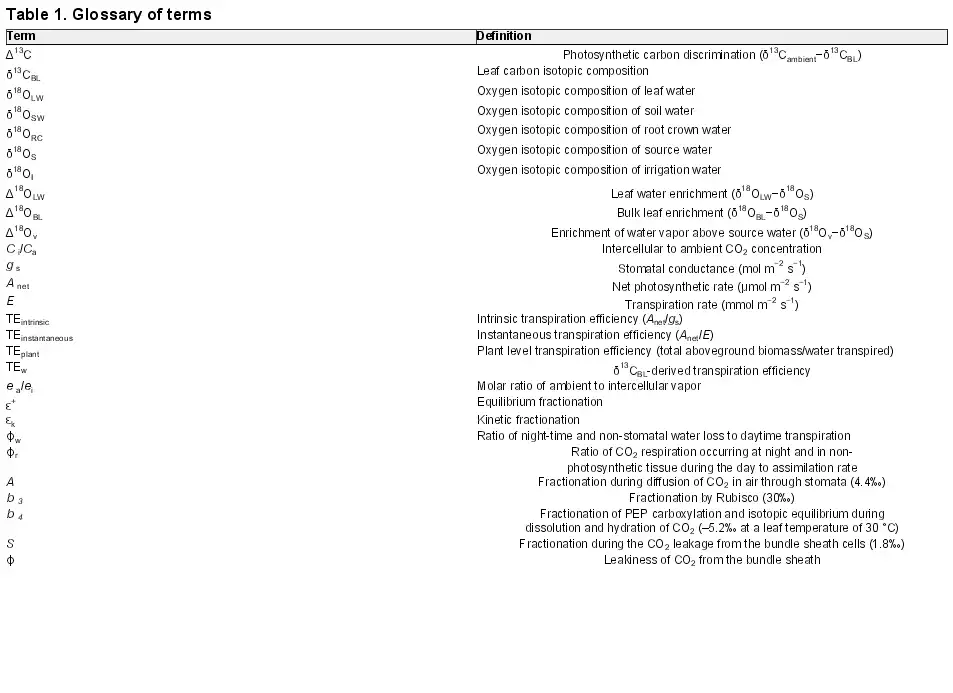
Introduction
The bulk leaf carbon isotopic signature (δ13CBL) can potentially provide time-integrated proxies of stomatal conductance and transpiration efficiency (TE), where TE is defined as the quantity of carbon fixed per unit water lost through transpiration (for a glossary of terms, see Table 1). For example, δ13CBL has been successfully used in wheat breeding programs to screen for TE (; , ; ; ) and has been studied in C4 species such as maize (; ,c), sorghum (), sugarcane (), and pearl millet (). Additionally, bulk leaf oxygen enrichment above source water (S) (Δ18OBL=δ18OBL−δ18OS) has been proposed as a proxy for transpiration rate (E) when comparing plants grown together under the same atmospheric and climatic conditions (; ; ). For example, Δ18OBL has been shown to vary with E in several crop species such as tea (), sunflower (), cowpea (), and wheat (). However, to date C4 plant-breeding programs have not generally used stable isotopes to phenotype or select for TE.
Variation in δ13CBL in plants grown under the same climatic conditions is primarily determined by leaf photosynthetic CO2 isotope discrimination:
where δ values are in ‰ notation and δ13Cambient is the signature of available atmospheric CO2. In C4 plants, Δ13C is influenced by fractionations associated with diffusion of CO2, carboxylation reactions, and the ratio of bundle sheath CO2 leak rate to PEP carboxylase rate (leakiness, ϕ), and it is proportional to the partial pressure of intercellular to ambient CO2 (Ci/Ca). Ci/Ca is a measure of the supply of CO2 to photosynthesis, and as Ci/Ca increases, discrimination decreases (for the simplified model; ):
where a is the fractionation during diffusion of CO2 in air through stomata (4.4‰), b4 is the combined fractionation of PEP carboxylation and the preceding isotopic equilibrium during dissolution and hydration of CO2 (–5.2‰ at a leaf temperature of 30 °C) as described in , b3 is the fractionation by Rubisco (30‰), s is the fractionation during the leakage of CO2 out of the bundle sheath cells (1.8‰), and ϕ is the leakiness of CO2 from the bundle sheath (, ).
The CO2 concentrating mechanism in C4 plants minimizes Rubisco fractionation, so the relationship between Δ13C and Ci/Ca in C4 plants is dampened compared with C3 plants and is less variable across growth conditions and genotypes (). Leakiness (ϕ) determines the slope of the relationship between Δ13C and Ci/Ca, controlling the directionality of this relationship from positive to negative. However, ϕ has been shown to be relatively constant in many C4 species, varying little across light intensities, temperatures, and CO2 partial pressures (; ; ; ). Therefore, if ϕ is relatively robust and constant across different growth conditions, then changes in Δ13C are primarily driven by variation in Ci/Ca, which is influenced by both the net rates of CO2 fixation (Anet) and stomatal conductance (gs). For example, increasing Anet can draw down Ci relative to Ca and a reduction in gs can decrease the supply of atmospheric CO2 to the intercellular air space for photosynthetic assimilation. Since TE is also related to Anet and gs, this means that TE and Δ13C are linked through their relationship with Ci/Ca, which makes δ13CBL a potential proxy for TE (; ).
Alternatively, oxygen isotopic enrichment above source water in leaf tissue (Δ18OBL) comes partly from oxygen isotopic enrichment in leaf lamina water, a component of leaf water enrichment (Δ18OLW), and where organic compounds are synthesized within the leaf. At these sites of carbonyl oxygen isotope exchange, the leaf water oxygen isotope signal is passed on to photosynthetic intermediates and consequently passed on to bulk leaf tissue (, ; ; ; ). The model of , which describes the evaporative isotopic enrichment of water from the surface of a water body, was modified to explain how oxygen isotopes in leaf water are enriched:
where isotopic enrichment of water at the evaporation sites (Δ18Oe) is influenced by the isotopic enrichment above source water of ambient vapor (Δ18Ov), temperature-dependent gradient in the molar ratio of ambient to intercellular water vapor (ea/ei), temperature-dependent equilibrium fractionation (ε+), and kinetic fractionation (εk), which is a function of stomatal and boundary layer conductances (Eq. 3 and more in-depth explanation in Appendix).
The Craig–Gordon model describes Δ18Oe, but tends to overestimate Δ18OLW. To account for this overestimation, the Craig–Gordon model was modified to account for unenriched leaf xylem water and the mixing behavior between xylem and lamina water pools (Péclet and two-pool models; ; ). The Péclet model suggests that δ18OLW reflects the relative isotopic contributions of advection of source water in the xylem and back diffusion of water from the sites of evaporation. The proportional mixing of source water and water from the evaporation sites is primarily determined by the transpiration rate (E) and the mean effective path length (L) through which water passes from the xylem to the stomates (; ). Therefore, if L remains constant, Δ18OLW decreases as E increases by decreasing the influence of Δ18Oe on Δ18OLW. Because Δ18OBL partly reflects Δ18OLW, in the Péclet model where Δ18OLW is related to E, Δ18OBL can potentially provide an integrated proxy of E over the life of the leaf (; ), and when coupled with biomass measurements can be a proxy for TE (). However, support for the Péclet effect has not been found in many instances (; ; ; ; ). Therefore, it is uncertain if Δ18OBL can be used as a proxy for E in C4 grasses.
In this study we tested the relationship between δ13CBL and Δ18OBL with TE and E, respectively, in the model C4 grasses Setaria viridis (L.) P. Beauv. and S. italica (L.) P. Beauv. These species are part of the C4 panicoid grass clade and are closely related to important food and biofuel crops, such as sugar cane, maize, miscanthus, and sorghum (; ). S. viridis is a unique model organism for this clade because it has a short lifespan, a sequenced genome and a single nucleotide polymorphism (SNP) map for quantitative trait locus analysis (; ). Additionally, S. viridis and S. italica are drought-resistant species, growing in areas that cannot support sorghum, sugar cane, or maize production (). In the current study, both species were grown under well-watered and water-limited conditions to determine the effect that water limitations had on δ13CBL and Δ18OBL to evaluate their use as proxies for gs, E, and TE.
Material and methods
Growth and greenhouse conditions
Experiment with Setaria viridis
Setaria viridis (L.) P. Beauv. (accession A-10) was grown in the greenhouses at Washington State University, Pullman, WA, USA between June and July of 2013. Day and night temperatures were 26–30 and 21–25 °C, respectively. Daytime and night-time relative humidity were 30–57% and 59–89%, respectively. Plants received 500–1500 µmol m−2 s−1 photosynthetic photon flux density (PPFD) over 14 h. Pot distribution in the greenhouse was randomized every day to minimize the influence of lighting heterogeneity. Fifteen S. viridis seedlings per treatment with one seedling per pot were transplanted into 11.3-liter pots using a commercial potting soil mix (Sunshine LC 1). Plants received 20-20-20 NPK with micronutrients (JR Peters Inc., Allentown, PA 18106) twice weekly at 2.8 g l−1 water.
After the initial watering at transplanting, pots in the well-watered and water-limited treatments were maintained at a gravimetric water content (GWC) of ~4 and 1 g water g soil−1, respectively. In GWC calculations, fresh biomass would be considered soil water weight, causing GWC to be overestimated, so throughout the experiment daily transpiration was used as a proxy for changes in fresh weight over time to accurately calculate the soil water volume and estimates of GWC. All pots and lateral holes were covered with plastic sheeting to minimize soil evaporation. Daily transpiration was measured as the difference in pot weight between dawn and dusk minus soil evaporation (difference in a covered pot weight without a plant). All of the plants could not feasibly be measured and harvested in one day, so the plants were randomly divided into three collection groups of five plants from each treatment. Gas exchange measurements and harvesting of plant material of collections 1, 2, and 3 took place on 39, 43, and 44 d after germination. At all collection times, panicles had begun to emerge.
Experiment with Setaria italica
Setaria italica (L.) P. Beauv. (accession B-100; () was grown in a controlled-environment growth cabinet (Enconair Ecological GC-16). Growth conditions were set at 16 h photoperiod including a 2 h ramp at dawn and dusk and maximum PPFD of 1000 µmol quanta m−2 s−1. Day and night temperatures were maintained at 28 ± 1 and 18 ± 1 °C, respectively and a mean relative humidity of 59 ± 6%. Pot location was randomized every day. A total of 33 S. italica seedlings (11 plants per treatment with one seedling per pot) were transplanted into 7.5-liter pots at 15 d after germination. The potting soil was the same as was used with S. viridis. Plants received 15-5-15 CalMag (JR Peters Inc., Allentown, PA, USA) twice weekly at a rate of 2.5 g l−1 water, Sprint 330 iron chelate (0.25 g l−1) weekly, and Scott-Peters Soluble Trace Element Mix, 10.0 mg l−1 biweekly (The Scotts Co., OH, USA).
After initial watering after transplanting, the GWC of the well-watered, moderately and severely water-limited treatments was maintained at 4.0, 0.9, and 0.5 g water g soil−1, respectively. Pots were covered with plastic similar to S. viridis. Six and five plants from each treatment were randomly selected to be harvested in the first and second collections, respectively. Leaf gas exchange measurements were made at six time points (31, 34, 40, 43, 53, and 54 d after germination). Plant material for stable isotope analysis was only collected at the final harvest, immediately following gas exchange measurements. At all collection times, panicles had begun to emerge in all plants.
Gas exchange measurements
Measurements were made on the uppermost fully expanded leaf between 11:00 h and 15:00 h. Leaves were placed in a 2 × 3 chamber of an LI-6400XT open gas exchange system (Li-COR Biosciences, Inc., Lincoln, NE, USA). The leaf was allowed to acclimate at 1500 µmol m−2 s−1 PPFD, leaf temperature of 29 °C, flow rate of 300 µmol s−1, 21% O2, 35 Pa CO2 for S. viridis. The same conditions were used for S. italica except that light intensity was 900 µmol m−2 s−1 PPFD to reflect the light intensity of their growing conditions. Relative humidity (RH) in the LI-COR chamber was within 10% of the RH under growth conditions, and the implications of this difference in RH is explained in the next section.
Sample collection for stable isotope analysis
To obtain sufficient leaf water to measure δ18O of leaf water (δ18OLW) from S. viridis, an aggregate of five to eight leaves (including the leaf used to measure gas exchange) was collected from each plant at the time of harvest. However, in S. italica the leaf used for gas exchange measurements was sufficient to analyse δ18OLW. The same leaf samples that were analysed for δ18OLW were also analysed for leaf carbon isotopic composition (δ13Cleaf) and oxygen isotopic composition of bulk leaf tissue (δ18OBL). All leaves collected for stable isotope analysis were the youngest, fully expanded leaves, which developed 15–20 d after soil water content reached the treatment set point. For both species, leaves were removed from the plant and photographed to measure leaf area using ImageJ software (). Photographing each leaf only took approximately 20 s, and then the leaf was stored in sealed glass tubes awaiting water extraction.
In S. italica only, using the same leaf for gas exchange measurements and stable isotope analysis could have an effect on δ18OLW because RH and the oxygen isotope ratio in the growth cabinet air (δ18Ov) could differ between growth and gas exchange chambers (). However, gas exchange measurements were conducted within the growth chamber, and the mean±SE proportion of the total leaf area continuously exposed to growth cabinet conditions during gas exchange measurements was 94.0 ± 0.6%, 91.0 ± 0.8%, and 89.5 ± 0.8% for well-watered, moderately water-limited, and severely water-limited treatments, respectively. Therefore, the δ18O of the growth cabinet air was the most appropriate measure of δ18Ov. The difference in RH between the growth cabinet and the gas exchange chamber could contribute a 1.9–5.5‰ shift in δ18Oe for the leaf section in the gas exchange chamber, assuming, however unlikely, that 10–20 min was adequate time for the leaf section to acclimate. This would represent a shift in δ18Oe for the entire leaf of 0.24–0.43‰, and Δ18OLW would shift by a fraction of this. Nonetheless, taking into account this potential shift did not significantly influence observed Δ18OLW values across treatments. Differences between greenhouse and LI-COR chamber conditions for S. viridis were irrelevant because leaf water was extracted from an aggregate of five to eight leaves.
The δ18O of water vapor in the greenhouse and growth chambers was measured every 30 min during gas exchange measurements by collecting air in 5-liter Supel inert foil gas sampling bags (Supelco, Bellefonte, PA, USA). Bags were flushed several times with air before filling, and δ18O of water vapor was immediately measured on the cavity ringdown spectrometer (L1102-i water analyser, Picarro Inc, Santa Clara, CA, USA).
Following the gas exchange measurements, root crowns were cleaned of soil and stored at −20 °C in air-tight tubes. Root crowns are considered the bottom 1 cm of the culm or tiller, but no actual roots were collected. Additionally, two soil samples were collected at the top and bottom of each pot, and stored using the same method as with the root crowns. Leaves, soils, and root crowns were distilled using a cryogenic vacuum distillation method (). Additionally, daily samples of irrigation water (IW) were collected to measure δ18OIW.
Biomass measurements
After collection of plant tissue for stable isotope analysis, the entire aboveground biomass was collected and weighed for fresh weight. Samples were dried at 65 °C for 3 d before weighing dry biomass.
Stable isotope analysis
The stable isotope composition of carbon and oxygen (δ18O and δ13C, respectively) were reported in δ notation in parts per thousand (‰),
where Rsample and Rstandard are the molar ratios of heavy to light isotope (18O/16O and 13C/12C) of the sample and international standard, respectively. The international standard used for oxygen was Vienna Standard Mean Ocean Water (VSMOW) and for carbon was Vienna Pee Dee Belemnite (VPDB).
Stable isotope analysis by isotope ratio mass spectrometer
Leaf tissue was analysed for oxygen isotopic analysis by converting to CO with a pyrolysis elemental analyser (TC/EA, Thermo Finnigan, Bremen, Germany) and analysed with a continuous flow isotope ratio mass spectrometer (Delta PlusXP, Thermo Finnigan; ; ). For carbon isotopic analysis, leaf tissue was converted to CO2 with an elemental analyser (ECS 4010, Costech Analytical, Valencia, CA, USA) and analysed with a continuous flow isotope ratio mass spectrometer (Delta PlusXP; ; ). Isotopic standards, Standard Light Antarctica Precipitation (SLAP; ) and Puerto Rico water (), were analysed alongside samples to calculate δ18O based on the VSMOW scale. Lab standards, calibrated to international standards, were used to calculate δ13C relative to VPDB. Standard error for δ13C values for the S. viridis and S. italica experiments was 0.11 and 0.05‰, respectively. The standard error for δ18O was 0.2‰ for both experiments.
Leaf and root crown water were analysed for oxygen isotope composition by equilibrating 0.5 ml of water at room temperature with 0.3% CO2:He mixture for 48 h on a ThermoFinnigan GasBench II (Thermo Electron Corp., Bremen, Germany). CO2 was analysed with a continuous flow isotope ratio mass spectrometer (Delta PlusXP; ; ).
Stable isotope analysis by isotope ratio infrared spectroscopy
Soil and irrigation water were measured by isotope ratio infrared spectroscopy (model L1102-i, Picarro, Sunnyvale, CA, USA) connected to a vaporization chamber (V1102-i). The mean δ18O was calculated of the last three of six consecutive analyses on each sample. Three laboratory standards, calibrated to the VSMOW scale, were interspersed among the samples and were used to correct the sample δ18O values to the VSMOW scale. Water vapor was analysed for at least 15 min, but the mean of the last 5 min was used for δ18O and corrected to the VSMOW scale.
Calculations of transpiration efficiency
TEinstantaneous (Anet/E) and TEintrinsic (Anet/gs) are derived from gas exchange measurements, but they are independent of both TEplant and TEw, which are independent of each other. TEplant was derived from whole-plant measures of biomass and transpiration. TEw was calculated using Ci/Ca derived from δ13CBL, and the calculations are independent of the gas exchange measurements (described below).
Discrimination (Δ13CBL) and Ci/Ca are related in Eq. 2 and were used to calculate the integrated Ci/Ca over the life of the leaf (, ). A constant leakiness (ϕ) of 0.21 was assumed for all plants. The δ13C of ambient CO2 in the greenhouse and growth chamber that was used to calculate Δ13CBL was −10.7 ± 0.8‰, which was collected various times over a period of several months that included the time that the experiment was conducted. Air samples were collected in 5-liter Tedlar gas sampling bags using the same collection procedure used to collect air vapor. The gas was analysed by introducing air directly into either the isotope ratio mass spectrometer or the tunable diode laser absorption spectroscope (model TGA 200A, Campbell Scientific, Inc., Logan, UT, USA; ). Transpiration efficiency (TEw), defined as the ratio of dry matter produced per unit of water transpired, was calculated from the δ13CBL as described in as:
where v is the leaf to air vapor pressure difference and ϕr was calculated as the measured ratio of respiration and photosynthetic rate (0.08 for all plants). This parameter was calculated from gas exchange measurements made during the experiment. The parameter ϕw was calculated as the measured ratio of whole-plant night to day transpiration (0.30 and 0.23 for water-limited and well-watered plants, respectively) measured in this experiment. Both night-time and daytime whole-plant transpiration were measured on S. viridis. Both ϕr and ϕw were measured for S. viridis and assumed to be the same for S. italica. Ci/Ca was calculated from δ13CBL using Eq. 2.
Model calculations to determine validity of the Péclet model
To test the applicability of the Péclet model and its relationship to E, we used the method described by and of determining the proportional deviation (f) of Δ18OLW from Δ18Oe plotted against E where f is calculated as:
Effective path length (L) was calculated using the equations described in .
Statistical analysis
In both experiments statistical analyses were conducted in R v. 3.3.0 (), using car (v. 2.0-26) and agricolae (version 1.2-2) packages for statistical tests. Model II regressions (standard major axis regression) were calculated, using the lmodel2 (v. 1.7-2) package, because neither variable was controlled, both varied naturally with their own associated error, and the physical units of both variables were not the same. Homogeneity was tested based on plotting predicted fit vs residuals. Using the extRemes package (v. 2.0-8), normality was tested by plotting residuals on quantiles–quantiles plots. In all cases, where normality was questionable, transforming the data did not change the statistical results, so the data were not transformed. One- and two-way analysis of variance (ANOVA) was used to determine differences across treatments in the experiment with S. italica and between treatments and collection periods for S. viridis. Two-sample Student’s t-tests were performed to determine the difference between δ18OSW and δ18ORC values. One-sample t-tests were performed to determine if the difference of both δ18OSW and δ18ORC with δ18OIW was significantly different from 0. Repeated measures ANOVAs were conducted on the following parameters: total plant water use and GWC for S. viridis and on daily water use, GWC, Anet, E, and gs for S. italica.
Results
Plant growth and treatment effect
Maintaining water-limited plants at a GWC 71% lower than the well-watered plants significantly reduced total water use by 59% (Table 2 and Fig. 1). Additionally, at all collection times fresh and dry aboveground biomass were lower in the water-limited treatment relative to the well-watered treatment (Table 3). The results for S. italica were similar to S. viridis in that the GWC was reduced by 72% and 82%, and total water use by 70% and 80% in the moderately and severely water-limited treatments, respectively (Table 2; Fig. 1). In S. italica, fresh and dry aboveground biomass were reduced in the moderately water-limited, 71% and 68%, respectively, and in the severely water-limited treatment, 79% and 74%, respectively (Table 4; Fig. 1). Additionally, leaf length in the water-limited treatments was shorter compared with the well-watered leaves by 18% in S. viridis and in S. italica by 32% and 57% in the moderately and severely water-limited treatments, respectively (Tables 3 and 4). The number of tillers per plant in the well-watered treatment was 44% greater than the water-limited treatment in S. viridis (Table 3); however, the number of tillers per S. italica plant did not differ across treatments (Table 4).
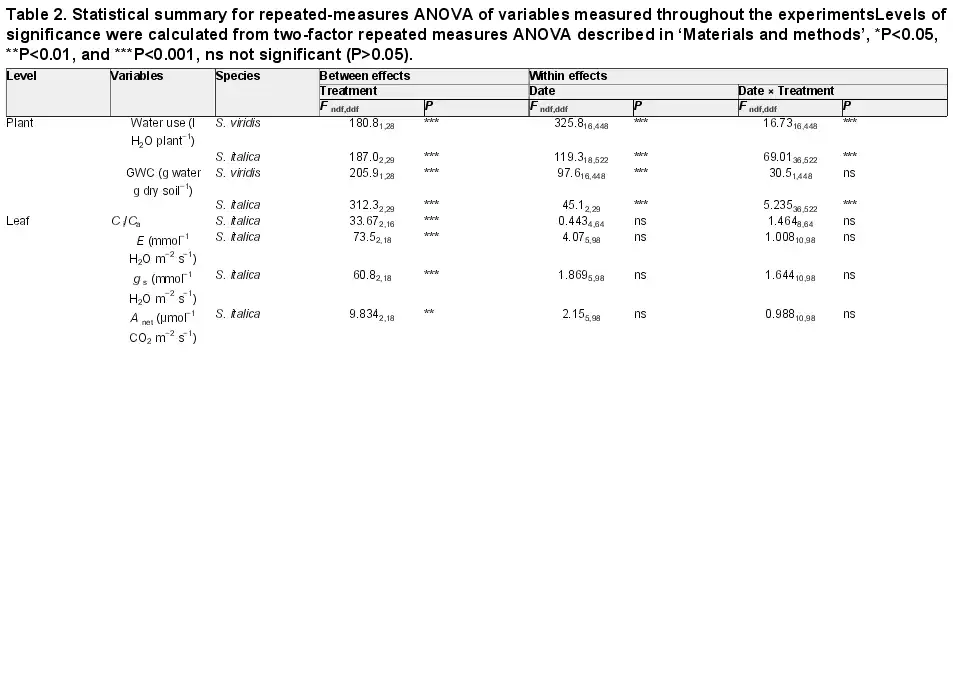
Table 2. Statistical summary for repeated-measures ANOVA of variables measured throughout the experimentsLevels of significance were calculated from two-factor repeated measures ANOVA described in ‘Materials and methods’, *P<0.05, **P<0.01, and ***P<0.001, ns not significant (P>0.05).
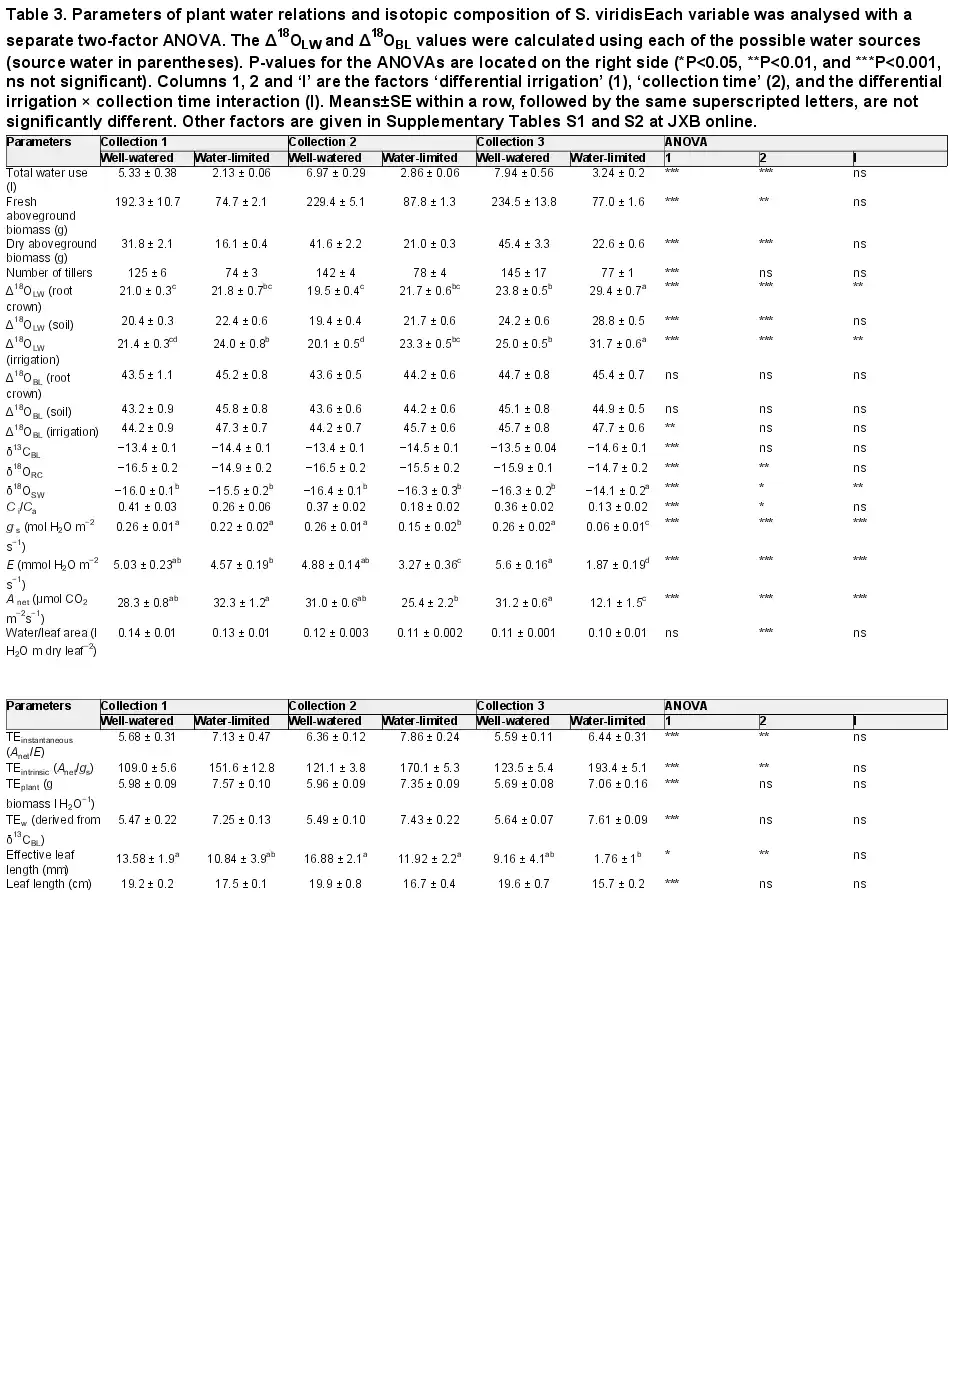
Table 3. Parameters of plant water relations and isotopic composition of S. viridisEach variable was analysed with a separate two-factor ANOVA. The Δ18OLW and Δ18OBL values were calculated using each of the possible water sources (source water in parentheses). P-values for the ANOVAs are located on the right side (*P<0.05, **P<0.01, and ***P<0.001, ns not significant). Columns 1, 2 and ‘I’ are the factors ‘differential irrigation’ (1), ‘collection time’ (2), and the differential irrigation × collection time interaction (I). Means±SE within a row, followed by the same superscripted letters, are not significantly different. Other factors are given in Supplementary Tables S1 and S2 at JXB online.
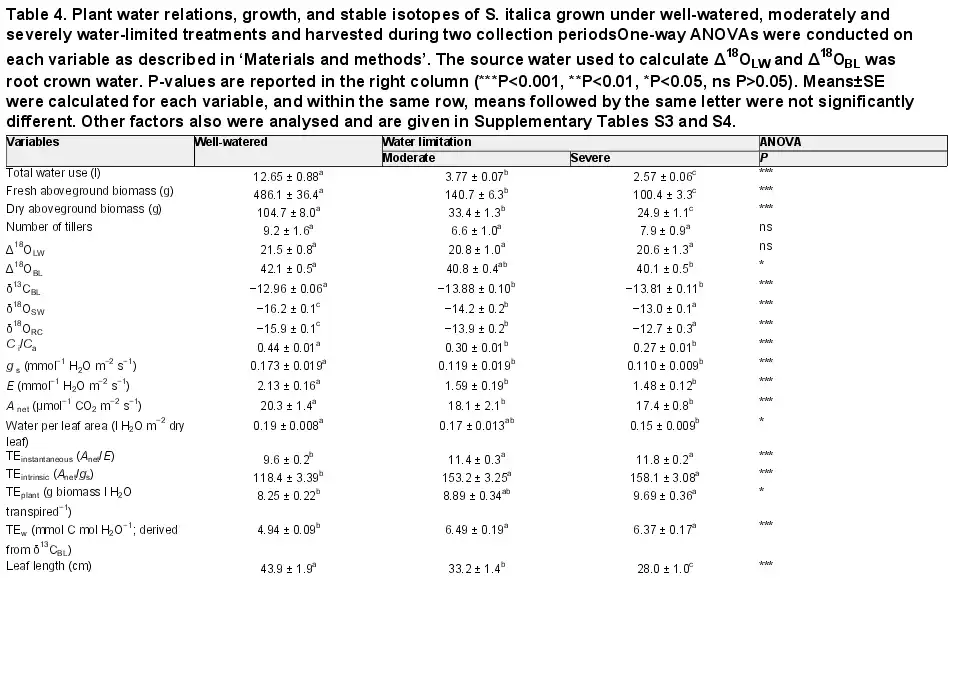
Table 4. Plant water relations, growth, and stable isotopes of S. italica grown under well-watered, moderately and severely water-limited treatments and harvested during two collection periodsOne-way ANOVAs were conducted on each variable as described in ‘Materials and methods’. The source water used to calculate Δ18OLW and Δ18OBL was root crown water. P-values are reported in the right column (***P<0.001, **P<0.01, *P<0.05, ns P>0.05). Means±SE were calculated for each variable, and within the same row, means followed by the same letter were not significantly different. Other factors also were analysed and are given in Supplementary Tables S3 and S4.
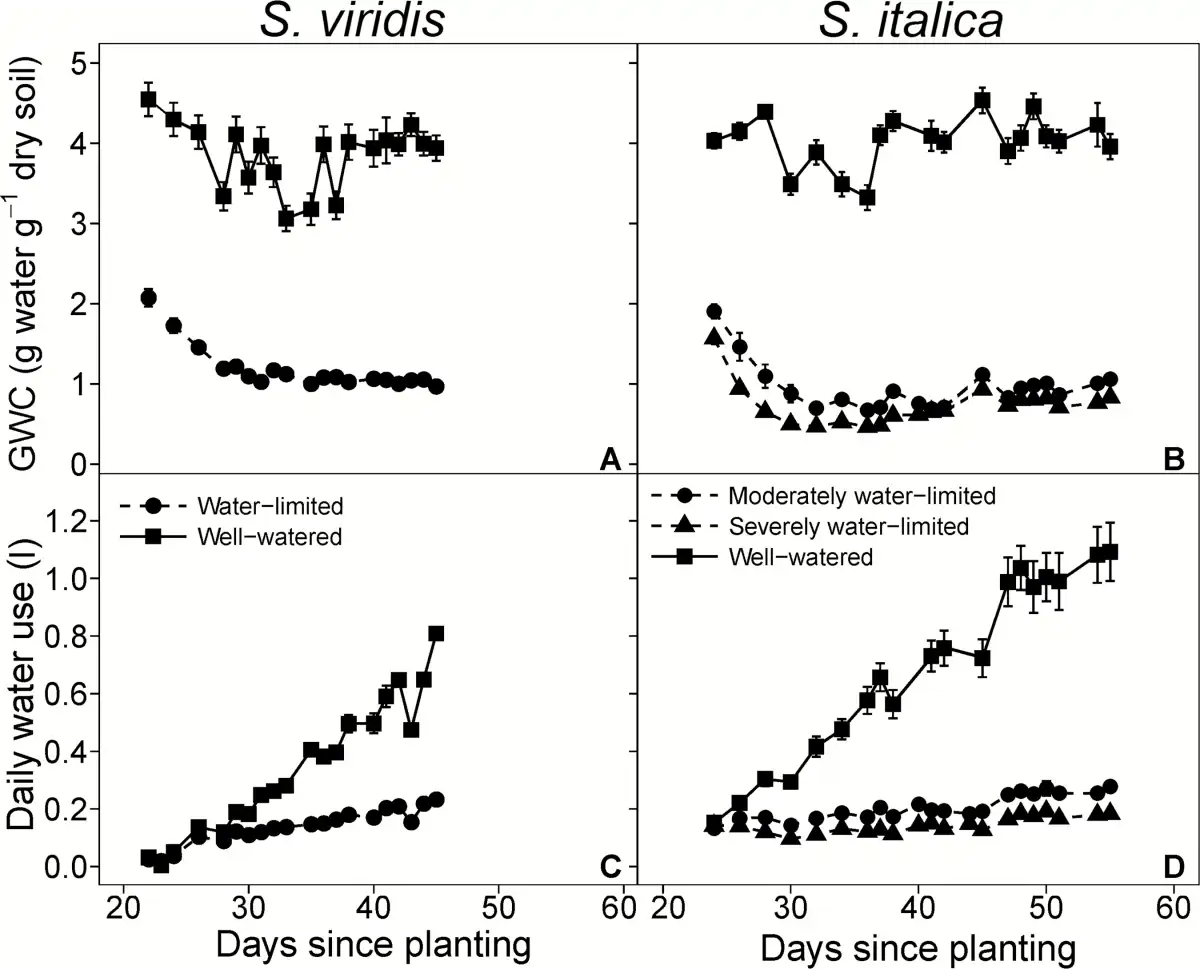
Fig. 1
Gravimetric water content (GWC; A, B) and daily water use (C, D) over the course of the experiment. Circles, triangles, and squares represent well-watered, moderately water-limited and severely water-limited plants, respectively. Solid and dashed lines represent well-watered and water-limited treatments, respectively. Error bars represent standard error.
For both species, stomatal conductance (gs), rates of transpiration (E), and the net rate of CO2 assimilation (Anet) were generally higher in the well-watered treatment compared with the water-limited treatment. Gas exchange measurements of S. viridis were made during the three biomass collections, and E was 33% and 67% greater in the well-watered treatment in collections 2 and 3, respectively, but did not differ between treatments in collection 1 (Table 3). Additionally, gs was 41% and 76% greater in the well-watered treatment during collection 2 and 3, respectively, but did not differ between treatments in collection 1. However, Anet in S. viridis was different between treatments only in collection 3 when Anet of water-limited plants was 61% lower than that of the well-watered treatment (Table 3). In S. italica, E, gs, and Anet were not different between the severely and moderately water-limited treatments, but both treatments were on average 27%, 32%, and 16% lower, respectively, than the well-watered treatment (Table 4).
Leaf carbon isotopic composition
The response in leaf carbon isotopic signature (δ13C) to water limitations was similar for both species. For example, δ13C values in S. viridis were consistently lower in the water-limited treatment for all collections by 1.1‰ (Table 3) and in S. italica the δ13C values were 0.9‰ lower in the two water-limited treatments compared with the well-watered treatments (Table 4). The δ13C values of both species were positively correlated with Anet, E, and gs, leaf water content, Δ18OLW, Δ18OBL, and all measurements of TE and plant growth and had stronger correlations with these parameters than either Δ18OLW or Δ18OBL (Table 5 and Figs 2 and 3).
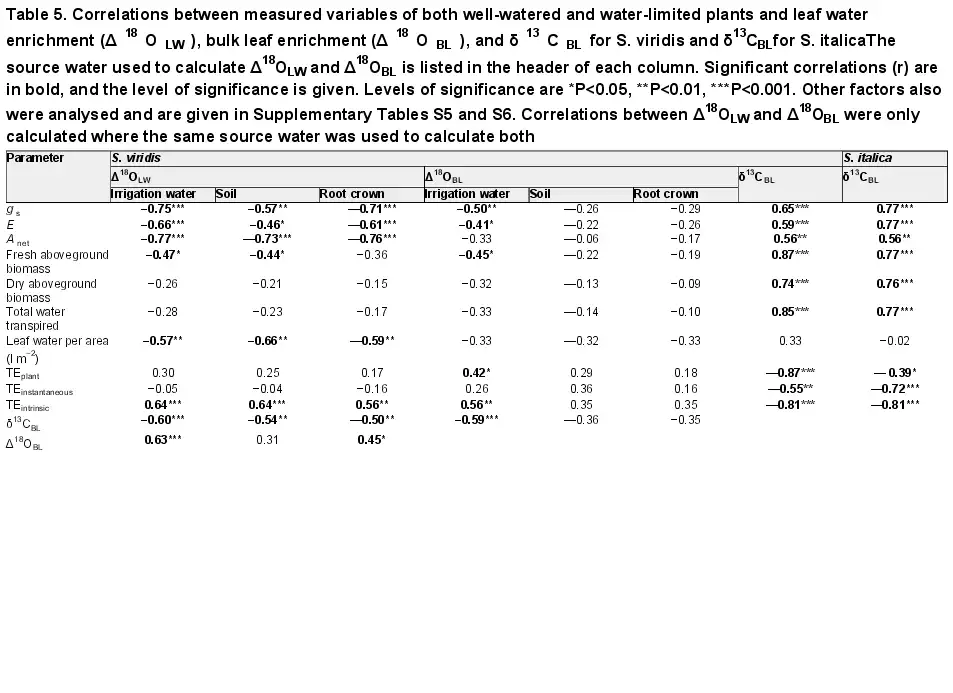
Table 5. Correlations between measured variables of both well-watered and water-limited plants and leaf water enrichment (Δ18OLW), bulk leaf enrichment (Δ18OBL), and δ13CBLfor S. viridis and δ13CBLfor S. italicaThe source water used to calculate Δ18OLW and Δ18OBL is listed in the header of each column. Significant correlations (r) are in bold, and the level of significance is given. Levels of significance are *P<0.05, **P<0.01, ***P<0.001. Other factors also were analysed and are given in Supplementary Tables S5 and S6. Correlations between Δ18OLW and Δ18OBL were only calculated where the same source water was used to calculate both
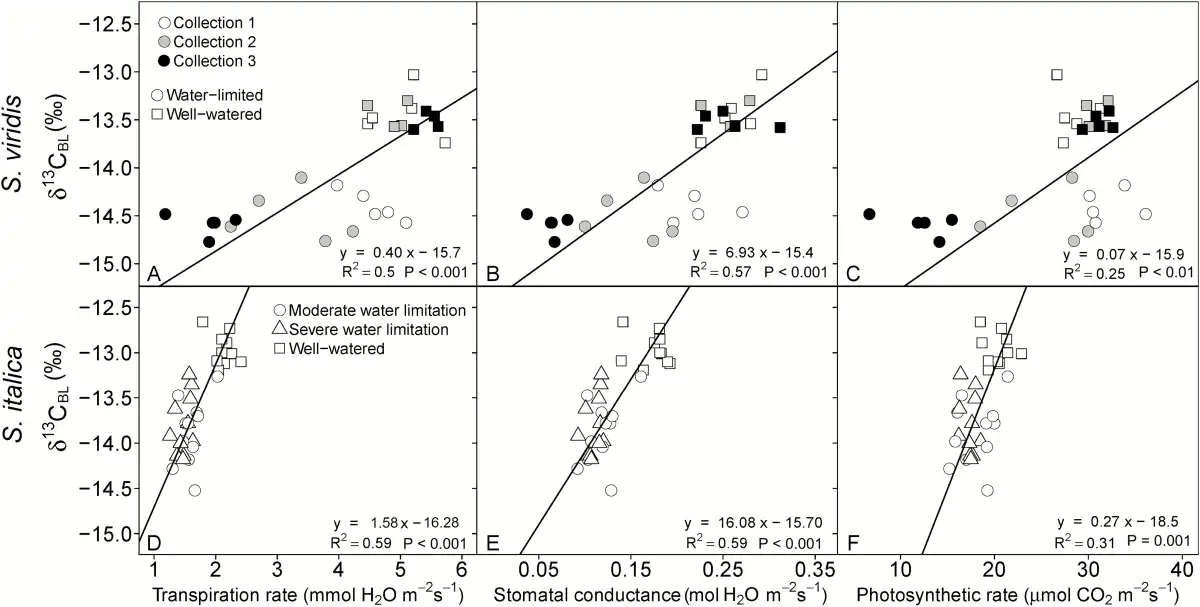
Fig. 2
Linear relationship between δ13CBL and transpiration rate (A, D), stomatal conductance (B, E), and photosynthetic rate (C, F) as measured at time of plant harvest. In the top panel, circles represent the water-limited treatment and squares represent well-watered plants, and open, gray-filled and black-filled symbols represent collection 1, 2, and 3, respectively. In the bottom panel, squares represent the well-watered treatment, circles represent the moderately water-limited treatment, and triangles represent the severely water-limited treatment. Lines represent Model II regression.
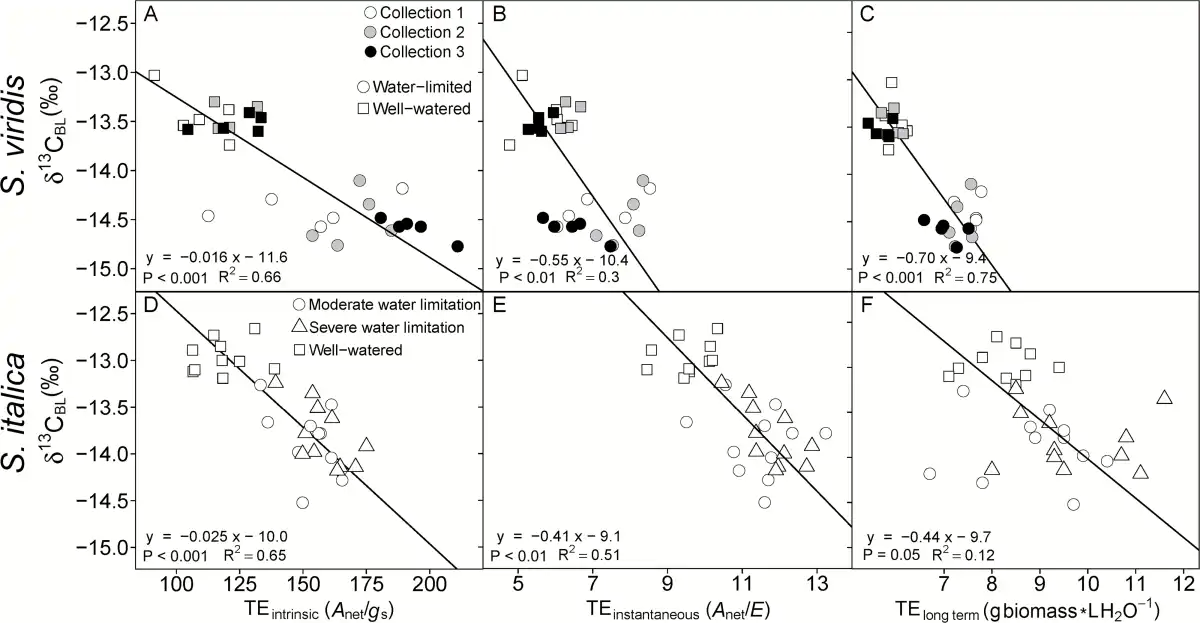
Fig. 3
Intrinsic TE (A, D; Anet/gs), instantaneous TE (B, E; Anet/E) and long term TE (C, F; g aboveground biomass l H2O transpired−1) regressed on bulk leaf carbon isotopic composition (δ13CBL). Lines represent Model II regression. (A–C) are S. viridis and (D–F) are S. italica.
Using the simplified equation (Eq. 2) of Δ13C versus Ci/Ca, where Δ13C was calculated from δ13CBL and Ci/Ca was measured, the mean leakiness of 0.21 ± 0.02 and 0.19 ± 0.01 was calculated for S. viridis in the well-watered and water-limited treatments, respectively. In S. italica leakiness was 0.17 ± 0.01 for well-watered and severely water-limited treatments and 0.20 ± 0.01 in the moderately water-limited. Overall, leakiness did not significantly differ between species or across treatments (0.17–0.21). The difference in leakiness would account for 0.22 ± 0.03‰ and 0.24 ± 0.01‰ of the observed difference in Δ13CBL between treatments over the observed range of Ci/Ca in S. italica and S. viridis, respectively.
Transpiration efficiency (TE) and leaf δ13C-derived transpiration efficiency (TEw)
Four different methods were used to calculate transpiration efficiency: (i) long term TE (TEplant; grams of aboveground dry biomass per liter water transpired); (ii) instantaneous TE (TEinstantaneous; Anet/E); (iii) intrinsic TE (TEintrinsic; Anet/gs); and (iv) δ13CBL-derived TE (TEw; mmoles carbon fixed per mole H2O transpired). For S. viridis the water-limited plants had higher TE regardless of how it was estimated, except in collection 3 where there was no difference in TEinstantaneous between treatments (Table 3). In S. italica, all four estimates of TE were higher in both water-limited treatments than the well-watered treatment, but the difference was not significant between the moderately and severely water-limited treatments. In both species, the TEintrinsic had the largest differences between treatments (45% and 32% greater in S. viridis and S. italica, respectively; Tables 3 and 4). Additionally, TEintrinsic had the strongest relationship with Δ18OLW, Δ18OBL, and δ13C (Table 5).
Leaf oxygen isotopic composition
The gas exchange measurements and leaf samples were collected between 11:00 and 15:00 h. During this time the vapor oxygen isotope ratios (δ18Ov) in both the greenhouse for S. viridis and in the growth chambers for S. italica were relatively stable. For S. viridis, δ18Ov values (mean±SE) were −17.4 ± 0.2, −21.9 ± 0.4, and −24.2 ± 0.3 for the three collections, respectively. For S. italica, δ18Ov values were −25.8 ± 0.1 and −20.1 ± 0.8 for the two collections, respectively.
Plants were top irrigated in covered pots with irrigation water (−17.0 ± 0.1‰ and −16.9 ± 0.1‰ for S. viridis and S. italica, respectively). The mean δ18OSW values (average of δ18O of soil samples from the top and bottom of the pot) of the well-watered and water-limited treatments were 0.8 ± 0.1‰ and 1.9 ± 0.2‰ higher than irrigation water for S. viridis (P<0.0001), respectively. For S. italica, δ18OSW values were 0.8 ± 0.2‰, 2.7 ± 0.2‰, and 3.9 ± 0.4‰ higher than irrigation water in the well-watered, moderately and severely water-limited treatments, respectively (P<0.0001). In S. viridis, the δ18ORC values were 0.6 ± 0.1‰ and 2.0 ± 0.1‰ higher than δ18OIR in the well-watered and water-limited plants (P=0.0002 and P<0.0001), respectively. In S. italica, δ18O values were 1.1 ± 0.1‰, 3.1 ± 0.2‰, and 4.3 ± 0.3‰ higher than the irrigation water in the well-watered, moderately and severely water-limited treatments (P<0.0001), respectively. The δ18O of root crown and soil water was not significantly different in either S. viridis or S. italica (P>0.05).
Leaf water enrichment (Δ18OLW) showed a significant treatment effect in S. viridis independent of which water was considered source water (irrigation, soil, or root crown water), but the treatment effect on Δ18OLW was greatest with irrigation water. Likewise the strength of the correlation between parameters of gas exchange, water use, and growth depended on which source water was used to calculate Δ18OLW. However, independent of the source water, Δ18OLW negatively correlated with Anet, E, and gs and positively correlated with TEintrinsic and δ13CBL (Table 5 and Fig. 4). In S. italica, Δ18OLW did not have a significant treatment effect or correlate with growth, gas exchange, or TE variables, regardless of source water used (Table 4).
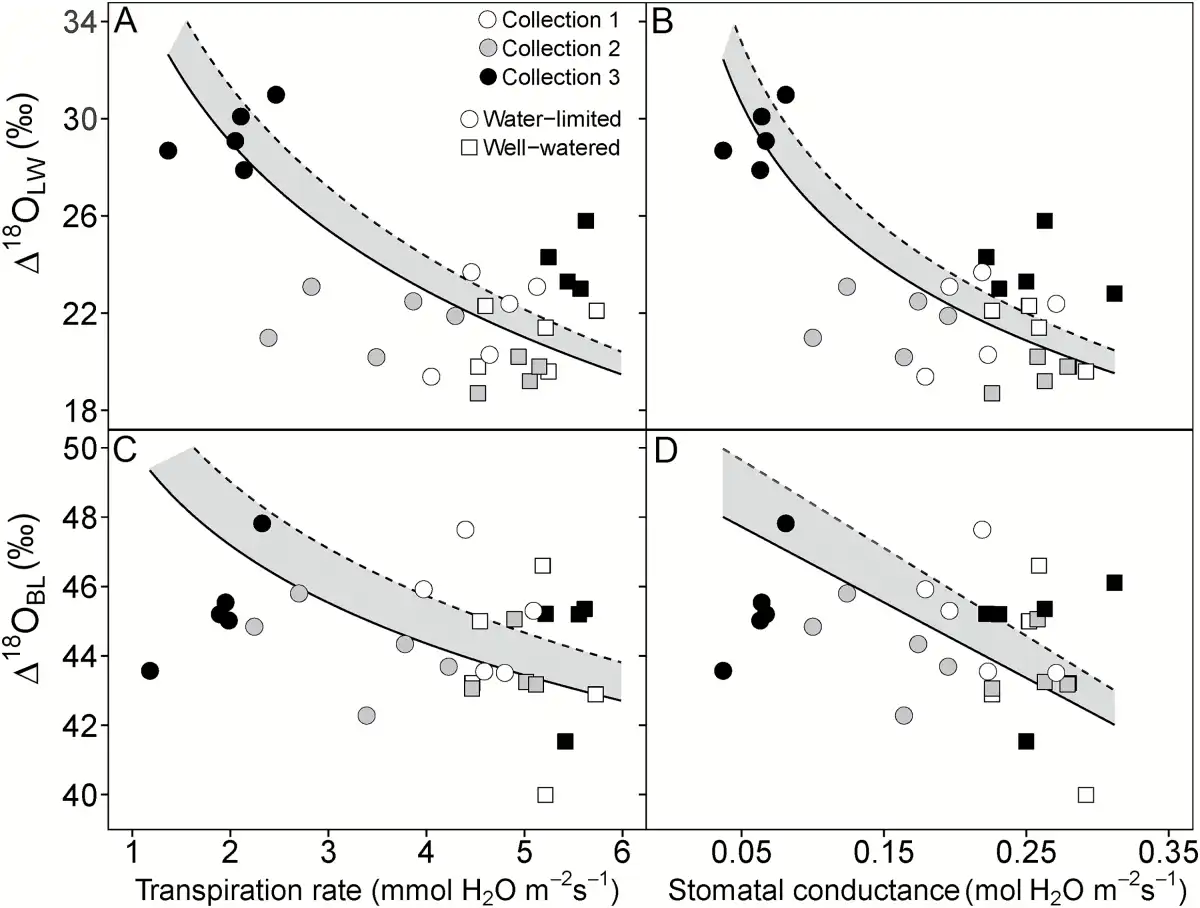
Fig. 4
Relationship between Δ18OLW (A, B) and Δ18OBL (C, D) and transpiration rate (A, C) and stomatal conductance (B, D) in S. viridis. Gas exchange measurements were made at time of plant harvest. Circles represent the water-limited treatment and squares represent well-watered plants. Open, gray-filled and black-filled symbols represent collection 1, 2, and 3, respectively. The points represent Δ18OLW and Δ18OBL when they were calculated using δ18ORC as source water (δ18OLW or δ18OBL minus δ18OS). The dashed regression line represents the regression when δ18OI was used to calculate Δ18OLW and Δ18OBL. The solid regression line represents the regression when δ18OSW or δ18ORC were used to calculate Δ18OLW and Δ18OBL. The resulting regression line between Δ18OLW or Δ18OBL with transpiration rate (E) and stomatal conductance (gs) did not differ when δ18OSW or δ18ORC was used to calculate Δ18OLW and Δ18OBL. Therefore, the shaded region represents the variation associated with which source water was used. Lines represent Model II regressions.
In S. viridis, a significant treatment effect in Δ18OBL was only found and Δ18OBL only correlated with gs, E, fresh aboveground biomass, TEplant, and TEintrinsic, Δ18OLW, and δ13CBL when irrigation water was used as source water (Table 5 and Fig. 4). The only parameter that correlated significantly with Δ18OBL when root crown water was considered the source water was Δ18OLW. For S. italica, the Δ18OBL in the well-watered treatment was 2.0‰ greater than the severely water-limited treatment, but Δ18OBL of the moderately water-limited treatment was not different from either treatment (Table 4). This difference resulted in significant positive correlations with E and gs (0.60 and 0.59, respectively) when negative correlations were expected.
The Péclet model was tested by comparing the proportional deviation of Δ18OLW from Δ18Oe (f; Eq. 6) with E (see Supplementary Fig. S1 at JXB online). This relationship was significant for S. viridis (f=0.086E–0.221, R2=0.36, P=0.0005) but not for S. italica (P=0.93) suggesting that in S. viridis Δ18OLW deviated more from Δ18Oe as E increased. For S. italica, the Δ18OLW was larger than Δ18Oe (negative f values), causing Δ18OLW to be more enriched than would be expected based on the evaporative environment. For S. viridis the estimated effective leaf length (L) was small but significantly different between treatments (13.2 ± 2.7 and 8.2 ± 2.4 mm in well-watered and water-limited treatments, respectively; Supplementary Tables S1 and S2).
Discussion
Leaf carbon isotopic composition
Water-limited C4 plants consistently have lower δ13CBL values than well-watered plants (; ). Water limitations also typically reduce gs, and in C4 plants low gs results in depleted δ13CBL. This is primarily because Δ13CBL decreases with Ci/Ca when ϕ is generally below 0.37, and low gs tends to decrease Ci/Ca (; ). Alternatively, a decreased photosynthetic capacity in the water-limited plants could increase Ci/Ca, which would decrease Δ13CBL and lead to an increase in δ13CBL values. Therefore, the decrease in δ13CBL observed in the water-limited plants is mostly due to changes in gs and its influence on Ci/Ca. However, it is possible that water limitations increase ϕ, and lower δ13CBL values.
Models of C4 isotope exchange suggest that a decrease in the capacity of the CO2 concentrating mechanism, as would occur with a stomatal limitation in CO2 supply, could decrease ϕ (). Additionally, leaf level measurements of CO2 exchange have demonstrated that ϕ remains fairly constant under various environmental conditions (; , ; ; ; ; ). The ability of C4 plants to maintain and minimize ϕ in response to long-term changes in growth conditions is not surprising as the C4 and C3 cycles are metabolically coordinated between the mesophyll and bundle sheath cells, causing them to function as integrated and not independent cycles ().
Using the simplified model of Δ13C (Eq. 2), the calculated ϕ from δ13CBL and Ci/Ca produced similar values (0.17–0.21) to what has been published previously (see list of studies in ). This difference in ϕ could account for a mean 22% and 24% of the measured difference in δ13CBL across treatments in S. italica and S. viridis, respectively. In a separate study, under well-watered conditions Δ13Cinstantaneous at similar Ci/Ca was approximately 4.4 ± 0.2‰ for both S. viridis and S. italica, giving evidence that ϕ is not inherently different between these species (Ellsworth et al., unpublished data). Additionally, the relationship between Δ13CBL and Ci/Ca was similar for both species under all treatments, potentially falling on the same line where ϕ controls the slope (see Fig 1; ). Granted these calculations of ϕ provide only an approximation because instantaneous measures of Δ13C and δ13CBL are known to differ because of post-photosynthetic fractionations, as discussed below (; ).
Post-photosynthetic fractionation
Post-photosynthetic fractionations of carbon compounds could influence δ13CBL; however, to influence δ13CBL there must be a change in the leaf carbon mass balance by isotopic flux into or out of the leaf (). Potentially, water-limited plants differ in which carbon pools are exported from the leaf. For example, if enriched amino acids are transported from the leaf at a greater rate than in well-watered plants (), then δ13CBL could decrease. However, enriched amino acids are a small pool of carbon compared with sucrose and cellulose, so their export would have to be extremely large to account for the observed depletion in δ13CBL. Additionally, the export or consumption by respiration of sucrose from starch degradation instead of from triose phosphate synthesis could also affect δ13CBL because sucrose from starch degradation is more enriched in 13C (; ; ). However, the respiratory carbon flux out of the leaf is relatively small compared with photosynthetic flux into the leaf, so water-limited plants would need an unrealistic shift in the isotopic signature of enriched respiratory carbon source (~12‰) to account for the −1‰ shift observed in δ13CBL. In water-limited C3 bean plants, sucrose was the primary carbon pool for respiration, suggesting that a dramatic shift in Setaria is unlikely (; ). Therefore, as discussed above, the shift in δ13CBL is most likely not due to post-photosynthetic fractionations but rather to the treatment effect on leaf gas exchange and TE.
Leaf carbon isotopic composition across drought experiments
In both species, δ13CBL in water-limited plants consistently showed lower values by 0.9–1.1‰ than in the well-watered plants. Previous studies also have found a difference in δ13CBL values between well-watered and water-limited plants of 0.2–0.6‰, which probably depended on the type, severity, or duration of the reduction in water availability (; ; ; ; ). Nonetheless, the consistent depletion in 13C in response to water limitations persisted across C4 species and experiments, lending further evidence that decreased gs is driving the response in δ13CBL. Additionally, found that δ13CBL in C4 maize was under genetic control, giving support to the potential use of δ13CBL as a genetic screen for TE. However, further research is needed to determine the degree to which δ13CBL can be used to detect subtle differences in TE in C4 plants, if δ13CBL is under similar genetic control as TE, and if it can be used to screen for TE across genotypes.
Transpiration efficiency estimated from leaf carbon isotopic composition
Transpiration efficiency (TEw) calculated from δ13CBL correlated strongly with leaf-level gas exchange measurements of gs and TEintrinsic (Anet/gs). Therefore, calculating TEw based on Ci/Ca estimated from δ13CBL accurately reflected differences in gs between treatments. However, in S. viridis, TEplant was more highly correlated with TEintrinsic and TEinstantaneous than in S. italica. This may be because the short and bushy S. viridis has proportionally more leaf biomass than the upright S. italica, so leaf characteristics would have a greater influence on plant-level estimates of TE (e.g. TEplant) in S. viridis than in S. italica. Nonetheless, for both species, δ13CBL reflected differences in both whole-plant and leaf-level estimates of TE.
Leaf water enrichment
In Setaria viridis, Δ18OLW formed a negative relationship with E as expected based on the Péclet model. In the Péclet model, the Péclet number is proportional to E and L, so a positive relationship between Δ18OLW and E requires L to remain constant across individuals or treatments. L differed only slightly between treatments, and this did not remove the relationship between Δ18OLW and f (1−Δ18OLW/Δ18Oe) with E, showing evidence that the Péclet model best describes leaf water isotopic composition (Supplementary Fig. S1 and Fig. 4). The expected relationship existed for S. viridis, lending strength to the possible use of leaf oxygen isotopic composition as a proxy of E.
Contrary to S. viridis, Δ18OLW and E did not form a significant relationship in S. italica, and Δ18OLW values were more enriched than Δ18Oe. One potential reason for this disparity in results between the two species is that leaf temperature differed between treatments and across the range of leaf temperature. High transpiration rate can change Δ18OLW and subsequently Δ18OBL by decreasing leaf temperature through evaporative cooling. Both ε+ and ei (and therefore ea/ei) are temperature-dependent (; ). In the experiment with S. italica, the maximum difference in leaf temperature across the treatments was less than 2 °C (); Δ18Oe of leaves of water-limited plants would only increase by ~0.6‰, and Δ18OLW, being partly composed of Δ18Oe, would change by a fraction of 0.6‰. If leaf temperature in S. viridis differed less than 2 °C, as previously observed with S. italica (), then the temperature difference between treatments would be insufficient to explain the difference in Δ18OLW observed in S. viridis. As for S. italica, Δ18OLW values showed the opposite trend as would be expected if the differences were based on leaf temperature. Therefore, the relationship between Δ18OLW and E in S. viridis suggests a Péclet effect in S. viridis but not in S. italica.
A possible reason why E does not affect the mixing of source water with water from the sites of evaporation in S. italica (as described in the Péclet model and observed in S. viridis) may be because Δ18OLW increases with leaf length in C4 grasses (). In S. italica, longer leaf length in well-watered plants than in water-limited plants apparently increased Δ18OLW values sufficiently to mask the expected relationship between Δ18OLW and E. This effect of leaf length was strong enough that Δ18OBL was positively correlated with E and gs. Enrichment up the leaf blade, described as the longitudinal Péclet effect, occurs because the xylem water being supplied to the sites of evaporation becomes progressively more enriched from the base to the tip of the leaf blade (). Therefore, relative to source water entering the leaf base, the water at the sites of evaporation is enriched above what can be attributed to E. In contrast, the treatment difference in leaf length in S. viridis was minimal and insufficient to mask the transpiration-derived differences in Δ18OLW.
Bulk leaf enrichment and E
According to theory, bulk leaf enrichment (Δ18OBL) should reflect the isotopic signature of leaf water in which bulk tissue is synthesized (; ). As expected, a weak but significant positive relationship between Δ18OLW and Δ18OBL was found in S. viridis, but this relationship did not translate into a significant difference in Δ18OBL between treatments or significant correlations of Δ18OBL with measures of gas exchange or growth. Three possibilities exist that may explain this pattern. First, the relationship between Δ18OLW and E primarily exists because of the longitudinal or xylem Péclet effect and not the mesophyll/lamina or radial Péclet effect. Therefore, the oxygen isotope signature of lamina water that is passed onto organic molecules may have little E-related enrichment, so the relationship between Δ18OLW and E would not be passed onto the bulk leaf tissue (). Second, Δ18OLW was measured once, and a single measurement may not capture all variation in E and climatic conditions such as δ18Ov, relative humidity, and leaf temperature over the leaf lifespan, which can be difficult to control or account for precisely even in a controlled environment setting (; ). Third, leaf length would not affect Δ18OBL as much as Δ18OLW because Δ18OBL would be driven principally by Δ18OLW early in leaf construction when oxygen isotope exchange between water and sucrose takes place. Nevertheless, the magnitude of this non-significant difference between treatments was similar to what has been reported in other studies (; ). The oxygen isotopic composition of other plant organs has been proposed as proxies because they produced stronger correlations with grain yield than δ18OBL (). However, it is necessary to understand how the leaf oxygen isotope enrichment that is related to E is passed onto these organs before their δ18O can be used an effective proxy for E.
Another problem that can obscure the relationship that Δ18OLW and Δ18OBL have with E is misidentifying source water (δ18OS) used to calculate Δ18OLW and Δ18OBL. In this study, we measured the isotopic signature of three possible source waters: (i) irrigation water, (ii) mean soil water, and (iii) root crown water. Isotopically soil and root crown water were statistically indistinguishable, confirming previous studies that there is little fractionation of oxygen isotopes upon uptake by roots, so root crown water is a good representation of δ18OS at the time of water collection (). Irrigation water does not reflect source water in water limitation studies because it undergoes evaporative enrichment, creating isotopically distinct soil water pools for each treatment. As a result, differences in Δ18OLW and Δ18OBL between treatments could simply be an artefact of incorrectly identifying δ18OS, and not because of other physiological traits or environmental factors. Therefore, care must be taken to define the real source water of leaves.
Conclusion
Leaf δ13C had strong relationships with E, gs, water use, aboveground biomass production, and all measures of TE. Although the variation in δ13CBL was less than that in C3 species, the overall consistency of the signal between well-watered and water-limited plants suggests that δ13CBL may be an effective tool for distinguishing between well-watered and water-limited plants. However, more research is needed to determine if δ13CBL can be used to detect differences in TE and gs across more similar genotypes and serve as an effective proxy of TE in high throughput phenotyping across a range of field growth conditions. Alternatively, the use of Δ18OBL as a proxy for transpiration rate in the C4 grass Setaria is problematic for three reasons. First, source water can be isotopically variable across time and different between treatment conditions, making accurate calculations of Δ18OLW and Δ18OBL difficult. Furthermore, assuming that both well-watered and water-limited plants have the same δ18OS may lead to erroneous implications for differences in E. Second, either a small mesophyll Péclet effect where organic molecules are synthesized or leaf water oxygen exchange with lamina water in sucrose synthesis was not sufficient to pass the leaf water isotopic signature on to that of bulk leaf tissue, so that the subtle differences in Δ18OBL across a gradient of E were weak. Finally, changes in leaf size in response to water limitations appeared to mask the expected relationship of Δ18OLW and Δ18OBL with E.
Supplementary data
Supplementary data are available at JXB online.
Fig. S1. The relationship between proportional deviation of leaf water (Δ18OLW) from evaporative site water (Δ18Oe) oxygen isotopic enrichment (f) and transpiration rate (E).
Table S1. F values, numerator degrees of freedom (ndf), denominator degrees of freedom (ddf) and P values from two-way ANOVA of the effects of a differential irrigation treatment and collection period on plant water use and growth, leaf water relations, and isotopic composition for S. viridis.
Table S2. Plant water relations, growth, and isotopic composition of S. viridis grown under well-watered and water-limited conditions and harvested during three collection periods.
Table S3. F values, numerator degrees of freedom (ndf), denominator degrees of freedom (ddf) and P values from one-way ANOVA of the effects of a differential irrigation treatment on plant water use and growth, leaf water relations, and isotopic composition for S. italica.
Table S4. Plant water relations, growth, and stable isotopes of S. italica grown under well-watered, moderately and severely water-limited treatments and harvested during two collection periods.
Table S5. Correlations between measured parameters of both well-watered and water-limited plants and leaf water enrichment (Δ18OLW), bulk leaf enrichment (Δ18OBL), and δ13C for S. viridis.
Table S6. Correlations of measured parameters with δ13C, Δ18OLW, and Δ18OBL for S. italica.
Acknowledgements
This work was supported by the Office of Biological and Environmental Research in the Department of Energy Office of Science (DE-SC0008769).
Appendix: Theory behind the relationship of δ18OLW, δ18OBL, and transpiration
Transpiration has been shown to affect the leaf water oxygen isotope composition (δ18OLW) in three different ways. The first two deal with the role that transpiration plays in modifying the evaporative environment under which leaf water becomes enriched. At the sites of evaporation near the stomates, the water undergoing evaporation becomes enriched in 18O relative to the source water entering the leaf via the xylem. The third way considers the effect that transpiration has on the quantitative contribution of enriched water at the sites of evaporation (δ18Oe) to δ18OLW.
Leaf water isotopic composition (δ18OLW) can be considered a mixture of source water in the xylem (δ18OS) and water from the sites of evaporation and mesophyll (δ18Oe):
where f is the fraction of unenriched water in leaf veins. By expressing the oxygen isotopic composition in leaf water as enrichment above source water (Δ18OLW), any differences between in source water between leaves is accounted for and only changes in enrichment of 18O within the leaf are considered:
Equation S1 can be expressed in terms of enrichments of 18O, where Δ18OLW is equal to the proportional contribution of oxygen isotope enrichment in water from the sites of evaporation (Δ18Oe) to Δ18OLW (; ):
Considering Eq. A3, Δ18OLW can vary across a gradient of E if either Δ18Oe or the proportional contribution of Δ18Oe (1−f) represented in the leaf changes with E.
The two ways in which Δ18Oe itself can be influenced by E are based on the effect that E has on leaf temperature and the resulting effect that changing leaf temperature has on the equilibrium fractionation (ε+) and intercellular air vapor mole fraction (ei) when ea remains constant:
This, in turn, influences Δ18OLW (Eq S3). Δ18Oe is assumed to follow the Craig–Gordon model and can be derived from ε+, the ambient to intercellular air vapor mole fraction (ea/ei), the kinetic fractionation (εk), and air vapor enrichment (Δ18Ov) (; ; ). Based on this equation, increasing gs and subsequently E can either dry the intercellular area or increase ε+ by decreasing leaf temperature (TL), both of which increase Δ18Oe. This because ε+ is inversely related to TL:
E can decrease leaf temperature by increasing evaporative cooling and consequently increase ε+ (). Ascribing changes in Δ18Oe to variation in E assumes that Δ18Ov and ea remain constant.
Contrastingly, εk is inversely proportional to the stomatal (gs) and boundary layer (gbl) conductances, so increasing gs decreases εk:
The third way in which E can change Δ18Oe and consequently Δ18OLW is by modifying the contribution (1−f in Eq. A3) of Δ18Oe to Δ18OLW. The Péclet model was developed to explain how Δ18OLW values were often lower than Δ18Oe values, meaning that something is influencing Δ18OLW other than the evaporative enrichment (). It describes the extent to which the advection of relatively unenriched xylem water mixes with enriched water from the sites of evaporation. This depends on the Péclet number (ρ), which is proportional to E and the effective path length (L) that water takes to move from the veins to the sites of evaporation, and inversely proportional to the molar density of water (C) and the diffusivity of H218 O in water (D) (; ; ; ; ; ):
ρ is then related to Δ18OLW according to:
If L remains constant, then ρ increases with E, meaning that back diffusion of water from sites of evaporation decreases relative to the advection of unenriched water from the xylem to the sites of evaporation. Simply stated, the relative contribution of Δ18Oe to Δ18OLW decreases, and Δ18OLW decreases with increasing E, assuming that L remains constant.
Bulk leaf enrichment above source water (Δ18OBL) reflects both Δ18OLW, the biochemical fractionation during the synthesis of organic compounds, and the degree of oxygen exchange during synthesis of cellulose (; ; ; ):
Where pex is the proportion of exchangeable oxygen in cellulose being formed from glucose, px is the proportion of source water at the site of cellulose/tissue synthesis, εwc is the biochemical fractionation factor during the carbonyl oxygen exchange with water during cellulose synthesis, and εcp is the isotopic difference between cellulose and whole tissue. This equation assumes a constant εcp, although this factor may vary among leaves and with leaf age . Therefore, in the scenario where Δ18OLW varies across a gradient of E, Δ18OBL integrates this variation over the period of leaf construction. In this case, Δ18OBL may be used as a proxy for E during leaf growth (; ).
The concept behind the Péclet effect theory that the proportional deviation of Δ18OLW from Δ18Oe (f in Eq. A3) increases along a gradient of E has failed to be observed in several studies (; ; ; ; ). The failure to find this relationship in many instances has been explained by changes in factors such as TL and ei with E, as discussed above and (,, ; ). found that the two-pool model proposed by better described the response in Δ18OLW to environmental conditions in upland cotton (Gossypium hirsutum) than the Péclet model. Additionally, the assumption that L is constant for species and across a gradient of transpiration rates has not always been supported (; ). If L does not remain constant across a range of E, then it obscures any relationship that may exist between E and Δ18OLW or Δ18OBL.
Vein density and vein volume fraction affect the enrichment of leaf water because of the strong Péclet effect within the xylem (; ; ; ). This Péclet has been called the longitudinal or xylem Péclet and is greater in magnitude than the radial or mesophyll Péclet (; ; ). Vein volume fraction increases the relative importance of xylem water in Δ18OLW, which makes the influence of the xylem Péclet increasingly measureable in Δ18OLW. This means that the xylem and not the mesophyll may be the location of the Péclet effect (). Since the mesophyll is where sugars are synthesized, this may explain why the oxygen isotope signature of leaf water is not always reflected in bulk leaf tissue.
References
- Araus JL, Cabrera-Bosquet L, Serret MD, Bort J, Nieto-Taladriz MT. 2013. Comparative performance of δ13C, δ18O and δ15N for phenotyping durum wheat adaptation to a dryland environment. Functional Plant Biology40, 595–608.
- Barbour MM. 2007. Stable oxygen isotope composition of plant tissue: a review. Functional Plant Biology34, 83–94.
- Barbour MM, Farquhar GD. 2000. Relative humidity-and ABA-induced variation in carbon and oxygen isotope ratios of cotton leaves. Plant, Cell & Environment23, 473–485.
- Barbour MM, Farquhar GD. 2004. Do pathways of water movement and leaf anatomical dimensions allow development of gradients in H218 O between veins and the sites of evaporation within leaves?Plant, Cell & Environment27, 107–121.
- Barbour MM, Fischer RA, Sayre KD, Farquhar GD. 2000a. Oxygen isotope ratio of leaf and grain material correlates with stomatal conductance and grain yield in irrigated wheat. Functional Plant Biology27, 625–637.
- Barbour MM, Roden JS, Farquhar GD, Ehleringer JR. 2004. Expressing leaf water and cellulose oxygen isotope ratios as enrichment above source water reveals evidence of a Péclet effect. Oecologia138, 426–435.
- Barbour MM, Schurr U, Henry BK, Wong SC, Farquhar GD. 2000b. Variation in the oxygen isotope ratio of phloem sap sucrose from castor bean. Evidence in support of the Péclet effect. Plant Physiology123, 671–680.
- Bennetzen JL, Schmutz J, Wang H, et al. 2012. Reference genome sequence of the model plant Setaria. Nature Biotechnology30, 555–561.
- Bindu Madhava H, Sheshshayee MS, Devendra R, Prasad TG, Udayakumar M. 1999. Oxygen (18O) isotopic enrichment in the leaves as a potential surrogate for transpiration and stomatal conductance. Current Science76, 1427–1428.
- Brenna JT, Corso TN, Tobias HJ, Caimi RJ. 1997. High-precision continuous-flow isotope ratio mass spectrometry. Mass Spectrometry Reviews16, 227–258.
- Brück H, Payne WA, Sattelmacher B. 2000. Effects of phosphorus and water supply on yield, transpirational water-use efficiency, and carbon isotope discrimination of pearl millet. Crop Science40, 120–125.
- Brutnell TP, Wang L, Swartwood K, Goldschmidt A, Jackson D, Zhu XG, Kellogg E, Van Eck J. 2010. Setaria viridis: a model for C4 photosynthesis. The Plant Cell22, 2537–2544.
- Cabrera-Bosquet L, Albrizio R, Nogués S, Araus JL. 2011. Dual Δ13C/δ18O response to water and nitrogen availability and its relationship with yield in field-grown durum wheat. Plant, Cell & Environment34, 418–433.
- Cabrera-Bosquet L, Molero G, Nogués S, Araus JL. 2009a. Water and nitrogen conditions affect the relationships of Δ13C and Δ18O to gas exchange and growth in durum wheat. Journal of Experimental Botany60, 1633–1644.
- Cabrera-Bosquet L, Sánchez C, Araus JL. 2009b. How yield relates to ash content, Δ13C and Δ18O in maize grown under different water regimes. Annals of Botany104, 1207–1216.
- Cabrera-Bosquet L, Sánchez C, Araus JL. 2009c. Oxygen isotope enrichment (Δ18O) reflects yield potential and drought resistance in maize. Plant, Cell & Environment32, 1487–1499.
- Cernusak LA, Barbour MM, Arndt SK, et al. 2016. Stable isotopes in leaf water of terrestrial plants. Plant, Cell & Environment39, 1087–1102.
- Cernusak LA, Farquhar GD, Pate JS. 2005. Environmental and physiological controls over oxygen and carbon isotope composition of Tasmanian blue gum, Eucalyptus globulus. Tree physiology25, 129–146.
- Cernusak LA, Ubierna N, Winter K, Holtum JA, Marshall JD, Farquhar GD. 2013. Environmental and physiological determinants of carbon isotope discrimination in terrestrial plants. New Phytologist200, 950–965.
- Cernusak LA, Wong SC, Farquhar GD. 2003. Oxygen isotope composition of phloem sap in elation to leaf water in Ricinus communis. Functional Plant Biology30, 1059–1070.
- Condon AG, Richards RA, Rebetzke GJ, Farquhar GD. 2004. Breeding for high water-use efficiency. Journal of Experimental Botany55, 2447–2460.
- Craig H, Gordon LI. 1965. Deuterium and oxygen-18 variations in the ocean and the marine atmosphere. In: Tongiorgi E, ed. Proceedings of Conference on stable isotopes in oceanographic studies and paleotemperatures, Spoleto, 1965. Pisa: Consiglio Nazionale Delle Ricerche, Laboratorio di Geologia Nucleare, 9–130.
- Dongmann G, Nürnberg HW, Förstel H, Wagener K. 1974. On the enrichment of H218 O in the leaves of transpiring plants. Radiation and Environmental Biophysics11, 41–52.
- Doust AN, Kellogg EA, Devos KM, Bennetzen JL. 2009. Foxtail millet: a sequence-driven grass model system. Plant Physiology149, 137–141.
- Duranceau M, Ghashghaie J, Badeck F, Deleens E, Cornic G. 1999. δ13C of CO2 respired in the dark in relation to δ13C of leaf carbohydrates in Phaseolus vulgaris L. under progressive drought. Plant, Cell & Environment22, 515–523.
- Ellsworth PZ, Cousins AB. 2016. Carbon isotopes and water use efficiency in C4 plants. Current Opinion in Plant Biology31, 155–161.
- Ellsworth PZ, Wang M, Zhou J, Cousins AB, Sankaran S. 2016. Evaluation of water-use efficiency in foxtail millet (Setaria italica) using visible-near infrared and thermal spectral sensing techniques. Talanta152, 531–539.
- Ellsworth PZ, Williams DG. 2007. Hydrogen isotope fractionation during water uptake by woody xerophytes. Plant and Soil291, 93–107.
- Farquhar GD, Barbour MM, Henry BK. 1998. Interpretation of oxygen isotope composition of leaf material. In Griffiths H, ed. Stable isotopes: integration of biological, ecological, and geochemical processes. Oxford: BIOS Scientific Publishers Ltd, 27–48.
- Farquhar GD, Gan KS. 2003. On the progressive enrichment of the oxygen isotopic composition of water along a leaf. Plant, Cell & Environment26, 1579–1597.
- Farquhar GD, Hubick KT, Condon AG, Richards RA. 1989. Carbon isotope fractionation and plant water-use efficiency. In: Rundel PW, Ehleringer JR, Nagy KA, eds. Stable isotopes in ecological research. New York: Springer, 21–40.
- Farquhar GD, Lloyd J. 1993. Carbon and oxygen isotope effects in the exchange of carbon dioxide between terrestrial plants and the atmosphere. In: Ehleringer JR, Hall AE, Farquhar GD, eds. Stable isotopes and plant carbon–water relations, San Diego: Academic Press, 47–70.
- Farquhar GD, Richards RA. 1984. Isotopic composition of plant carbon correlates with water-use efficiency of wheat genotypes. Functional Plant Biology11, 539–552.
- Flanagan LB, Comstock JP, Ehleringer JR. 1991. Comparison of modeled and observed environmental influences on the stable oxygen and hydrogen isotope composition of leaf water in Phaseolus vulgaris L. Plant Physiology96, 588–596.
- Furbank RT, von Caemmerer S, Price GD. 2013. CO2-concentrating mechanisms in crop plants to increase yield. Applying photosynthesis research to improvement of food crops. ACIAR Proceedings140, 130–137.
- Gan KS, Wong SC, Yong JWH, Farquhar GD. 2003. Evaluation of models of leaf water 18O enrichment using measurements of spatial patterns of vein xylem water, leaf water and dry matter in maize leaves. Plant, Cell & Environment26, 1479–1495.
- Gates DM. 1968. Transpiration and leaf temperature. Annual Review of Plant Physiology19, 211–238.
- Gehre M, Strauch G. 2003. High-temperature elemental analysis and pyrolysis techniques for stable isotope analysis. Rapid Communications in Mass Spectrometry17, 1497–1503.
- Ghannoum O, von Caemmerer S, Conroy JP. 2002. The effect of drought on plant water use efficiency of nine NAD-ME and nine NADP-ME Australian C4 grasses. Functional Plant Biology29, 1337–1348.
- Gonfiantini R. 1978. Standards for stable isotope measurements in natural compounds. Nature271, 534–536.
- Gresset S, Westermeier P, Rademacher S, Ouzunova M, Presterl T, Westhoff P, Schön CC. 2014. Stable carbon isotope discrimination is under genetic control in the C4 species maize with several genomic regions influencing trait expression. Plant Physiology164, 131–143.
- Helliker BR, Ehleringer JR. 2000. Establishing a grassland signature in veins: 18O in the leaf water of C3 and C4 grasses. Proceedings of the National Academy of Sciences, USA97, 7894–7898.
- Henderson SA, von Caemmerer S, Farquhar GD. 1992. Short-term measurements of carbon isotope discrimination in several C4 species. Functional Plant Biology19, 263–285.
- Henderson S, von Caemmerer S, Farquhar GD, Wade L, Hammer G. 1998. Correlation between carbon isotope discrimination and transpiration efficiency in lines of the C4 species Sorghum bicolor in the glasshouse and the field. Functional Plant Biology25, 111–123.
- Hobbie EA, Werner RA. 2004. Tansley review: Intramolecular, compound-specific, and bulk carbon isotope patterns in C3 and C4 plants: a review and synthesis. New Phytologist161, 371–385.
- Holloway-Phillips M, Cernusak LA, Barbour M, Song X, Cheesman A, Munksgaard N, Stuart-Williams H, Farquhar GD. 2016. Leaf vein fraction influences the Péclet effect and 18O enrichment in leaf water. Plant, Cell & Environment39, 2414–2427.
- Kromdijk J, Ubierna N, Cousins AB, Griffiths H. 2014. Bundle-sheath leakiness in C4 photosynthesis: a careful balancing act between CO2 concentration and assimilation. Journal of Experimental Botany65, 3443–3457.
- Li P, Brutnell TP. 2011. Setaria viridis and Setaria italica, model genetic systems for the Panicoid grasses. Journal of Experimental Botany62, 3031–3037.
- Li Y, Wu S. 1996. Traditional maintenance and multiplication of foxtail millet (Setaria italica (L.) P. Beauv.) landraces in China. Euphytica87, 33–38.
- Loucos KE, Simonin KA, Song X, Barbour MM. 2015. Observed relationships between leaf H218 O Péclet effective length and leaf hydraulic conductance reflect assumptions in Craig–Gordon model calculations. Tree Physiology35, 16–26.
- Melzer E, O’leary MH. 1987. Anapleurotic CO2 fixation by phosphoenolpyruvate carboxylase in C3 plants. Plant Physiology84, 58–60.
- Monneveux P, Sheshshayee MS, Akhter J, Ribaut JM. 2007. Using carbon isotope discrimination to select maize (Zea mays L.) inbred lines and hybrids for drought tolerance. Plant Science173, 390–396.
- Qi H, Coplen TB, Geilmann H, Brand WA, Böhlke JK. 2003. Two new organic reference materials for δ13C and δ15N measurements and a new value for the δ13C of NBS 22 oil. Rapid Communications in Mass Spectrometry17, 2483–2487.
- Qi H, Coplen TB, Tarbox L, Lorenz JM, Scholl M. 2014. USGS48 Puerto Rico precipitation – a new isotopic reference material for δ2H and δ18O measurements of water. Isotopes in Environmental and Health Studies50, 442–447.
- R Core Team. 2013. R: A language and environment for statistical computing. Vienna: R Foundation for Statistical Computing.
- Roden J, Kahmen A, Buchmann N, Siegwolf R. 2015. The enigma of effective path length for 18O enrichment in leaf water of conifers. Plant, Cell & Environment38, 2551–2565.
- Roden J, Siegwolf R. 2012. Is the dual-isotope conceptual model fully operational?Tree Physiology32, 1179–1182.
- Roden JS, Ehleringer JR. 1999. Observations of hydrogen and oxygen isotopes in leaf water confirm the Craig-Gordon model under wide-ranging environmental conditions. Plant Physiology120, 1165–1174.
- Roden JS, Farquhar GD. 2012. A controlled test of the dual-isotope approach for the interpretation of stable carbon and oxygen isotope ratio variation in tree rings. Tree Physiology32, 490–503.
- Sage RF. 2014. Stopping the leaks: new insights into C4 photosynthesis at low light. Plant, Cell & Environment37, 1037–1041.
- Saliendra NZ, Meinzer FC, Perry M, Thom M. 1996. Associations between partitioning of carboxylase activity and bundle sheath leakiness to CO2, carbon isotope discrimination, photosynthesis, and growth in sugarcane. Journal of Experimental Botany47, 907–914.
- Sánchez-Bragado R, Araus JL, Scheerer U, Cairns JE, Rennenberg H, Ferrio JP. 2016. Factors preventing the performance of oxygen isotope ratios as indicators of grain yield in maize. Planta243, 355–368.
- Schneider CA, Rasband WS, Eliceiri KW. 2012. NIH Image to ImageJ: 25 years of image analysis. Nature Methods9, 671–675.
- Sheshshayee MS, Bindumadhava H, Ramesh R, Prasad TG, Lakshminarayana MR, Udayakumar M. 2005. Oxygen isotope enrichment (Δ18O) as a measure of time-averaged transpiration rate. Journal of Experimental Botany56, 3033–3039.
- Sheshshayee MS, Bindumadhava HR, Ramesh R, Prasad TG, Udayakumar M. 2010. Relationship between 18O enrichment in leaf biomass and stomatal conductance. Isotopes in Environmental and Health Studies46, 122–129.
- Song X, Barbour MM, Farquhar GD, Vann DR, Helliker BR. 2013. Transpiration rate relates to within- and across-species variations in effective path length in a leaf water model of oxygen isotope enrichment. Plant, Cell & Environment36, 1338–1351.
- Song X, Loucos KE, Simonin KA, Farquhar GD, Barbour MM. 2015. Measurements of transpiration isotopologues and leaf water to assess enrichment models in cotton. New Phytologist206, 637–646.
- Sternberg LDSL, Deniro MJ, Savidge RA. 1986. Oxygen isotope exchange between metabolites and water during biochemical reactions leading to cellulose synthesis. Plant Physiology82, 423–427.
- Sun W, Ubierna N, Ma JY, Cousins AB. 2012. The influence of light quality on C4 photosynthesis under steady-state conditions in Zea mays and Miscanthus × giganteus: changes in rates of photosynthesis but not the efficiency of the CO2 concentrating mechanism. Plant, Cell & Environment35, 982–993.
- Tcherkez G, Farquhar GD. 2005. Viewpoint: Carbon isotope effect predictions for enzymes involved in the primary carbon metabolism of plant leaves. Functional Plant Biology32, 277–291.
- Tcherkez G, Nogués S, Bleton J, Cornic G, Badeck F, Ghashghaie J. 2003. Metabolic origin of carbon isotope composition of leaf dark-respired CO2 in French bean. Plant Physiology131, 237–244.
- Ubierna N, Sun W, Cousins AB. 2011. The efficiency of C4 photosynthesis under low light conditions: assumptions and calculations with CO2 isotope discrimination. Journal of Experimental Botany62, 3119–3134.
- Ubierna N, Sun W, Kramer DM, Cousins AB. 2013. The efficiency of C4 photosynthesis under low light conditions in Zea mays, Miscanthus × giganteus and Flaveria bidentis. Plant, Cell & Environment36, 365–381.
- Vendramini PF, Sternberg LDAS. 2007. A faster plant stem-water extraction method. Rapid communications in mass spectrometry21, 164–168.
- von Caemmerer S, Ghannoum O, Pengelly JJ, Cousins AB. 2014. Carbon isotope discrimination as a tool to explore C4 photosynthesis. Journal of Experimental Botany65, 3459–3470.
- Yakir D. 1992. Variations in the natural abundance of oxygen-18 and deuterium in plant carbohydrates. Plant, Cell & Environment15, 1005–1020.
- Yousfi S, Serret MD, Márquez AJ, Voltas J, Araus JL. 2012. Combined use of δ¹³C, δ18O and δ15N tracks nitrogen metabolism and genotypic adaptation of durum wheat to salinity and water deficit. New Phytologist194, 230–244.