
Introduction
In vertebrates, the process of taste transduction occurs in cells of taste buds that are mainly located in the tongue epithelium. Taste buds are onion‐shaped clusters of about 50–100 elongated epithelial cells that extend from the basal lamina to the surface of the tongue, where a pore allows the apical part of taste cells to directly contact chemicals dissolved in the mouth saliva. Taste buds also contain basal cells that will form new taste cells. In several species, at least three main types of elongated taste cells have been identified and named type I, II or III. These cell types can be distinguished based on their ultrastructural morphology, expression of specific proteins and functional properties. Type II and type III cells express taste receptors and respond to tastants, while type I cells mainly have glial‐like functions. Type I cells have also been suggested to be involved in salt transduction because they express amiloride‐sensitive Na+ channels (Vandenbeuch et al. ; Roper & Chaudhari, ; Baumer‐Harrison et al. ; Yang et al. ), but a recent study demonstrated that amiloride‐sensitive salt taste is transmitted to the nervous system by a unique cell type that expresses the ATP release channel CALHM1/3 and voltage‐gated Na+ channels, neither of which are found in type I taste cells (Nomura et al. ).
Type II cells express G protein‐coupled receptors for sweet (TAS1R2–TAS1R3), umami (TAS1R1–TAS1R3) or bitter (TAS2Rs) detection and use at least one common transduction cascade that involves the G‐protein alpha subunit gustducin (GNAT3), phospholipase‐C‐beta‐2 (PLCβ2), inositol‐3‐phosphate (IP3) and Ca2+ release from intracellular stores (Zhang et al. ; Hisatsune et al. ). The increased intracellular Ca2+ concentration activates TRPM5 and TRPM4, causing membrane depolarization by Na+ entry and release of ATP through voltage‐gated CALHM1/CALHM3 channels (Dutta Banik et al. ; Ma et al. ).
Type III cells mediate sour detection through the apical ion channel OTOP1 that allows entry of H+ and cell membrane depolarization, which is further amplified by the block of the inwardly rectifier K+ channel KCNJ2 by low pH (Ye et al. ; Tu et al. ; Teng et al. ). Type III is the only taste cells that form canonical synapses with afferent nerve fibres. They express the presynaptic synaptosomal‐associated protein 25 (SNAP25), the glutamic acid decarboxylase 67 (GAD67) and voltage‐gated Ca2+ channels, which trigger the release of neurotransmitters (Yang et al. ; DeFazio et al. ; Tomchik et al. ; Huang et al. ; Vandenbeuch et al. ).
Type I cells are called ‘glial‐like’ cells and are mainly considered to have a supporting role in the taste buds. These cells have projections that wrap around other cells and express proteins involved in removing neurotransmitters, such as the ectonucleotidase NTPDase2 (encoded by Entpd2) and the glutamate transporter GLAST (Lawton et al. ; Bartel et al. ). Moreover, the inwardly rectifier K+ channel KCNJ1 (also named Kir1.1 or renal outer medullary K, ROMK) is expressed at the apical tips of type I cells and may be involved in K+ homeostasis (Dvoryanchikov et al. ).
The three cell types can also be identified by their electrophysiological fingerprint. Indeed, by using voltage‐clamp whole‐cell recordings in pseudo‐physiological solutions, type I cells are characterized by the presence of voltage‐gated outward K+ currents and no inward currents, type II cells by voltage‐gated inward Na+ currents and voltage‐gated outward non‐selective currents, and type III cells by voltage‐gated inward Na+ and Ca2+ currents and by voltage gated‐outward K+ currents (Medler et al. ; Clapp et al. ; Romanov & Kolesnikov, ; Romanov et al. ; Taruno et al. ).
Multiple chloride conductances, including Ca2+‐dependent Cl– currents, have been recorded in some taste cells (McBride & Roper, ; Taylor & Roper, ; Wladkowski et al. ; Herness & Sun, ; Kim et al. ; Cherkashin et al. ). Kim et al. () clearly demonstrated that a subpopulation of unidentified taste cells had Ca2+‐activated Cl– currents and that extracellular ATP could indirectly activate these channels by intracellular Ca2+ increase through activation of P2Y receptors. Ca2+‐activated Cl– channels are encoded by two proteins of the TMEM16 family, TMEM16A and TMEM16B (also named Ano1 and Ano2, respectively). They share several electrophysiological properties such as ionic permeability and voltage dependence but can be functionally distinguished by different Ca2+ sensitivity and pharmacological profile (Caputo et al. ; Schroeder et al. ; Yang et al. ; Stephan et al. ; Stöhr et al. ; Pifferi et al. a; Scudieri et al. ; Pedemonte & Galietta, ). Cherkashin et al. () confirmed and extended previous results from Kim et al. () showing that the population of taste cells generating Ca2+‐activated Cl– currents in response to P2Y agonists largely consisted of type I cells, but that also some type II cells exhibited small Ca2+‐activated Cl– currents. They indicated that TMEM16B was functional in type I cells, TMEM16A and TMEM16B produced small currents in type II cells, while type III cells did not exhibit any Ca2+‐activated Cl– current.
Here, by taking advantage of Tmem16a and Tmem16b knockout (KO) mice models (Rock et al. ; Zhang et al. ) and of a recently discovered specific blocker of TMEM16A, Ani‐9 (Seo et al. ), we re‐examined the functional expression of the two Ca2+‐dependent Cl– channels of the TMEM16 family in taste cells of vallate papillae by using electrophysiological recordings and immunohistochemistry. Surprisingly, we found that only TMEM16A, and not TMEM16B, is expressed in taste buds. In particular, TMEM16A is largely colocalized with the inwardly rectifier K+ channel KCNJ1 at the apical portion of type I cells. Moreover, by using patch‐clamp whole‐cell recordings, we functionally measured TMEM16A‐mediated currents only in type I and not in type II cells. We then investigated whether TMEM16A‐mediated currents in type I cells could be activated by extracellular ATP, a well‐known transmitter released by type II cells in taste buds and found that ATP induced Ca2+‐activated Cl– currents that were blocked by Ani‐9, further confirming that they were due to TMEM16A channels. We conclude that TMEM16A, but not TMEM16B, plays a role in taste buds.
Although type I cells make up more than 50% of the cells in each taste bud and are known to have glial‐like functions, they have often been overlooked in favour of studies on type II and III cells. A complete knowledge of the functional ion channels of type I cells will help to understand additional roles that these cells may play in taste buds. Although further studies are required to determine the physiological role of TMEM16A in taste buds, we discuss some possible scenarios.
Methods
Animals and ethical approval
Mice were handled according to the guidelines of the Italian Animal Welfare Act (Decreto legislativo 26/2014/) and European Union guidelines on animal research (2010/63) under a protocol approved by the Italian Ministry of Health. Mice had free access to water and food. Every effort was made to reduce the number of animals used. Adult (> 8 weeks) mice were anaesthetized with CO2 and decapitated before tongue and nose removal. Mice were transferred to a cage (8 × 10 × 12 cm, height/width/length) and 100% CO2 was slowly injected into the cage until the animal stopped breathing and no longer displayed pedal reflex (near 3 min, gas flow rate was ∼20% of chamber volume per minute). Young mice, postnatal days 8–10 (P8–P10), were decapitated before tongue removal. Experiments were performed on tissues from both male and female C57BL/6, GAD67‐GFP (Oliva et al. ), Tmem16a KO (Rock et al. ) or mCherry Tmem16b KO mice (Zhang et al. ). Tmem16a KO and wild‐type (WT) littermates were obtained by breeding heterozygous mice. mCherry Tmem16b KO mice were kindly provided by Dr Lily Jan (University of California, San Francisco, USA, Zhang et al. ). The generated Tmem16b‐deficient mice were engineered by inserting mCherry sequence with a farnesylation signal at the C‐terminus (mCherry‐F) in frame with the alternative start ATG codon in the third exon of Tmem16b, and therefore membrane‐associated mCherry marks cells that normally express Tmem16b (see fig. S2C of Zhang et al. ).
Tissue preparation
The epithelium containing the taste papillae was peeled using an enzymatic–mechanical dissociation protocol slightly modified from those previously reported (Béhé et al. ; Bigiani, ; Cherkashin et al. ). Once removed, the tongue was placed in a Sylgard Petri dish filled with a standard mammalian Ringer solution containing (in mM): 140 NaCl, 5 KCl, 2 CaCl2, 1 MgCl2, 10 Hepes, 10 glucose, pH 7.4, with NaOH. Using an insulin syringe, 0.5 ml Ringer solution containing 2 mg ml−1 dispase II (D4693, Sigma, St Louis, MO, USA), 0.2 mg ml−1 elastase (E0127, Sigma) and 0.7 mg ml−1 collagenase B (C9891, Sigma) was injected under the epithelium. The syringe needle was carefully inserted from the posterior to the most anterior part of the tongue. Injection of the enzymatic solution was performed while the needle was gently withdrawn to allow the solution to reach the entire epithelium. After 30 min of incubation, the epithelium was peeled off from the underlying muscle and the vallate papilla and taste cells were isolated as described in the following sections.
RT‐PCR
The vallate papilla was cut from the peeled tongue epithelium and directly placed in the lysis buffer of the mRNA isolation kit (S1550S, New England Biolabs, Ipswich, MA, USA). The olfactory epithelium was isolated as previously described (Pifferi et al. ; Sagheddu et al. ). The olfactory turbinates were exposed by bisecting the head along the midline, the epithelium was carefully removed from turbinates, septum and the roof of the nasal cavity and placed directly in the lysis buffer of the mRNA isolation kit. Vallate papillae mRNA was extracted from four adult C57BL/6 mice and olfactory epithelium mRNA was extracted from two adult C57BL/6 mice. The mRNA isolation kit was used with Oligo d(T)25 magnetic beads for mRNA isolation. After extraction, mRNA was further incubated with DNAase I (M0303S, New England Biolabs) to remove any residual genomic DNA. cDNA was synthesized using the SMARTER cDNA synthesis kit from 25 ng of mRNA (634860, Takara, Shiga, Japan).
PCR was performed in a thermocycler (ThermaCycler2720, Life Technologies, Carlsbad, CA, USA) using Phusion HS II High‐Fidelity DNA Polymerase (F549S, ThermoFisher Scientific, Waltham, MA, USA), 0.2 mM for each dNTPs (N0447S, New England Biolabs) and 200 pmol forward/reverse target‐specific primers. Cycling parameters were: an initial denaturation step (98°C, 2 min) followed by 38 cycles, each of these cycles including a denaturation step (98°C, 10 s), a primer annealing step (62–64°C, 30 s) and an extension step (72°C, 30 s) step. The reaction was completed by a final extension step at 72°C for 5 min.
The following primer sequences were used to amplify target DNAs: Gapdh fwd 5′‐TGCTGAGTATGTCGTGGAGTCT‐3′ rev 5′‐TGCTGTAGCCGTATTCATTGTC‐3′ (Tm = 64°C; 691 bp; GenBank accession no. NM_008084.3); Olfr73 fwd 5′‐GCTGGTATTGGGATCCTATGCTT‐3′ rev 5′‐CGTCCACTTGCTGACTTCATCTT‐3′ (Tm = 62°C; 272 bp; GenBank accession no. NM_054090.1); Tmem16a fwd 5′‐ATGAAGCCAGAGTCTTAGAGAAGT‐3′ rev 5′‐AAACTTCATCCAGCAGAATGAT‐3′ (Tm = 62°C; 296 bp; GenBank accession no. NM_178642.6); Tmem16b fwd 5′‐ATGCACTTTCACGACAACCA‐3′ rev 5′‐GCCCAGCAGCCATCAGGTTG‐3′ (Tm = 62°C; 243 bp; GenBank accession no. NM_001364563.1); Entpd2 fwd 5′‐CTCAAGTATGGCATCGTTCTGG‐3′ rev 5′‐CAGAGACGAGGTCACGACAGAG‐3′ (Tm = 62°C; 834 bp; GenBank accession no. NM_009849.2); Plcβ2 fwd 5′‐TGGAGGTGACAGCTTATGAGGA‐3′ rev 5′‐GGTTGGCAAGGGCTACTGTAAG‐3′ (Tm = 62°C; 842 bp; GenBank accession no. NM_001290790.1); Snap25 fwd 5′‐TGGCATCAGGACTTTGGTTATG‐3′ rev 5′‐GCATCTTTGTTGCACGTTGGT‐3′ (Tm = 62°C; 481 bp; GenBank accession no. NM_001355254.1). The products were visualized following agarose gel electrophoresis (1.5%) and DNA was stained with Midori Green Advance (MG04, Nippon Genetics, Düren, Germany).
Immunohistochemistry
Immunohistochemistry was performed on tongue sections containing the vallate papilla and on olfactory epithelium sections. The dissected tongues were directly fixed in 4% paraformaldehyde in PBS, pH 7.4, for 3–4 h at 4°C. For nose isolation, the lower jaw, the posterior part of the brain and the skinhead were removed. The remaining head, containing the nasal cavity, was fixed in 4% paraformaldehyde in PBS, pH 7.4, for 4–5 h at 4°C and then decalcified in 0.5 M EDTA, pH 8, for 2 days, as previously described (Pifferi et al. , b; Maurya & Menini, ; Maurya et al. ; Henriques et al. ). For cryoprotection, tongue and olfactory tissues were equilibrated overnight in 30% (w/v) sucrose in PBS at 4°C. Tissues were frozen in optimal cutting temperature compound (Bio‐Optica, Milan, Italy) and stored at −80°C before sectioning with a cryostat. Coronal sections (14−16 μm thick) were cut with a cryostat and mounted on Superfrost Plus Adhesion Microscope Slides (ThermoFisher Scientific). Sections were air‐dried for 3 h and stored at −80°C for further use. For antigen retrieval, sections were kept in SDS 0.5% (w/v) in PBS for 15 min at room temperature. After pre‐treatment, sections were incubated in blocking solution [5% (v/v) FBS or donkey serum and 0.3% (v/v) Triton X‐100 in PBS] for 2 h, and then with the primary antibody (diluted in the blocking solution) overnight at 4°C. Slices were then rinsed with PBS and incubated with the chosen fluorophore‐conjugated secondary antibody diluted in PBS‐T (0.1% Tween 20 in PBS) for 2 h at room temperature. After washing with PBS‐T, sections were treated with DAPI (0.2 μg/ml) for 30 min, washed with PBS‐T, and mounted with Vectashield (Vector Laboratories, Burlingame, CA, USA) or Fluoromount‐G (ThermoFisher).
The following primary antibodies (dilution; catalogue number, company) were used: polyclonal rabbit anti‐TMEM16A (1:100; ab53212, Abcam, Cambridge, MA, USA), polyclonal goat anti‐TMEM16A (1:50; sc‐69343, Santa Cruz Biotechnology, Santa Cruz, CA, USA), polyclonal rabbit anti‐TMEM16B (1:200; 20 647‐1‐P; Proteintech, Rosemont, IL, USA), polyclonal rabbit anti‐NTPDase2 (1:500; mN2‐36LI6, from J. Sévigny at Centre de Recherche du CHU de Québec, Université Laval, Quebec http://ectonucleotidases‐ab.com), polyclonal rabbit anti‐KCNJ (1:500; APC‐001, Alomone Labs, Jerusalem, Israel), polyclonal goat anti‐GNAT3 (1:1000; OAEB00418, Aviva Systems Biology, San Diego, CA, USA), polyclonal rabbit anti‐PLCβ2 (1:200; sc‐206, Santa Cruz Biotechnology), polyclonal chicken anti‐GFP (1:200; GTX13970, GeneTex, Irvine, CA, USA), polyclonal rabbit anti‐RFP antibody (1:500, 600‐401‐379, Rockland). The following secondary antibodies were used: donkey anti‐rabbit Alexa Fluor Plus 594 (1:500; A32754, Life Technologies), donkey anti‐goat Alexa Fluor 488 (1:500; A11055, Life Technologies), donkey anti‐rabbit Alexa Fluor 488 (1:500; A21206, Life Technologies), donkey anti‐goat Alexa Fluor Plus 647 (1:500; A32849, Life Technologies), goat anti‐chicken Alexa Fluor 488 (1:500, A‐11 039, Invitrogen, Carlsbad, CA, USA).
Immunofluorescence was visualized with a confocal laser scanning microscope (A1R or C1, Nikon, Tokyo, Japan). Images were acquired using NIS‐Elements Nikon software at 1024 × 1024 pixels resolution and analysed with ImageJ software (National Institute of Health, Bethesda, MD, USA). Control experiments, excluding primary antibodies, were performed for each immunolocalization experiment and gave no signal. In addition, negative control experiments for the polyclonal rabbit anti‐TMEM16A (Fig. 2D) and polyclonal goat anti‐TMEM16A (not shown) were made in vallate papillae from Tmem16a KO mice.
Electrophysiological recordings from taste bud cells
The peeled tongue epithelium was placed upside‐down in a Sylgard Petri dish, in Ca2+‐free Ringer solution containing (in mM): 140 NaCl, 5 KCl, 1 MgCl2, 0.5 EDTA, 10 Hepes, 10 glucose, pH 7.4, with NaOH. After 30 min of incubation, cells were removed from taste buds of the vallate papilla by gentle suction with a flame‐polished glass capillary tube with an opening diameter of 40–50 μm and plated in Petri dishes, precoated with 5 mM Concanavalin‐A (Type V, Sigma, Milan, Italy), for at least 1 h to favour cell adhesion.
Isolated taste cells were continuously perfused with Ringer solution. Cells were viewed with an inverted microscope (IMT‐2 or IX70, Olympus), equipped with 10× and 40× objectives and an additional 1.5× auxiliary lens, and identified by their elongated shape. Whole‐cell membrane currents were recorded at room temperature (21–24°C) in the voltage‐clamp mode, using an Axopatch 200B or a Multiclamp 700B amplifier controlled by Clampex 9 or 10 via a Digidata 1332A (Molecular Devices, Sunnyvale, CA, USA). Patch pipettes were made using borosilicate capillaries (WPI, Sarasota, FL, USA) and pulled with a Narishige PP83 puller (Narishige, Tokyo, Japan). Patch pipettes filled with intracellular solutions had resistances of 2−7 MΩ. Currents were low‐pass filtered at 1 or 5 kHz and sampled at 10 kHz. We used two main intracellular solutions: (i) a KCl‐based intracellular solution containing (in mM): 140 KCl, 10 HEDTA, 10 Hepes, pH 7.2, with KOH, and (ii) an N‐methyl‐D‐glucamine‐Cl (NMDG‐Cl)‐based solution containing (in mM): 140 NMDG‐Cl, 10 HEDTA, 10 Hepes, adjusted to pH 7.2 with NMDG. To measure Ca2+‐activated currents, 3.209 mM CaCl2 was added to the NMDG‐Cl solution to obtain the final concentration of 1.5 μM free Ca2+, as calculated with the program WinMAXC (C. Patton, Stanford University, Stanford, CA, USA) and previously described in detail (Patton et al. ; Pifferi et al. , a,). The extracellular mammalian Ringer solution contained (in mM): 140 NaCl, 5 KCl, 2 CaCl2, 1 MgCl2, 10 Hepes and 10 glucose, adjusted to pH 7.4 with NaOH. NMDG‐Cl extracellular solution contained (in mM): 140 NMDG‐Cl, 1 MgCl2, 10 Hepes, adjusted to pH 7.4 with NMDG. For ion selectivity experiments, extracellular NMDG‐Cl was replaced by NMDG‐methanesulfonate (NMDG‐MeS). Ani‐9 was prepared in DMSO at 10 mM as a stock solution and diluted in the extracellular solution to the final concentration of 1 μM. GdCl3 was prepared as a 1 M stock solution and daily diluted in the extracellular solution to the final concentration of 200 μM.
For recordings of ATP‐activated currents, the patch pipette solution contained (in mM): 140 NMDG‐Cl, 2 HEDTA, 10 Hepes, adjusted to pH 7.2 with NMDG and no added Ca2+. ATP at 50 μM was added to the extracellular Ringer solution on the day of the experiment. For ion selectivity experiments, NaCl in the extracellular Ringer solution was replaced by equimolar sodium gluconate. I–V relationships were measured using a ramp protocol from −70 to +100 mV at 0.85 mV ms–1.
Extracellular solutions were exchanged through a three‐barrel square glass (3SG700‐5, Warner Instruments, Hamden, CT, USA) using the gravity‐driven perfusion system Fast‐Step SF‐77B (Warner Instruments). Different solutions were flowing side by side in each glass pipe and a stepper motor moved different pipes, and therefore different solution, in front of the cell. The time course of solution exchange was about 50 ms (see Fig. 9A).
The bath was grounded through a 3 M KCl agar bridge connected to an Ag/AgCl reference electrode. Membrane potentials were not corrected for liquid junction potentials whose values were less than 7 mV as calculated using the Clampex's Junction Potential Calculator (based on Barry, ).
Chemicals, unless otherwise stated, were purchased from Sigma.
Electrophysiological recordings from HEK‐293 cells
HEK‐293 cells were grown in medium composed of DMEM (Gibco, Italy) supplemented with 10% FBS (Sigma, Italy), 100 IU ml−1 penicillin and 100 μg ml−1 streptomycin (Sigma, Italy) at 37°C in a humidified atmosphere of 5% CO2. pEGFP‐N1 plasmid containing the cDNA of mouse TMEM16A (version ac, as in Ferrera et al. ) was provided by Professor Criss Hartzell (Emory University, USA). HEK‐293 cells were transfected with 2 μg of plasmid using the transfection reagent XtremeGENE (Roche Diagnostic, Indianapolis, IN, USA). Twenty‐four hours after transfection, the cells were subcultured in 35‐mm Petri dishes at a lower density. Electrophysiological recordings were performed between 48 and 72 h after transfection as previously described (Pifferi et al. a). TMEM16A‐transfected HEK‐293 cells were identified by enhanced green fluorescent protein (EGFP) fluorescence using an Olympus IX70 microscope (Olympus, Japan) equipped with the appropriate filter. TMEM16A currents were recorded in the whole‐cell configuration in voltage‐clamp mode as described for taste bud cells. Cells were kept in mammalian Ringer solution composed of (in mM) 140 NaCl, 5 KCl, 2 CaCl2, 1 MgCl2, 10 glucose and 10 Hepes, pH 7.4 with NaOH. The pipette solution contained (in mM): 140 NMDG‐Cl, 10 HEDTA, 10 Hepes, 1.242 CaCl2 adjusted to pH 7.3 with NMDG to obtain the final concentration of 0.5 μM free Ca2+. The extracellular solution contained (in mM): 140 NMDG‐Cl, 2 CaCl2, 1 MgCl2, 10 Hepes, adjusted to pH 7.4 with NMDG. Ani‐9 was prepared in DMSO at 10 mM as a stock solution and diluted in the extracellular solution to the final concentration of 1 μM.
Analysis of electrophysiological data
Igor Pro software (WaveMetrics, Lake Oswego, OR, USA) was used for data analysis and to produce the figures. All averaged data from individual experiments in different cells are presented as mean ± standard deviation and number of cells (n). Statistical analyses of normally distributed data (Shapiro–Wilk test) were performed using unpaired t tests. For not normally distributed data, the Mann–Whitney U‐test was used. The homogeneity of the variance was tested using Levene's test. P values of <0.05 were considered statistically significant.
Results
RT‐PCR
To evaluate the expression of Tmem16a and Tmem16b transcripts in taste buds, we performed RT‐PCR analysis on whole mRNA extract from vallate papillae (Fig. 1). To check the integrity and specificity of the mRNA extracts, we amplified markers for the three types of taste bud cells: Entpd2 for type I, Plcβ2 for type II and Snap25 for type III, and for the housekeeping gene Gapdh (Fig. 1B). By using primers that span specific and conserved regions from Tmem16a and Tmem16b sequences, to recognize all isoforms described for both proteins (O'Driscoll et al. ; Ponissery Saidu et al. ), we amplified Tmem16a, but not Tmem16b mRNA (Fig. 1A). As lack of Tmem16b transcript amplification could be due to problems in the primers themselves, we validated them by performing RT‐PCR on whole mRNA extracts from the olfactory epithelium, where expression of Tmem16a and Tmem16b is well established (Dauner et al. ; Maurya & Menini, ). RT‐PCR from the olfactory epithelium showed the expression of both Tmem16a and Tmem16b transcripts (Fig. 1C), confirming primer integrity. These results indicate that Tmem16a, but not Tmem16b, transcripts are expressed in mouse vallate papillae.
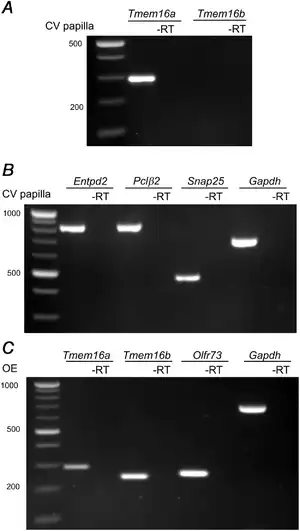
Figure 1
TMEM16A mRNA is expressed in vallate taste buds
Total mRNA extracted from vallate papillae (VP) was amplified by RT‐PCR using specific primers for: (A) Tmem16a and Tmem16b, and (B) Entpd2, Plcβ2, Snap25 and Gapdh. C, to test primer efficiency, total mRNA extracted from the whole olfactory epithelium (OE) was amplified for Tmem16a, Tmem16b, Olf73 and Gapdh. Control experiments were made using the same sample template without retro‐transcriptase.
Expression of TMEM16A in taste buds of vallate papillae
To examine the expression and localization of the TMEM16A and TMEM16B proteins in mouse taste buds from vallate papillae, we performed immunohistochemistry and used KO mice as controls (Figs 2 and 3). Figure 2B shows that TMEM16A was expressed in taste buds from adult mice, with a more intense staining near the apical tip. To verify the specificity of the TMEM16A antibody, we performed control experiments using Tmem16a KO mice (Fig. 2C and D). As these mice die a few days after birth (Rock et al. ), we could not test adult animals, but we compared results from WT and KO mice of about the same age (P8–P10). We found no signal for Tmem16a in KO mice (Fig. 2D), confirming the specificity of the immunostaining for TMEM16A obtained in WT mice.
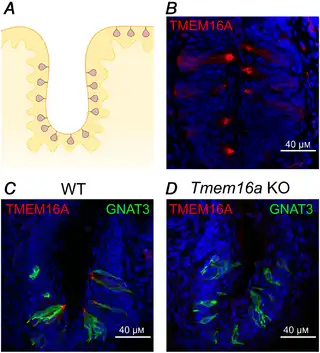
Figure 2
TMEM16A is expressed in vallate taste buds
A, schematic drawing of a coronal section of a portion of a vallate papilla (VP) showing the distribution of taste buds. B, confocal micrograph of a coronal section of a vallate papilla immunostained for TMEM16A. TMEM16A was mainly expressed at the apical part of taste buds. C and D, confocal micrographs of sections of vallate papillae from WT (P10) or Tmem16a KO (P8) mice immunostained for TMEM16A (red) and GNAT3 (green). No immunoreactivity to TMEM16A was detected from KO tissue. Cell nuclei were stained by DAPI (blue). [Color figure can be viewed at wileyonlinelibrary.com]
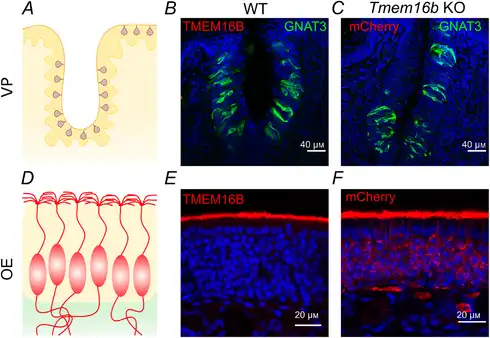
Figure 3
TMEM16B is not expressed in vallate taste buds
A, schematic drawing of a coronal section of a vallate papilla (VP) showing the distribution of taste buds. B, confocal micrographs of a vallate papilla from a WT mouse immunostained with antibody against TMEM16B (red) and GNAT3 (green). No immunoreactivity to TMEM16B was detected in taste buds. C, confocal micrograph of a section of a vallate papilla from Tmem16b KO mouse expressing mCherry on the membrane of cells that normally express TMEM16B (see Methods for details on the generation of the KO mice by Zhang et al. ), immunostained with antibody against red fluorescent proteins (red) and GNAT3 (green). No immunoreactivity to mCherry was detected in taste buds from KO, indicating that TMEM16B was not expressed in WT taste buds. D, schematic drawing of a coronal section of the olfactory epithelium (OE) showing olfactory sensory neurons with cilia in the apical layer. E, TMEM16B was normally detected in the apical layer of the WT olfactory epithelium using the same TMEM16B antibody used in B. F, mCherry (red) was detected in olfactory sensory neurons from Tmem16b KO mice. In these KO mice, mCherry was expressed, as expected, in the membrane of entire olfactory neurons that normally express TMEM16B at the apical side. Cell nuclei were stained by DAPI (blue). [Color figure can be viewed at wileyonlinelibrary.com]
By contrast, we did not detect immunoreactivity to TMEM16B in taste buds. Figure 3 shows a comparison between confocal micrographs from sections of mouse vallate papilla (top row) and olfactory epithelium (bottom row). TMEM16B immunoreactivity was absent in taste buds (Fig. 3B), although the same antibody revealed the expression of TMEM16B at the apical surface of the olfactory epithelium (Fig. 3E), as previously shown (Maurya et al. ; Dibattista et al. ). We further investigated the expression of TMEM16B in taste buds by taking advantage of a Tmem16b KO mice line that was engineered to express mCherry in cells that normally express TMEM16B (Zhang et al. ). It is important to note that the use of mCherry Tmem16b KO mice allows the visualization of the entire cells including all membranes that allow farnesylated mCherry to associate with. As a positive control, we used the olfactory epithelium, where TMEM16B is expressed at the apical side of olfactory sensory neurons (Fig. 3E). Figure 3F shows that mCherry was expressed, as expected, in the entire olfactory neurons of KO mice, including cilia, dendrites, somas and axons. By contrast, mCherry was not expressed in taste buds (Fig. 3C), further indicating that TMEM16B is not expressed in mouse vallate papillae.
To identify which cell types express TMEM16A in the taste buds, we performed immunohistochemistry using specific markers for each cell type. Indeed, taste buds are composed of three major cell types, characterized by their morphology and expression of specific proteins (Liman et al. ; Roper & Chaudhari, ; Kinnamon & Finger, ). Type I cells are often identified by NTPDase2 expression (Bartel et al. ) and also strongly express at their apical tip the inwardly rectifying potassium channel KCNJ1 (Dvoryanchikov et al. ). Type II cells specifically express PLCβ2 (Zhang et al. ), while GAD‐67 can be used to stain a subset of type III cells (DeFazio et al. ; Tomchik et al. ). Figure 4A–C shows that TMEM16A was mainly expressed at the apical part of the taste buds and it was difficult to assess co‐expression with NTPDase2, PLCβ2 or GAD‐67. Lack of co‐localization of TMEM16A with these cell markers can be explained because of the different subcellular expression. We took advantage of the specific expression of KCNJ1 at the apical tips of type I cells, and we evaluated the co‐localization of this marker with TMEM16A. Figure 4D–F shows that TMEM16A co‐localized with KCNJ1 at the apical tip of taste buds, indicating the expression of TMEM16A in type I cells.
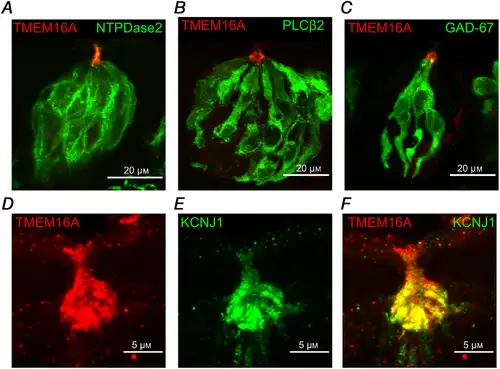
Figure 4
TMEM16A colocalizes with KCNJ1 in type I taste bud cells
Confocal micrographs of coronal sections of vallate papillae. A–C, immunostaining for TMEM16A and NTPDase2, PLCβ2, and GFP (GAD67‐GFP mouse). D–F, immunostaining for TMEM16A (red) and KCNJ1 (green). Merging of the signals shows co‐localization of TMEM16A and KCNJ1 at the apical part of taste buds. [Color figure can be viewed at wileyonlinelibrary.com]
Together, these results show that TMEM16A, but not TMEM16B, is expressed in taste buds of vallate papillae, and that TMEM16A is mainly localized at the apical part of type I cells.
Ca2+‐activated Cl− currents in taste cells
We investigated whether taste cells have functional Ca2+‐activated Cl– channels and compared whole‐cell recordings in dissociated cells dialysed with intracellular solutions in the presence or in the absence of 1.5 μM free Ca2+.
In a first set of experiments, we evaluated the viability of electrophysiological recordings and the possibility to identify the three types of taste cells using a KCl‐based intracellular solution in the absence of Ca2+. Indeed, it is difficult to identify the dissociated cell types by their morphology, but their electrophysiological fingerprint can be used to identify them. It has been shown that, in physiological solutions, type I cells are characterized by the presence of only voltage‐gated outward K+ currents, type II cells by the combination of voltage‐gated inward Na+ and non‐selective outward currents, and type III cells by both voltage‐gated inward Na+ and outward K+ currents (Bigiani, ; Medler et al. ; Noguchi et al. ; Romanov & Kolesnikov, ; Vandenbeuch et al. ). Figure 5A shows representative recordings from taste cells displaying three different patterns of currents typical of the different cell types: (i) cells with only outward currents (type I, green traces); (ii) cells with small inward and large outward currents (type II, blue traces); and (iii) cells with large inward and outward currents (type III, orange traces), indicating that all three cell types are viable in our preparation of dissociated taste cells.
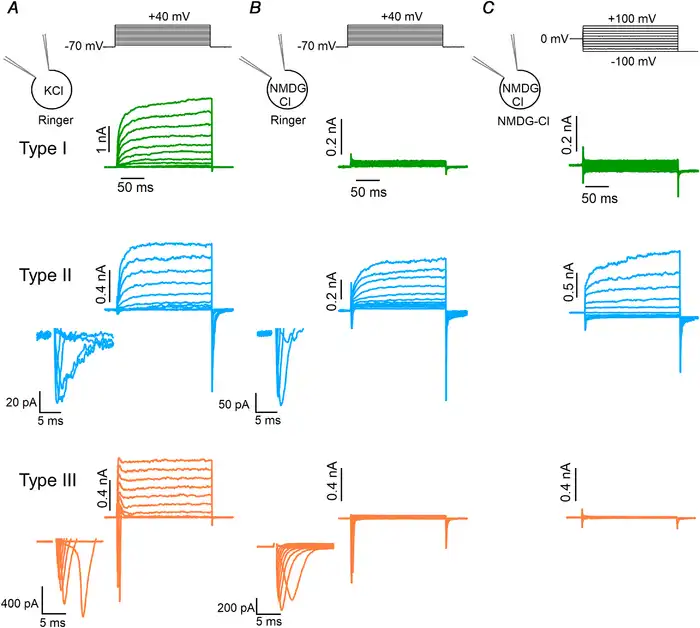
Figure 5
Electrophysiological identification of taste bud cell types
A, representative whole‐cell recordings obtained with a pipette solution containing KCl from type I (green), II (blue) or III (orange) taste bud cells bathed in mammalian Ringer solution. The holding potential was −70 mV and voltage steps from −60 mV to +40 mV with 10 mV increments were applied as shown at the top of the panel. Enlarged transient inward currents of type II and III cells are shown in the insets. B, representative whole‐cell recordings using NMDG‐Cl in the patch pipette and mammalian Ringer solution as the extracellular solution. The voltage protocol was the same of the recordings shown in A. Voltage‐gated outward currents in type I and III cells were abolished by the replacement of K+ with NMDG+, whereas they were still recorded in type II cells. C, the same cells in B were bathed in NMDG‐Cl symmetrical solutions. Note that the voltage protocol was different from that used in B, as the holding potential was 0 mV and voltage steps from −100 mV to +100 mV with 20 mV increments were applied followed by a step to −100 mV, as indicated at the top of the panel. In these conditions, type I and III cells did not show voltage‐gated inward and outward currents, whereas type II cells still had robust voltage‐gated outward currents. Intracellular solutions always contained nominally 0 Ca2+. [Color figure can be viewed at wileyonlinelibrary.com]
In a second set of experiments, we modified the intracellular solution to suppress outward K+ currents by replacing K+ ions with NMDG+, a large cation that does not permeate K+ channels. Figure 5B shows that outward currents were eliminated from type I and type III cells, while large voltage‐gated outward currents were still present in type II cells as they are due to the activation of CALHM1/CALHM3 channels, which are characterized by a wide pore with very weak ion selectivity and allow the permeation of large ions, including NMDG+ (Taruno et al. ; Ma et al. , ; Bigiani, ). In total, we recorded from 709 viable taste cells and electrophysiologically identified 279 type I (39%), 198 type II (28%) and 232 type III cells (33%).
As our goal was the measurement of Ca2+‐activated Cl– currents in electrophysiologically identified cells, we further replaced the external Ringer solution with a one containing only NMDG‐Cl and set the resting potential to 0 mV. In these experimental conditions, with NMDG+ as the main intra‐ and extracellular cation, there is no contribution from inward and outward currents due to voltage‐gated Na+ and K+ channels (Fig. 5C). To investigate the presence of Ca2+‐activated currents in the three types of taste cells, we compared recordings obtained in symmetrical NMDG‐Cl solutions with nominally 0 Ca2+ or 1.5 μM free intracellular Ca2+. The cell type was determined in external Ringer solution by using the voltage protocol shown at the top of Fig. 5B and then Ringer solution was replaced by NMDG‐Cl as in Fig. 5C.
Type II cells showed voltage‐gated outward currents slowly activated by depolarization both in the absence and in the presence of 1.5 μM intracellular free Ca2+ (Fig. 6A). Average current amplitudes at +100 mV were not significantly different (Fig. 6B; P = 0.14 unpaired t test), indicating that no additional currents were activated by Ca2+ in type II cells. To further investigate the presence of Ca2+‐activated currents that could be masked by the very large CALHM‐mediated outward currents, we blocked these currents by adding 200 μM Gd3+, a non‐specific ion channel blocker, and verified that also after the blockage the residual outward current amplitudes were not significantly different with 0 or 1.5 μM Ca2+ (Fig. 6A and B; P = 0.57 Mann–Whitney U‐test). As a control, we also tested if Gd3+ blocks TMEM16A or TMEM16B channels, by recording Ca2+‐activated Cl– currents in HEK293T cells transfected with TMEM16A or TMEM16B and did not measure any blocking effect by 200 μM GdCl3 on these channels (data not shown).
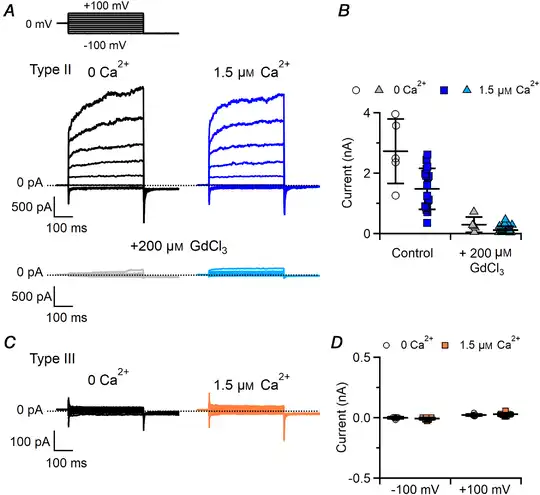
Figure 6
Type II and III taste bud cells do not have Ca2+‐activated Cl– currents
Representative whole‐cell recordings from type II (A) and type III (C) taste cells obtained in symmetrical NMDG‐Cl solutions. The pipette solution contained nominally 0 Ca2+ or 1.5 μM Ca2+ as indicated. The holding potential was 0 mV and voltage steps from −100 mV to +100 mV with 20 mV increments were applied followed by a step to −100 mV, as indicated at the top of A. Gd3+ at 200 μM was added to block the large CALHM‐mediated outward currents in type II cells. B and D, scatter dot plots with averages ± SD showing current amplitudes in 0 or 1.5 μM Ca2+ in type II (B, currents at +100 mV in the absence or in the presence of 200 μM Gd3+, n = 5–18; P = 0.14 unpaired t test for control; P = 0.57 Mann–Whitney U‐test for Gd3+) or type III taste cells (D, n = 6–13; P = 0.26 unpaired t test for −100 mV; P = 0.33 unpaired t test for +100 mV). [Color figure can be viewed at wileyonlinelibrary.com]
Type III cells showed negligible currents both in the absence and in the presence of 1.5 μM Ca2+, indicating the absence of functional Ca2+‐activated currents in symmetrical NMDG‐Cl solutions (Fig. 6C and D; P = 0.33 unpaired t test).
In type I cells, 1.5 μM free Ca2+ generated large currents while currents in 0 Ca2+ were very small (Fig. 7A and B). Ca2+‐activated currents had the typical time‐dependent features of Ca2+‐activated Cl– channels, displaying time‐dependent deactivation kinetics with hyperpolarizing potentials, activation kinetics with depolarizing potentials, and deactivating inward tail currents when the voltage was stepped to −100 mV at the end of the protocol (Fig. 7A, D and G). The I–V relationship of the steady‐state Ca2+‐activated current at the end of the voltage steps was outwardly rectifying with an average ratio between currents at +100 mV and −100 mV of 1.6 ± 0.7 (n = 17).
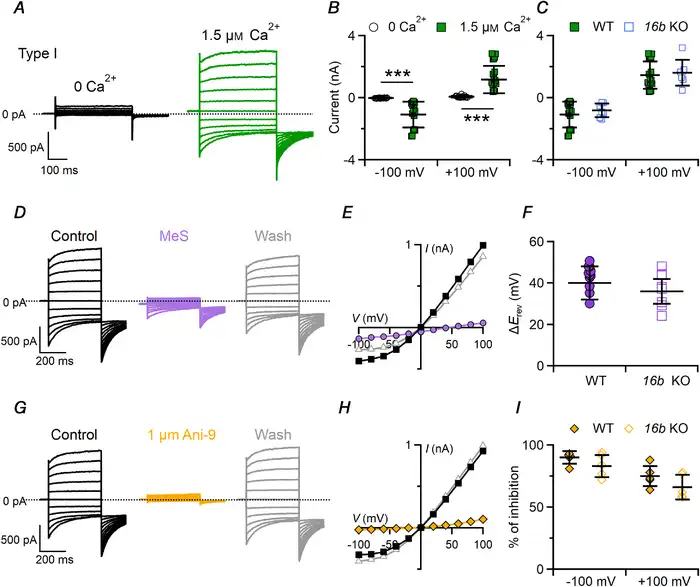
Figure 7
Ca2+‐activated Cl– currents in type I taste bud cells
A, representative whole‐cell recordings from type I taste cells measured in symmetrical NMDG‐Cl solutions with an intracellular solution containing nominally 0 Ca2+ or 1.5 μM Ca2+. The holding potential was 0 mV, and voltage steps from −100 mV to +100 mV with 20 mV increments were applied followed by a step to −100 mV. B and C, scatter dot plots with averages ± SD showing (B) current amplitudes measured at steady state in 0 or 1.5 μM Ca2+ (n = 15–17, ***P = 3.5 × 10⁻⁹, −100 mV, P = 3.4 × 10⁻⁹, +100 mV, Mann–Whitney U‐test) and (C) Ca2+‐activated currents in cells from WT (n = 15) or Tmem16B KO (n = 7; P = 0.8, −100 mV, P = 0.41, +100 mV, Mann–Whitney U‐test) mice. D and G, the same cell was exposed to a control solution containing NMDG‐Cl (black traces), or NMDG‐MeS (purple traces) or NMDG‐Cl with 1 μM Ani‐9 (yellow traces), followed by washout in NMDG‐Cl (grey traces). E and H, steady‐state I–V relationships measured at steady state from the recordings shown in D and G in control condition (squares), MeS (E, circles) or 1 μM Ani‐9 (H, diamonds) and after washout (triangles). F and I, scatter dot plots with average ± SD showing (F) ΔErev (mV) after MeS perfusion in cells from WT (n = 11) and Tmem16b KO (n = 7; P = 0.08 unpaired t test) mice, and (I) percentage of current inhibition by 1 μM Ani‐9 measured at −100 and +100 mV in cells from WT (n = 5) and Tmem16b KO mice (n = 5; P = 0.27 unpaired t test for −100 mV; P = 0.2 unpaired t test for +100 mV) mice. [Color figure can be viewed at wileyonlinelibrary.com]
To examine whether the Ca2+‐activated current in type I cells was carried by Cl–, we replaced extracellular Cl– with MeS–, a large impermeant anion and found that the reversal potential shifted toward a positive value (+36 ± 8 mV, n = 7), as expected for Cl– channels, indicating that the Ca2+‐activated current in type I cells is mainly carried by Cl– (Fig. 7D–F). We also tested the blockage of Ca2+‐activated Cl– currents by Ani‐9, a compound that fully blocks TMEM16A in the sub‐micromolar range and has a high selectivity for TMEM16A compared with TMEM16B (Seo et al. ). Figure 7G and H show that 1 μM Ani‐9 caused a strong reversible inhibition of the current in WT type I cells, with an average current block of 75% ± 8% at +100 mV and 90 ± 5% at −100 mV (Fig. 7I), indicating that the current was mainly carried through TMEM16A channels.
We also performed experiments in type I taste cells from Tmem16b KO mice. In agreement with our previous results showing the absence of TMEM16B in taste buds (Figs 1 and 3), we did not find any statistical difference between Ca2+‐activated currents in type I taste cells from WT and Tmem16b KO (Fig. 7C). Moreover, the shift of the reversal potential upon replacement of Cl– with MeS– and the blocking effect of Ani‐9 were similar in type I taste cells from WT and Tmem16b KO (Fig. 7F and I), in agreement with the previous experiments indicating that TMEM16A is the channel responsible for the measured Ca2+‐activated Cl– currents.
To further investigate the possibility that a small inward current could be activated by Ca2+ in type II or III taste cells, we compared recordings in symmetrical NMDG‐Cl solutions from the three cell types obtained by holding the cell at −100 mV for several seconds in the presence of 1.5 μM Ca2+ in the pipette. Figure 8 further shows that large currents blocked by 1 μM Ani‐9 were activated only in type I cells, while type II and III cells had low‐amplitude currents that were not blocked by Ani‐9 (Fig. 8A, C and E). Average current amplitudes at −100 mV were −1083 ± 824 pA (n = 17) for type I, −68 ± 95 pA (n = 18) for type II and −6 ± 8 pA (n = 13) for type III cells. Cell viability was tested after application of the blocker (Fig. 8B, D and F). A significant blockage by Ani‐9 in type I was observed within a few seconds from the application of the blocker and was very similar to that measured in HEK‐293 cells transiently transfected with Tmem16a (Fig. 9B).
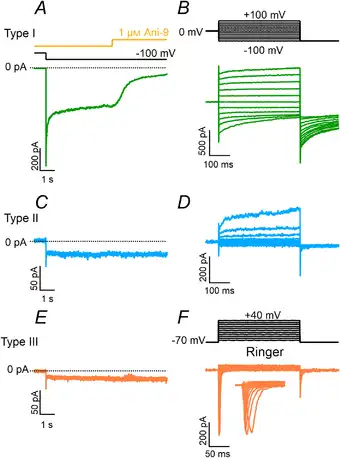
Figure 8
Blockage of inward currents by Ani‐9
A, C and E, representative whole‐cell recordings from type I (green traces), II (blue traces) or III (orange traces) taste cells recorded in symmetrical NMDG‐Cl solutions with an intracellular solution containing 1.5 μM Ca2+. The holding potential was 0 mV and was stepped to −100 mV as indicated. Ani‐9 at 1 μM was applied as indicated in the upper trace. B, D and F, after the application of Ani‐9, cell viability was tested with the indicated voltage protocols. The extracellular solution was NMDG‐Cl in B and D or Ringer in F. [Color figure can be viewed at wileyonlinelibrary.com]
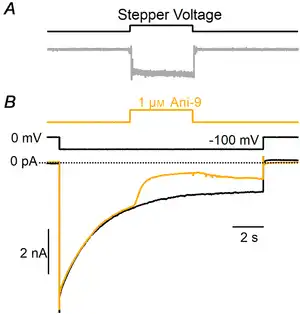
Figure 9
Blockage of TMEM16A‐mediated current in HEK‐293 cells by Ani‐9
A, the upper trace shows the voltage command of the stepper motor moving glass pipes in which different solutions were flowing. The bottom trace shows the time course of the solution exchange from Ringer solution to 1 M KCl moving the pipes in front of a patch electrode. The change of solution was obtained in less than 50 ms. B, representative whole‐cell recordings from HEK‐293 cells expressing TMEM16A recorded in symmetrical NMDG‐Cl solutions with an intracellular solution containing 0.5 μM Ca2+. The holding potential was 0 mV and was stepped to −100 mV as indicated. Ani‐9 at 1 μM was applied as indicated in the upper trace. A significant reduction of the currents was observed within a few seconds from the application of the blocker. [Color figure can be viewed at wileyonlinelibrary.com]
We could not perform experiments in taste cells from Tmem16A KO mice because more than 50% of these mice die within 5 days of birth (Rock et al. ) and, as shown by Bigiani et al. (), it is difficult to identify taste buds in very young mice, preventing the possibility of obtaining a number of dissociated cells sufficient for electrophysiological experiments.
Collectively, these data show that intracellular Ca2+ can activate a large Cl– current in type I (but not in type II or III) taste cells, carried through the TMEM16A channel.
ATP evokes a Cl– current in type I taste cells
Studies by Kim et al. () and Cherkashin et al. () showed that a subpopulation of taste cells exhibited large Ca2+‐activated Cl– currents when stimulated with P2Y receptor agonists. Perforated patch recordings showed that the subpopulation consisted of type I cells (Cherkashin et al. ). Here, we used whole‐cell recordings instead of perforated patch to test whether ATP stimulation could activate Ca2+‐activated Cl– currents in type I cells. We found that 50 μM ATP at the holding potential of −70 mV induced large inward currents in 71% of type I taste cells (89 out of 125) in extracellular Ringer solution (Fig. 10A). ATP‐evoked currents were still present when NaCl in the Ringer solution was replaced with NMDG‐Cl and 0 K+, indicating that the inward current was not carried by Na+ or K+ (Fig. 10B).
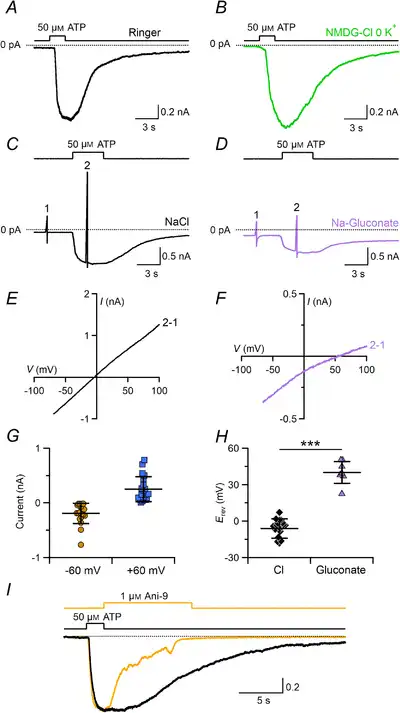
Figure 10
ATP induces a Cl– current blocked by Ani‐9 in type I taste bud cells
Representative whole‐cell recordings from type I taste cells stimulated with 50 μM ATP in Ringer solution (A) or in a Ringer solution modified by replacing NaCl with NMDG‐Cl and omitting KCl (B). The pipette solution contained NMDG‐Cl. The holding potential was −70 mV. ATP was applied for the time indicated in the upper trace. C and D, voltage ramps from −70 to +100 mV before (1) and during (2) ATP application were used to measure I–V relationships in the presence of Ringer solution with NaCl or Ringer solution with sodium gluconate (D). E and F, I–V relationships from the cells shown in C and D respectively obtained by subtracting the traces (1) from those in the presence of ATP (2). G, scatter dot plots with averages ± SD of current amplitudes at −60 and +60 mV (n = 18). H, scatter dot plots with averages ± SD of Erev recorded in Ringer solution with NaCl (n = 20, black diamonds) or in Ringer solution with sodium gluconate (n = 7, purple triangles; P = 1.93 × 10⁻¹¹ unpaired t test). I, blockage by 1 μM Ani‐9 of the ATP‐induced current in Ringer solution. ATP and Ani‐9 were applied as indicated in the upper traces. Currents from the same cell were normalized to the peak amplitude. ATP stimulus duration was 2 s. Ani‐9 was applied after ATP for 10 s and completely blocked the current (yellow trace, −756 pA peak current). Control trace recorded after Ani‐9 application (black trace, −948 pA peak current). [Color figure can be viewed at wileyonlinelibrary.com]
To measure the I–V relationship and to determine the ionic selectivity of the ATP‐induced current, we applied voltage ramps before and during ATP stimulation in various ionic conditions (Fig. 10C and D). The I–V relationship of the current activated by ATP was calculated by subtracting the current generated by the voltage ramp before stimulation (Fig. 10E and F). Rectification properties in Ringer varied in different cells from outward to linear rectification, with an average ratio of the current amplitude at +60 mV and −60 mV of 1.3 ± 0.6 (n = 18, Fig. 10G). Different rectifications are probably due to different intracellular Ca2+ concentrations elicited by ATP. The average reversal potential was −6 ± 8 mV (n = 20) in Ringer solution and shifted to +40 ± 9 mV (n = 7) upon reduction of the extracellular Cl– concentration by replacing NaCl with sodium gluconate, indicating that the current was mainly carried by Cl– (Fig. 10H). To test whether the ATP‐induced Cl– current was due to activation of TMEM16A, we applied the specific blocker Ani‐9. Figure 10H shows that Ani‐9 caused a sudden reduction of the inward current with a time course similar to that observed in HEK‐293 transiently transfected with TMEM16A (Fig. 9B), indicating that the Cl– current was carried through TMEM16A channels. However, we cannot completely exclude the possibility that a prolonged application of Ani‐9 could have a non‐specific action and perhaps inhibit ATP‐induced Ca2+ signals as observed in some cell lines (Centeio et al. ).
Thus, our results in the whole‐cell configuration confirm previous data obtained with perforated patch recordings (Kim et al. ; Cherkashin et al. ) showing that ATP evokes large Ca2+‐activated Cl– currents in type I cells and extend those results showing that these currents are blocked by Ani‐9, consistent with our data indicating that these currents are due to activation of TMEM16A channels.
Discussion
In this study, we have demonstrated that a large Ca2+‐activated Cl– current can be physiologically activated in type I taste bud cells, but not in type II and III taste bud cells. Moreover, we have shown that the Ca2+‐activated Cl– channel TMEM16A, but not TMEM16B, is expressed mainly at the apical part of type I cells where it largely colocalizes with the inwardly rectifying K+ channel KCNJ1.
Ca2+‐activated Cl– channels in taste bud cells
Our study confirms some data of the previous pioneering reports showing the presence of Ca2+‐activated Cl– currents in taste cells and significantly extends and revises them (Cherkashin et al. ; Kim et al. ). Indeed, Kim et al. () used perforated patch‐clamp recordings combined with Ca2+ imaging and demonstrated that intracellular Ca2+ increase, produced by ionomycin or by ATP, activated Cl– currents in a subpopulation of taste cells, which exhibited no voltage‐gated Na+ and Ca2+ currents. The same authors also showed that the cytosolic Ca2+ increase produced by ATP was mediated by P2Y receptors, demonstrating that ATP indirectly activated Cl– channels by causing Ca2+ release from intracellular stores. Cherkashin et al. () further investigated the distribution of Ca2+‐activated Cl– currents in taste cell types using the perforated patch clamp technique. They found clear evidence that type I cells have functional Ca2+‐activated Cl– channels that can be activated by ionomycin or purinergic agonists. By measuring the effect of available blockers for TMEM16A, they found that channels in type I cells were blocked by CaCCinh‐A01 but not by T16Ainh‐A01. The authors also recorded a very small inward current in type II cells activated by ionomycin or by photorelease of caged Ca2+ that could be blocked by T16Ainh‐A01. Type III cells exhibited no ion current induced by ionomycin or photorelease of caged Ca. In addition, the same authors found transcripts of Tmem16a and Tmem16b in vallate papillae and confirmed their expression by using immunohistochemistry. They also identified Tmem16a transcripts in type II cells, and Tmem16b transcripts in both type I and type II cells. On the basis of their results, Cherkashin et al. () concluded that type I cells express only TMEM16B, while type II cells express both TMEM16A and TMEM16B channels.
In our study, we used a more recently discovered selective blocker of TMEM16A, Ani‐9 (Seo et al. ), and we were able to use KO mice for Tmem16a and Tmem16b as a control for the specificity of antibodies. This allowed us to confirm, revise and extend some of the previous discoveries. By using specific antibodies for TMEM16A and TMEM16B validated on tissues from KO mice, we confirmed the expression of TMEM16A in taste buds whereas we did not find expression of TMEM16B. We further investigated the expression of TMEM16B by using the Tmem16b KO mice line engineered by Zhang et al. () to express mCherry under the Tmem16b promoter. We confirmed that mCherry was not expressed in taste buds, whereas it was expressed by olfactory sensory neurons in the olfactory epithelium, further showing that TMEM16B is not expressed in taste buds.
From a functional point of view, we performed patch‐clamp experiments in the whole‐cell configuration and compared recordings obtained with nominally 0 or 1.5 μM intracellular Ca2+ and measured large Ca2+‐activated Cl– current in type I cells blocked by Ani‐9, a selective blocker of TMEM16A, whereas we could not measure any Ca2+‐activated Cl– current in type II and type III cells. Moreover, in type I cells, extracellular ATP produced activation of a large Cl– current that was inhibited by Ani‐9, further demonstrating the functional expression of TMEM16A in type I cells.
Recently, Ávalos Padro et al. () reported that the interaction of TMEM16A with KCNE1 switches the gating mode of TMEM16A from Ca2+‐dependent to voltage‐dependent, showing that TMEM16A could also be activated in the absence of Ca2+ if it is associated with KCNE1. However, our data show that type II and type III cells lack voltage‐gated Cl– currents also in nominally 0 intracellular Ca2+ (Fig. 6), further excluding the possibility that TMEM16A could be active in these cell types.
As type II cells are very heterogeneous (Chandrashekar et al. ), we cannot exclude the possibility that some rare type II cells could exhibit Ca2+‐activated Cl– currents.
Physiological activators and role of Ca2+‐activated Cl– currents in type I taste bud cells
Type I cells comprise about 50% of the cells in each taste bud and are considered to have mainly glial‐like functions. Not much is known about their physiological roles, which still need to be extensively investigated. It is well established that ATP is released from type II taste cells and is degraded by NTPDase2 on the surface of type I cells (Bartel et al. ; Vandenbeuch et al. ). However, type I cells also express P2Y receptors that have been shown to increase cytosolic Ca2+ when activated by ATP (Bystrova et al. ; Kim et al. ). Immunohistochemical data showed that P2Y1 receptors (Kataoka et al. ) and P2Y2 receptors (Bystrova et al. ) are expressed in the basolateral membrane of a subset of taste bud cells. Thus, we speculate that ATP released through CALHM1/CALHM3 channels of type II cells reaching the surface of type I cells, where it is degraded by NTPDase2, can also bind to P2Y receptors, and indirectly activate TMEM16A channels causing a flux of Cl– according to its electrochemical gradient.
In addition to P2Y receptors, type I cells also express other receptors that, upon activation by their agonists, produce an increase in intracellular Ca2+ and can therefore activate TMEM16A channels. Sinclair et al. () have shown that a subset of type I cells express the oxytocin receptor that upon stimulation by oxytocin causes an intracellular Ca2+ increase similar to that induced by ATP. In another study, Huang & Wu () measured Ca2+ release from intracellular stores in type I cells in response to substance P.
What, then, is the physiological role of Ca2+‐activated Cl– channels in type I taste cells? Depending on the Cl– equilibrium potential and on the membrane potential, these channels may allow influx or efflux of Cl–, increasing or decreasing the cytoplasmic Cl– concentration and contributing to cell hyperpolarization or depolarization. At present, estimates of the Cl– concentration inside taste cells are not available and may differ between the basolateral and apical sides. The extracellular Cl– concentration varies depending on apical or basolateral parts of the cell. Indeed, the apical part of taste cells is likely to be immersed in saliva, while the cell body is surrounded by interstitial fluid. Saliva has a naturally low Cl– concentration, being composed of 15 mM NaCl, 22 mM KCl, 3 mM CaCl2 and 0.6 mM MgCl2, corresponding to a Cl– concentration of about 44 mM (Breza et al. ; Matsuo, ), while the interstitial fluid contains about 100–110 mM Cl– (Yunos et al. ). However, when salty tastants enter the taste pore, the concentration of Cl– can greatly increase, modifying the Cl– equilibrium potential.
We have shown that TMEM16A largely colocalized with the inwardly rectifying K+ channel KCNJ1 at the apical part of type I cells. KCNJ1 has been proposed to be involved in buffering of basolateral extracellular K+ by mediating the K+ efflux through the apical pore (Dvoryanchikov et al. ). As stimulation by tastants of type II cells produces both the local increase of extracellular K+ and release of ATP, we speculate that the activation of TMEM16A by ATP could mediate an influx of Cl– allowing a sustained apical extrusion of K+.
Interestingly, it has been shown that TMEM16A can be activated in the absence of intracellular Ca2+ by low extracellular pH through the titration of glutamic acid 623 (Cruz‐Rangel et al. ). We speculate that this modulation could be relevant during sour stimulation of type III cells. Indeed, the activation of TMEM16A by low pH could contribute, together with KCNJ1, to buffer the increase of extracellular K+ due to action potential firing of type III cells. However, Cruz‐Rangel et al. () also showed that an increase in intracellular Ca2+ to about 1 μM abolished the pH‐dependent gating of TMEM16A. Moreover, because TMEM16A has different permeabilities for anions, it is tempting to speculate that this channel may contribute to the long known ‘anion effect’ in which responses to sodium salts differ depending on the anion (Beidler, ; Breza & Contreras, ; Roebber et al. ).
Finally, it is of interest to note that Tizzano et al. () have shown that human vallate papillae share most of the structural, morphological and molecular features observed in rodents, and therefore future work should also investigate the expression of TMEM16A and verify a possible physiological role of this channel in human taste buds.
In summary, our data provide a definitive demonstration that TMEM16A‐mediated currents are functional in type I taste cells of mouse vallate papillae and provide a foundation for future studies investigating additional physiological roles for type I cells, often neglected with respect to studies on the type II and III taste cells.
Additional information
Author contributions
D.M.G., K.Y.G.‐V. and A.H.‐C. designed and performed the research, and analysed the data. A.M. and S.P. designed the research, analysed the data and wrote the paper.
Competing interests
The authors declare no conflicts of interests
Funding
This work was funded by the Italian Ministry of Education, University and Research 2010599KBR (A.M.).
Acknowledgements
We thank Michele Dibattista (University of Bari) and Paul A. Heppenstall (SISSA) for helpful discussions. We thank Elettra Grdina, Angel Pascual Camerota, Cristina Degrassi, Lorenzo Maschietto and Giovanni Tamburin for mice handling, and Helena Krmac and Christina Vlachouli for mice genotyping. We thank Lily Jan (UCSF), Jason R. Rock (Boston University School of Medicine) and Brain D. Harfe (University of Florida) for providing the KO mice.
References
- Ávalos Padro P, Häfner S, Comoglio Y, Wdziekonski B, Duranton C, Attali B, Barhanin J & Sandoz G (2021). KCNE1 is an auxiliary subunit of two distinct ion channel superfamilies. Cell 184, 534–544.e11.
- Barry PH (1994). JPCalc, a software package for calculating liquid junction potential corrections in patch‐clamp, intracellular, epithelial and bilayer measurements and for correcting junction potential measurements. J Neurosci Methods 51, 107–116.
- Bartel DL, Sullivan SL, Lavoie EG, Sévigny J & Finger TE (2006). Nucleoside triphosphate diphosphohydrolase‐2 is the ecto‐ATPase of type I cells in taste buds. J Comp Neurol 497, 1–12.
- Baumer‐Harrison C, Raymond MA, Myers TA, Sussman KM, Rynberg ST, Ugartechea AP, Lauterbach D, Mast TG & Breza JM (2020). Optogenetic stimulation of type I GAD65+ cells in taste buds activates gustatory neurons and drives appetitive licking behavior in sodium‐depleted mice. J Neurosci 40, 7795–7810.
- Béhé P, DeSimone JA, Avenet P & Lindemann B (1990). Membrane currents in taste cells of the rat fungiform papilla. Evidence for two types of Ca currents and inhibition of K currents by saccharin. J Gen Physiol 96, 1061–1084.
- Beidler LM (1953). Properties of chemoreceptors of tongue of rat. J Neurophysiol 16, 595–607.
- Bigiani A (2001). Mouse taste cells with glialike membrane properties. J Neurophysiol 85, 1552–1560.
- Bigiani A (2017). Calcium homeostasis modulator 1‐like currents in rat fungiform taste cells expressing amiloride‐sensitive sodium currents. Chem Senses 42, 343–359.
- Bigiani A, Cristiani R, Fieni F, Ghiaroni V, Bagnoli P & Pietra P (2002). Postnatal development of membrane excitability in taste cells of the mouse vallate papilla. J Neurosci 22, 493–504.
- Breza JM & Contreras RJ (2012). Anion size modulates salt taste in rats. J Neurophysiol 107, 1632–1648.
- Breza JM, Nikonov AA & Contreras RJ (2010). Response latency to lingual taste stimulation distinguishes neuron types within the geniculate ganglion. J Neurophysiol 103, 1771–1784.
- Bystrova MF, Yatzenko YE, Fedorov IV, Rogachevskaja OA & Kolesnikov SS (2006). P2Y isoforms operative in mouse taste cells. Cell Tissue Res 323, 377–382.
- Caputo A, Caci E, Ferrera L, Pedemonte N, Barsanti C, Sondo E, Pfeffer U, Ravazzolo R, Zegarra‐Moran O & Galietta LJV (2008). TMEM16A, a membrane protein associated with calcium‐dependent chloride channel activity. Science 322, 590–594.
- Centeio R, Cabrita I, Benedetto R, Talbi K, Ousingsawat J, Schreiber R, Sullivan JK & Kunzelmann K (2020). Pharmacological inhibition and activation of the Ca2+ activated Cl– channel TMEM16A. Int J Mol Sci 21, 2557.
- Chandrashekar J, Hoon MA, Ryba NJP & Zuker CS (2006). The receptors and cells for mammalian taste. Nature 444, 288–294.
- Cherkashin AP, Kolesnikova AS, Tarasov MV, Romanov RA, Rogachevskaja OA, Bystrova MF & Kolesnikov SS (2016). Expression of calcium‐activated chloride channels Ano1 and Ano2 in mouse taste cells. Pflugers Arch 468, 305–319.
- Clapp TR, Medler KF, Damak S, Margolskee RF & Kinnamon SC (2006). Mouse taste cells with G protein‐coupled taste receptors lack voltage‐gated calcium channels and SNAP‐25. BMC Biol 4, 7.
- Cruz‐Rangel S, De Jesús‐Pérez JJ, Aréchiga‐Figueroa IA, A Rodríguez‐Menchaca AA, Pérez‐Cornejo P, Hartzell HC & & Arreola J (2017). Extracellular protons enable activation of the calcium‐ dependent chloride channel TMEM16A. J Physiol 595, 1515–1531.
- Dauner K, Lissmann J, Jeridi S, Frings S & Möhrlen F (2012). Expression patterns of anoctamin 1 and anoctamin 2 chloride channels in the mammalian nose. Cell Tissue Res 347, 327–341.
- DeFazio RA, Dvoryanchikov G, Maruyama Y, Kim JW, Pereira E, Roper SD & Chaudhari N (2006). Separate populations of receptor cells and presynaptic cells in mouse taste buds. J Neurosci 26, 3971–3980.
- Dibattista M, Pifferi S, Boccaccio A, Menini A & Reisert J (2017). The long tale of the calcium activated Cl– channels in olfactory transduction. Channels (Austin) 11, 399–414.
- Dutta Banik D, Martin LE, Freichel M, Torregrossa A‐M & Medler KF (2018). TRPM4 and TRPM5 are both required for normal signaling in taste receptor cells. Proc Natl Acad Sci U S A 115, E772–E781.
- Dvoryanchikov G, Sinclair MS, Perea‐Martinez I, Wang T & Chaudhari N (2009). Inward rectifier channel, ROMK, is localized to the apical tips of glial‐like cells in mouse taste buds. J Comp Neurol 517, 1–14.
- Ferrera L, Caputo A, Ubby I, Bussani E, Zegarra‐Moran O, Ravazzolo R, Pagani F & Galietta LJV (2009). Regulation of TMEM16A chloride channel properties by alternative splicing. J Biol Chem 284, 33360–33368
- Henriques T, Agostinelli E, Hernandez‐Clavijo A, Maurya DK, Rock JR, Harfe BD, Menini A & Pifferi S (2019). TMEM16A calcium‐activated chloride currents in supporting cells of the mouse olfactory epithelium. J Gen Physiol 151, 954–966.
- Herness MS & Sun XD (1999). Characterization of chloride currents and their noradrenergic modulation in rat taste receptor cells. J Neurophysiol 82, 260–271.
- Hisatsune C, Yasumatsu K, Takahashi‐Iwanaga H, Ogawa N, Kuroda Y, Yoshida R, Ninomiya Y & Mikoshiba K (2007). Abnormal taste perception in mice lacking the type 3 inositol 1,4,5‐trisphosphate receptor. J Biol Chem 282, 37225–37231.
- Huang AY & Wu SY (2018). Substance P as a putative efferent transmitter mediates GABAergic inhibition in mouse taste buds. Br J Pharmacol 175, 1039–1053.
- Huang YA, Maruyama Y & Roper SD (2008). Norepinephrine is coreleased with serotonin in mouse taste buds. J Neurosci 28, 13088–13093.
- Kataoka S, ToyonoT Seta Y & Ogura T & Toyoshima (2004). Expression of P2Y1 receptors in rat taste buds. Histochem Cell Biol 121, 419–426.
- Kim YV, Bobkov YV & Kolesnikov SS (2000). Adenosine triphosphate mobilizes cytosolic calcium and modulates ionic currents in mouse taste receptor cells. Neurosci Lett 290, 165–168.
- Kinnamon SC & Finger TE (2019). Recent advances in taste transduction and signaling. F1000Res 8, 2117, 10.12688/f1000research.21099.1.
- Lawton DM, Furness DN, Lindemann B & Hackney CM (2000). Localization of the glutamate‐aspartate transporter, GLAST, in rat taste buds. Eur J Neurosci 12, 3163–3171.
- Liman ER, Zhang YV & Montell C (2014). Peripheral coding of taste. Neuron 81, 984–1000.
- Ma Z, Tanis JE, Taruno A & Foskett JK (2016). Calcium homeostasis modulator (CALHM) ion channels. Pflugers Arch 468, 395–403.
- Ma Z, Taruno A, Ohmoto M, Jyotaki M, Lim JC, Miyazaki H, Niisato N, Marunaka Y, Lee RJ, Hoff H, Payne R, Demuro A, Parker I, Mitchell CH, Henao‐Mejia J, Tanis JE, Matsumoto I, Tordoff MG & Foskett JK (2018). CALHM3 is essential for rapid ion channel‐mediated purinergic neurotransmission of GPCR‐mediated tastes. Neuron 98, 547–561.e10.
- Matsuo R (2000). Role of saliva in the maintenance of taste sensitivity. Crit Rev Oral Biol Med 11, 216–229.
- Maurya DK, Henriques T, Marini M, Pedemonte N, Galietta LJV, Rock JR, Harfe BD & Menini A (2015). Development of the olfactory epithelium and nasal glands in TMEM16A–/– and TMEM16A+/+ mice. PLoS One 10, e0129171.
- Maurya DK & Menini A (2014). Developmental expression of the calcium‐activated chloride channels TMEM16A and TMEM16B in the mouse olfactory epithelium. Dev Neurobiol 74, 657–675.
- McBride DW & Roper SD (1991). Ca2+‐dependent chloride conductance in Necturus taste cells. J Membr Biol 124, 85–93.
- Medler KF, Margolskee RF & Kinnamon SC (2003). Electrophysiological characterization of voltage‐gated currents in defined taste cell types of mice. J Neurosci 23, 2608–2617.
- Noguchi T, Ikeda Y, Miyajima M & Yoshii K (2003). Voltage‐gated channels involved in taste responses and characterizing taste bud cells in mouse soft palates. Brain Res 982, 241–259.
- Nomura K, Nakanishi M, Ishidate F, Iwata K & Taruno A (2020). All‐electrical Ca2+‐independent signal transduction mediates attractive sodium taste in taste buds. Neuron 106, 816–829.e6.
- O'Driscoll KE, Pipe RA & Britton FC (2011). Increased complexity of Tmem16a/Anoctamin 1 transcript alternative splicing. BMC Mol Biol 12, 35.
- Oliva AA, Jiang M, Lam T, Smith KL & Swann JW (2000). Novel hippocampal interneuronal subtypes identified using transgenic mice that express green fluorescent protein in GABAergic interneurons. J Neurosci 20, 3354–3368.
- Patton C, Thompson S & Epel D (2004). Some precautions in using chelators to buffer metals in biological solutions. Cell Calcium 35, 427–431.
- Pedemonte N & Galietta LJV (2014). Structure and function of TMEM16 proteins (anoctamins). Physiol Rev 94, 419–459.
- Pifferi S, Dibattista M & Menini A (2009a). TMEM16B induces chloride currents activated by calcium in mammalian cells. Pflugers Arch 458, 1023–1038.
- Pifferi S, Dibattista M, Sagheddu C, Boccaccio A, Al Qteishat A, Ghirardi F, Tirindelli R & Menini A (2009b). Calcium‐activated chloride currents in olfactory sensory neurons from mice lacking bestrophin‐2. J Physiol 587, 4265–4279.
- Pifferi S, Pascarella G, Boccaccio A, Mazzatenta A, Gustincich S, Menini A & Zucchelli S (2006). Bestrophin‐2 is a candidate calcium‐activated chloride channel involved in olfactory transduction. Proc Natl Acad Sci U S A 103, 12929–12934.
- Ponissery Saidu S, Stephan AB, Talaga AK, Zhao H & Reisert J (2013). Channel properties of the splicing isoforms of the olfactory calcium‐activated chloride channel Anoctamin 2. J Gen Physiol 141, 691–703.
- Rock JR, Futtner CR & Harfe BD (2008). The transmembrane protein TMEM16A is required for normal development of the murine trachea. Dev Biol 321, 141–149.
- Roebber JK, Roper SD & Chaudhari N (2019). The role of the anion in salt (NaCl) detection by mouse taste buds. J Neurosci 39, 6224–6232.
- Romanov RA & Kolesnikov SS (2006). Electrophysiologically identified subpopulations of taste bud cells. Neurosci Lett 395, 249–254.
- Romanov RA, Rogachevskaja OA, Bystrova MF, Jiang P, Margolskee RF & Kolesnikov SS (2007). Afferent neurotransmission mediated by hemichannels in mammalian taste cells. EMBO J 26, 657–667.
- Roper SD & Chaudhari N (2017). Taste buds: cells, signals and synapses. Nat Rev Neurosci 18, 485–497.
- Sagheddu C, Boccaccio A, Dibattista M, Montani G, Tirindelli R & Menini A (2010). Calcium concentration jumps reveal dynamic ion selectivity of calcium‐activated chloride currents in mouse olfactory sensory neurons and TMEM16b‐transfected HEK 293T cells. J Physiol 588, 4189–4204.
- Schroeder BC, Cheng T, Jan YN & Jan LY (2008). Expression cloning of TMEM16A as a calcium‐activated chloride channel subunit. Cell 134, 1019–1029.
- Scudieri P, Caci E, Bruno S, Ferrera L, Schiavon M, Sondo E, Tomati V, Gianotti A, Zegarra‐Moran O, Pedemonte N, Rea F, Ravazzolo R & Galietta LJV (2012). Association of TMEM16A chloride channel overexpression with airway goblet cell metaplasia. J Physiol 590, 6141–6155.
- Seo Y, Lee HK, Park J, Jeon D‐K, Jo S, Jo M & Namkung W (2016). Ani9, a novel potent small‐molecule ANO1 inhibitor with negligible effect on ANO2. PLoS ONE 11, e0155771.
- Sinclair MS, Perea‐Martinez I, Dvoryanchikov G, Yoshida M, Nishimori K, Roper SD & Chaudhari N (2010). Oxytocin signaling in mouse taste buds. PLoS One 5, e11980.
- Stephan AB, Shum EY, Hirsh S, Cygnar KD, Reisert J & Zhao H (2009). ANO2 is the cilial calcium‐activated chloride channel that may mediate olfactory amplification. Proc Natl Acad Sci U S A 106, 11776–11781.
- Stöhr H, Heisig JB, Benz PM, Schöberl S, Milenkovic VM, Strauss O, Aartsen WM, Wijnholds J, Weber BHF & Schulz HL (2009). TMEM16B, a novel protein with calcium‐dependent chloride channel activity, associates with a presynaptic protein complex in photoreceptor terminals. J Neurosci 29, 6809–6818.
- Taruno A, Vingtdeux V, Ohmoto M, Ma Z, Dvoryanchikov G, Li A, Adrien L, Zhao H, Leung S, Abernethy M, Koppel J, Davies P, Civan MM, Chaudhari N, Matsumoto I, Hellekant G, Tordoff MG, Marambaud P & Foskett JK (2013). CALHM1 ion channel mediates purinergic neurotransmission of sweet, bitter and umami tastes. Nature 495, 223–226.
- Taylor R & Roper S (1994). Ca2+‐dependent Cl– conductance in taste cells from Necturus. J Neurophysiol 72, 475–478.
- Teng B, Wilson CE, Tu Y‐H, Joshi NR, Kinnamon SC & Liman ER (2019). Cellular and neural responses to sour stimuli require the proton channel otop1. Curr Biol 29, 3647–3656.e5.
- Tizzano M, Grigereit L, Shultz N, Clary MS & Finger TE (2015). Immunohistochemical analysis of human vallate taste buds. Chem Senses 40, 655–660.
- Tomchik SM, Berg S, Kim JW, Chaudhari N & Roper SD (2007). Breadth of tuning and taste coding in mammalian taste buds. J Neurosci 27, 10840–10848.
- Tu Y‐H, Cooper AJ, Teng B, Chang RB, Artiga DJ, Turner HN, Mulhall EM, Ye W, Smith AD & Liman ER (2018). An evolutionarily conserved gene family encodes proton‐selective ion channels. Science 359, 1047–1050.
- Vandenbeuch A, Anderson CB, Parnes J, Enjyoji K, Robson SC, Finger TE & Kinnamon SC (2013). Role of the ectonucleotidase NTPDase2 in taste bud function. Proc Natl Acad Sci U S A 110, 14789–14794.
- Vandenbeuch A, Clapp TR & Kinnamon SC (2008). Amiloride‐sensitive channels in type I fungiform taste cells in mouse. BMC Neurosci 9, 1.
- Vandenbeuch A, Zorec R & Kinnamon SC (2010). Capacitance measurements of regulated exocytosis in mouse taste cells. J Neurosci 30, 14695–14701.
- Wladkowski SL, Lin W, McPheeters M, Kinnamon SC & Mierson S (1998). A basolateral chloride conductance in rat lingual epithelium. J Membr Biol 164, 91–101.
- Yang R, Crowley HH, Rock ME & Kinnamon JC (2000). Taste cells with synapses in rat circumvallate papillae display SNAP‐25‐like immunoreactivity. J Comp Neurol 424, 205–215.
- Yang R, Dzowo YK, Wilson CE, Russell RL, Kidd GJ, Salcedo E, Lasher RS, Kinnamon JC & Finger TE (2020). Three‐dimensional reconstructions of mouse circumvallate taste buds using serial blockface scanning electron microscopy: I. Cell types and the apical region of the taste bud. J Comp Neurol 528, 756–771.
- Yang YD, Cho H, Koo JY, Tak MH, Cho Y, Shim W‐S, Park SP, Lee J, Lee B, Kim B‐M, Raouf R, Shin YK & Oh U (2008). TMEM16A confers receptor‐activated calcium‐dependent chloride conductance. Nature 455, 1210–1215.
- Ye W, Chang RB, Bushman JD, Tu Y‐H, Mulhall EM, Wilson CE, Cooper AJ, Chick WS, Hill‐Eubanks DC, Nelson MT, Kinnamon SC & Liman ER (2016). The K+ channel KIR2.1 functions in tandem with proton influx to mediate sour taste transduction. Proc Natl Acad Sci U S A 113, E229–E238.
- Yunos NM, Bellomo R, Story D & Kellum J (2010). Bench‐to‐bedside review: chloride in critical illness. Critical Care 14, 226.
- Zhang Y, Hoon MA, Chandrashekar J, Mueller KL, Cook B, Wu D, Zuker CS & Ryba NJP (2003). Coding of sweet, bitter, and umami tastes: different receptor cells sharing similar signaling pathways. Cell 112, 293–301.
- Zhang Y, Zhang Z, Xiao S, Tien J, Le S, Le T, Jan LY & Yang H (2017). Inferior olivary TMEM16B mediates cerebellar motor learning. Neuron 95, 1103–1111.e4.