1 INTRODUCTION
Acute kidney injury (AKI) is a severe burden to the health care system worldwide,, of which the incidence has been increasing over recent years. Renal ischemia–reperfusion injury (IRI) is an important pathophysiology mechanism for AKI, since the kidney is one of the most sensitive organs to IRI due to its special structure and function., At present, the clinical benefit of interventions targeting at stages after occurrence of renal IRI is still limited, therefore, it is important to clarify the initiation mechanisms of renal IRI, to seek potential targets for early intervention of AKI.
Cellular injury and death of renal tubular epithelium are the main pathological features of renal IRI, of which the underlying mechanisms have always been subjected to research. Multiple cell death modes have been reported to be involved in renal tubular epithelial injury during IRI, including necrosis, apoptosis, autophagy, ferroptosis, and pyroptosis,, , among which pyroptosis has gained increasing attention as an earlier and faster cell death mode recently. Previous studies have shown that pyroptosis is closely related to the death of tubular cells during renal IRI., , , , , Inhibition of pyroptosis of renal tubular cells might be promising in early prevention and treatment of IRI‐induced AKI.
Label‐free quantification (LFQ) proteomic analysis is a pivotal method for screening targets of special significance without the need for isotopic labeling, which can be a limiting factor in many research settings. This approach allows for a comprehensive profiling of proteins in biological samples, which might reveal novel biomarkers and pathways involved in the pathogenesis of diseases, holding the promise of identifying new therapeutic targets. LFQ proteomic analysis has been used in kidney diseases to identify potential targets for more effective clinical interventions., ,
This study used LFQ proteomic analysis to identify new targets in AKI‐related renal tubular injury and investigate the potential mechanisms. Significant changes in cysteinyl‐tRNA synthetase (CARS) in renal tubular cells were observed during IRI. Our findings showed that CARS expression decreased over time and was linked to pyroptosis. Modifying CARS affected adenosine triphosphate (ATP) metabolism and altered the expression of pyroptosis‐related proteins during hypoxia/reoxygenation (H/R) and IRI treatments. Our findings might add to the current understanding of tubular injury in AKI.
2 RESULTS
2.1 CARS was downregulated in a time‐dependent manner and associated with pyroptosis
We used LFQ proteomics to identify proteins with significant expressions differences between H/R and normal HK‐2 cells (Figure 1A). Clustering analysis indicated CARS was significantly downregulated in H/R HK‐2 cells (Figure 1B). The reduction of CARS following H/R treatment was further confirmed by quantitative reverse transcription polymerase chain reaction (qRT‐PCR) (Figure S1). We then examined the effects of varying hypoxia durations on CARS and pyroptosis‐related proteins (CARS, NLRP3, Gasdermin D [GSDMD], Pro‐IL‐1β, IL‐1β, Pro‐caspase‐1, and caspase‐1) in H/R HK‐2 cells using Western blot analysis. CARS expression decreased over time with longer hypoxia, while pyroptosis‐related proteins increased (Figure 1C). These findings implied that CARS is downregulated in a time‐dependent manner in HK‐2 cells during H/R treatment. Subsequent experiments used 4 h of hypoxia followed by 24 h of reoxygenation.
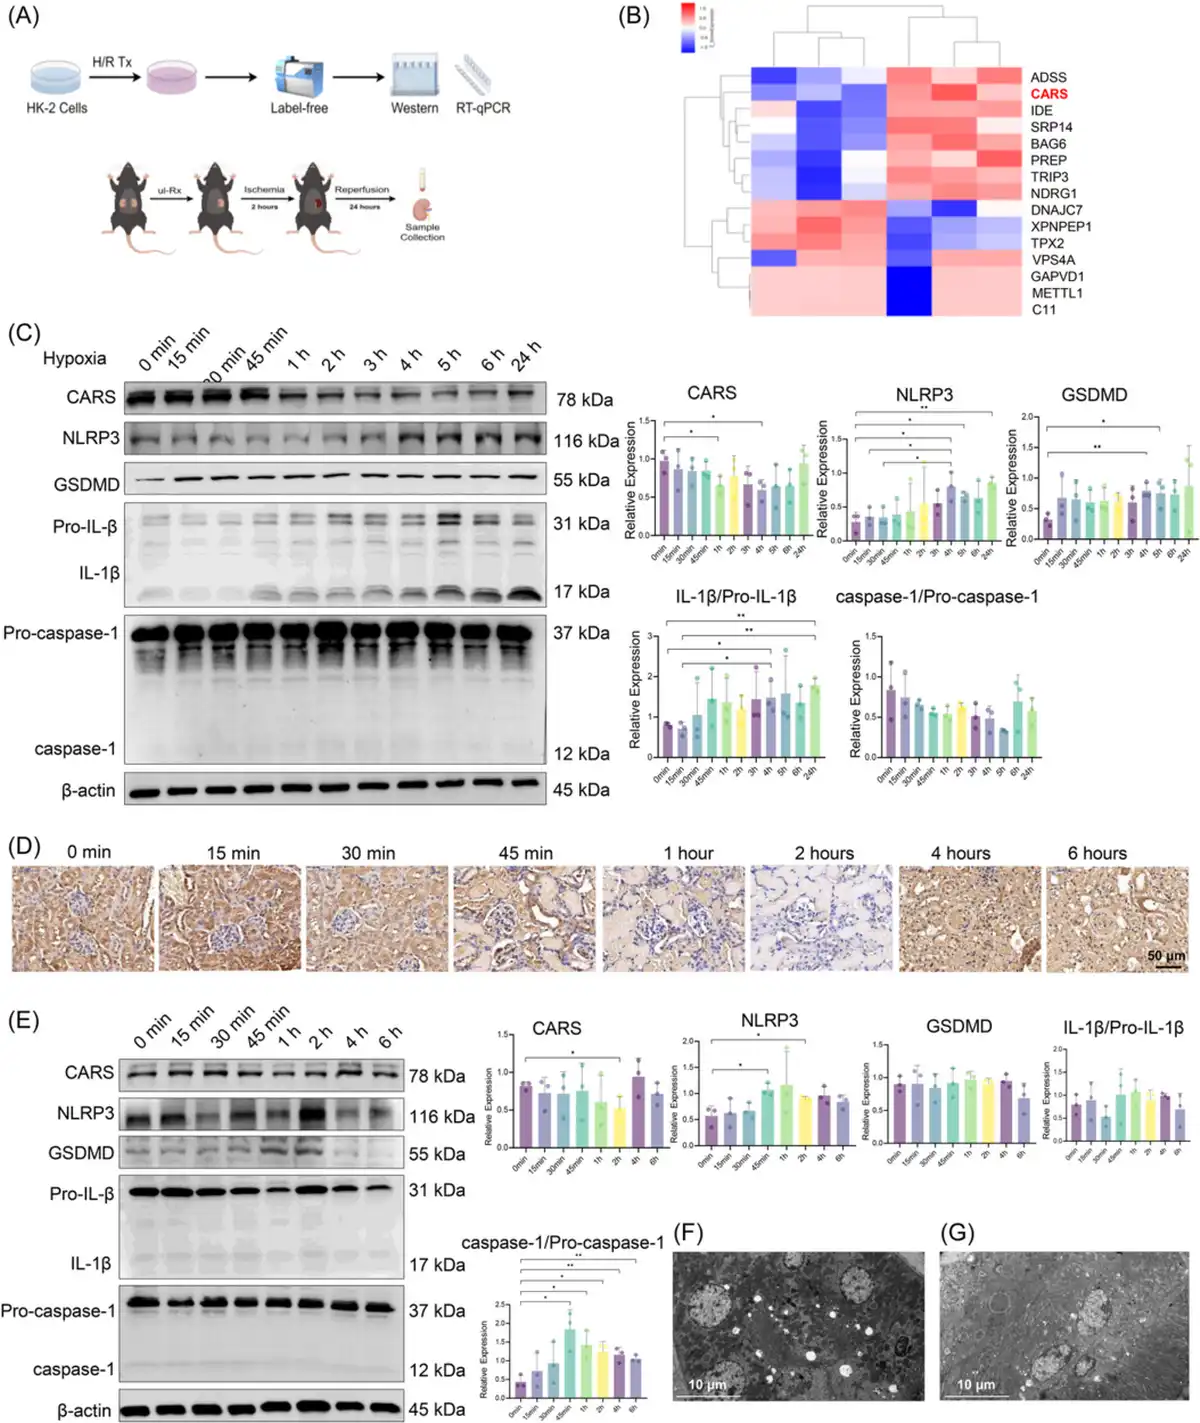
Figure 1
CARS was downregulated in a time‐dependent manner and associated with pyroptosis in the H/R HK‐2 cells and the IRI mice model. (A) The schematic diagram of experiments, (B) clustering heatmap from the triplicated results of LFQ, (C) Western blot analysis of CARS and pyroptosis‐related proteins after different durations of hypoxia, and (D) immunohistochemistry staining of CARS in the kidney tissue of IRI mice with different durations of ischemia. CARS was identified as brown deposits in the tissue. (E) Western blot analysis of CARS and pyroptosis‐related proteins in kidney tissues of IRI mice with different durations of ischemia, (F) transmission electronic microscopy examination of the kidney tissue of the IRI mice, and (G) transmission electronic microscopy examination of the kidney tissue of the wild‐type mice. Densitometric quantification normalized to β‐actin is shown to the right of the immunoblots. All data are presented as mean ± standard errors. *p < 0.05; **p < 0.01. CARS, cysteinyl‐tRNA synthetase; CTRL, control; GSDMD, Gasdermin D; H/R, hypoxia/reoxygenation; IL‐1β, interleukin‐1β; IRI, ischemia–reperfusion injury; LFQ, label‐free quantification; NLRP3, NOD‐like receptor protein 3; NOD, nucleotide‐binding and oligomerization domain; qRT‐PCR, quantitative reverse transcription polymerase chain reaction; tRNA, transfer RNA; Tx, treatment; ul‐Rx, unilateral nephrectomy.
Then we further investigated the expressions of CARS and pyroptosis‐related proteins in kidney tissues of mice during IRI treatment. The immunohistochemistry staining of CARS in the kidney tissue of IRI mice models showed a first decreased, then increased change as the ischemia duration prolonged (Figure 1D). Western blot results indicated that the expressions of CARS and pyroptosis‐related proteins in the kidney tissues of IRI mice changed in the same trends as those in H/R HK‐2 cells, again in a time‐dependent manner (Figure 1E). The expression of CARS also exhibited a first decreased, then increased change as the ischemia duration prolonged, while the expression of GSDMD and NLRP3 changed in the opposite trend. Changes of expression of IL‐1β/Pro‐IL‐1β and caspase‐1/Pro‐caspase‐1 were not significant. Consistent with the findings in HK‐2 cells, these results indicated CARS was also downregulated in a time‐dependent manner during IRI treatment in mice. The IRI treatment used for subsequent animal experiments was ischemia for 2 h/reperfusion for 24 h.
Transmission electronic microscopic examination of the kidney tissues observed multiple hollows that might originate from the rupture of bubbles during pyroptosis in the renal tubular cells of the IRI mice (Figure 1F), whereas the hollow lesions were absent in the renal tubular cells of the wild‐type mice (Figure 1G).
2.2 CARS was associated with alternation of ATP metabolism and pyroptosis in HK‐2 cells during H/R treatment
Having observed the downregulation of CARS and its association with pyroptosis‐related proteins, we further sought to clarify the impact of CARS on expressions of pyroptosis‐related proteins during H/R treatment. Customed hCARS‐shRNA and FLAG/hCARS vectors were used to decrease and increase the expression of CARS in H/R HK‐2 cells, respectively. The H/R treatment followed the cellular transfection (Figure 2A). Both ATP and adenosine monophosphate (AMP) increased early after H/R treatment in the HK‐2 cells and then entered a plateau phase (Figure 2B). The increased level of ATP upon H/R treatment was suppressed by overexpression of CARS, supporting the role to metabolize ATP of CARS (Figure 2C). Intervention of CARS also affected the expression of pyroptosis‐related proteins in H/R HK‐2 cells (Figure 2D). hCARS‐shRNA and FLAG/hCARS vectors worked efficiently in H/R HK‐2 cells. The expression of NLRP3 and GSDMD increased upon knocking down CARS by hCARS‐shRNA and decreased following overexpression of CARS. The expression of IL‐1β/Pro‐IL‐1β and caspase‐1/Pro‐caspase‐1 did not change significantly. Taken together, these results indicated CARS was associated with pyroptosis and ATP metabolism in HK‐2 cells during H/R treatment.
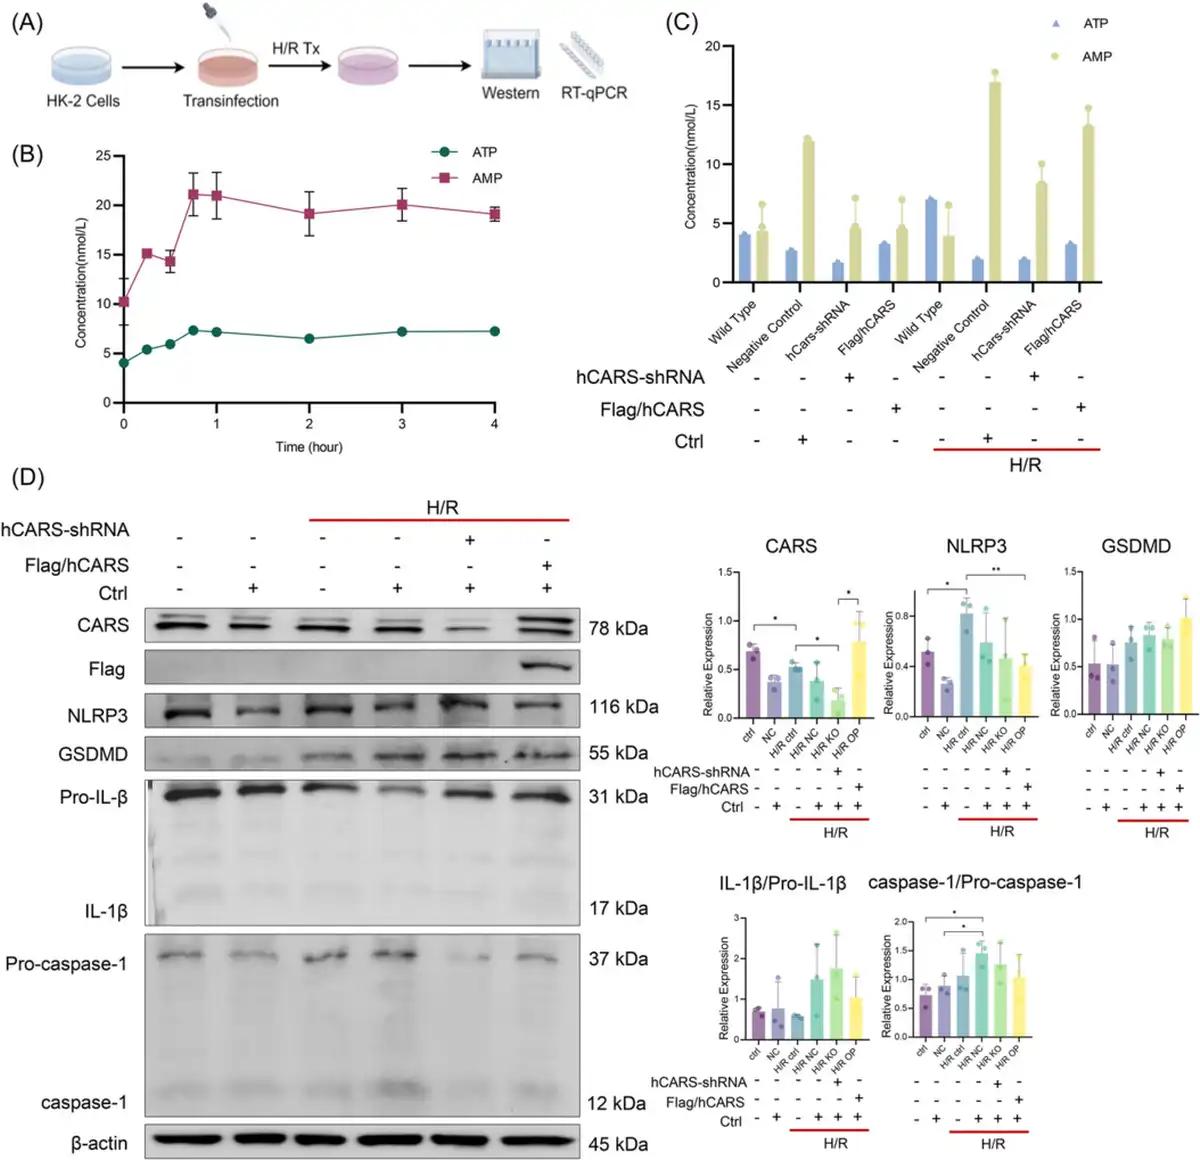
Figure 2
CARS was associated with an alternation of ATP metabolism and pyroptosis in H/R HK‐2 cells. (A) The schematic diagram of the experiments, (B) concentrations of ATP and AMP in H/R HK‐2 cells after H/R treatment with different hypoxia durations, (C) concentrations of ATP and AMP in normal and H/R HK‐2 cells after interventions of CARS expression, and (D) Western blot analysis CARS and pyroptosis‐related proteins in normal and H/R HK‐2 cells after intervention of CARS expression. Densitometric quantification normalized to β‐actin is shown to the right of the immunoblots. All data are presented as mean ± standard errors. *p < 0.05; **p < 0.01. AMP, adenosine monophosphate; ATP, adenosine triphosphate; CARS, cysteinyl‐tRNA synthetase; CTRL, control; GSDMD, Gasdermin D; H/R, hypoxia/reoxygenation; H/R, hypoxia/reoxygenation; IL‐1β, interleukin‐1β; KO, knock out; NLRP3, NOD‐like receptor protein 3; NOD, nucleotide‐binding and oligomerization domain; OP, overexpression; shRNA, small hairpin RNA; tRNA, transfer RNA; Tx, treatment.
2.3 CARS was associated with pyroptosis in mice kidney tissues during IRI
To further explore the impact of CARS on pyroptosis during IRI, we then examined the expressions of pyroptosis‐related proteins during IRI after the intervention of CARS expression in IRI mice models (Figure 3A). Successful knocking down was confirmed by ex vivo bioluminescence imaging (Figure 4B) and Western blot analysis (Figure 3C). Pathology examination revealed obvious renal tubular injury after IRI treatment, which was exacerbated after knocking down CARS using the hCARS‐shRNA vector, whereas it improved after the dexamethasone (DEX) treatment (Figure 3D). The immunohistochemistry staining analysis revealed the expression of NLRP3 increased during IRI treatment and to an even greater extent after knocking down CARS using mice Cars (mCars)‐shRNA (Figure 3D). The results of the Western blot confirmed the increase in NLRP3 after knocking down CARS (Figure 3E). These results suggested CARS was associated with pyroptosis in mice kidney tissue during IRI, consistent with the findings in cell experiments. Deceased expression of CARS was able to exacerbate the pyroptosis upon IRI treatment.
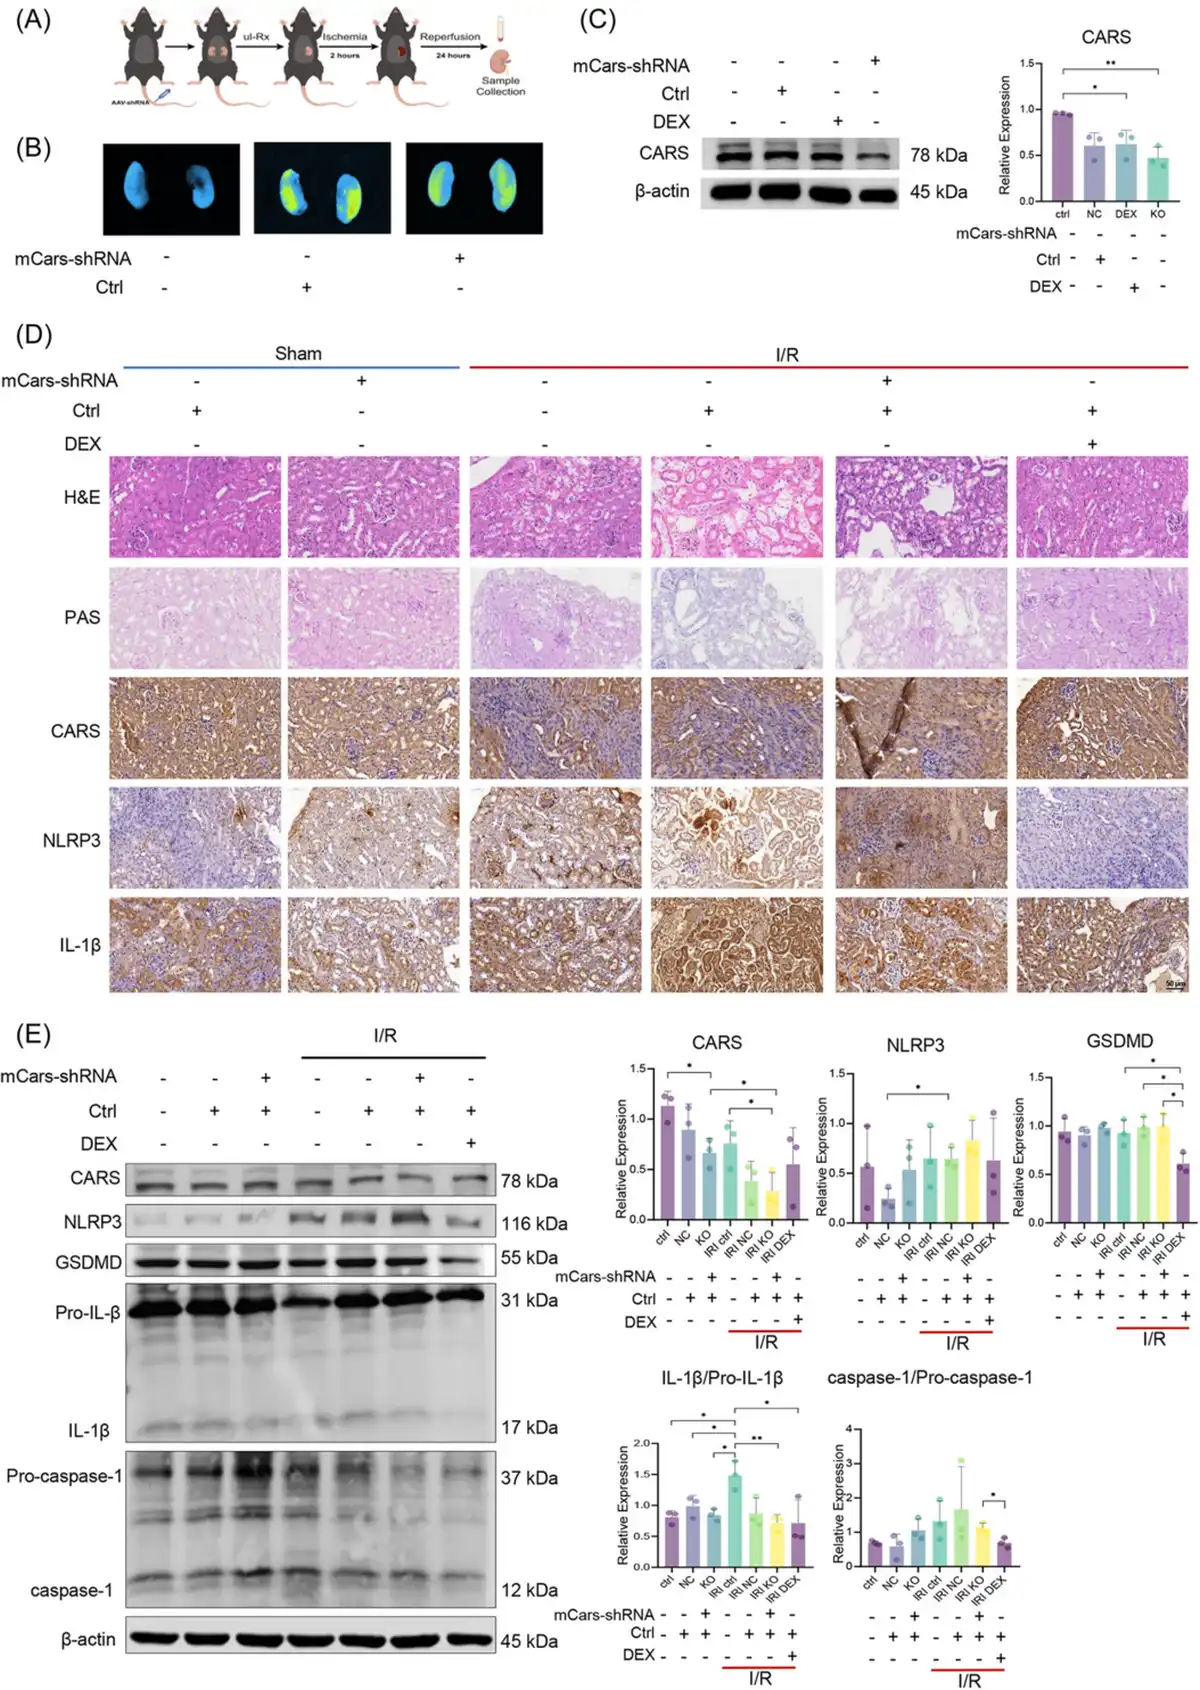
Figure 3
Expression of CARS and pyroptosis‐related proteins in the kidney tissues of IRI mice. (A) The schematic diagram of the experiments, (B) ex vivo bioluminescence image of mouse kidneys, showing the transfection of mCars‐shRNA, (C) Western blot analysis of CARS after knocking down CARS using mCars‐shRNA, and (D) immunohistochemistry staining of CARS and pyroptosis‐related proteins in the kidney tissues of IRI mice after knocking down CARS using mCars‐shRNA. Positive staining results were identified as brown deposits. (E) Western blot analysis of CARS and pyroptosis‐related proteins in the kidney tissues of the IRI mice model after knocking down CARS using mCars‐shRNA. Densitometric quantification normalized to β‐actin is shown to the right of the immunoblots. All data are presented as mean ± standard errors. *p < 0.05; **p < 0.01. CARS, cysteinyl‐tRNA synthetase; CTRL, control; DEX, dexamethasone; DEX, dexamethasone; GSDMD, Gasdermin D; H&E, hematoxylin and eosin; I/R, ischemia/reperfusion; IL‐1β, interleukin‐1β IRI, ischemia–reperfusion injury; KO, knock out; mCars, mice Cars; NC, negative control; NLRP3, NOD‐like receptor protein 3; PAS, periodic acis‐schiff staining; shRNA, small hairpin RNA; tRNA, transfer RNA; Tx, treatment; ul‐Rx, unilateral nephrectomy.
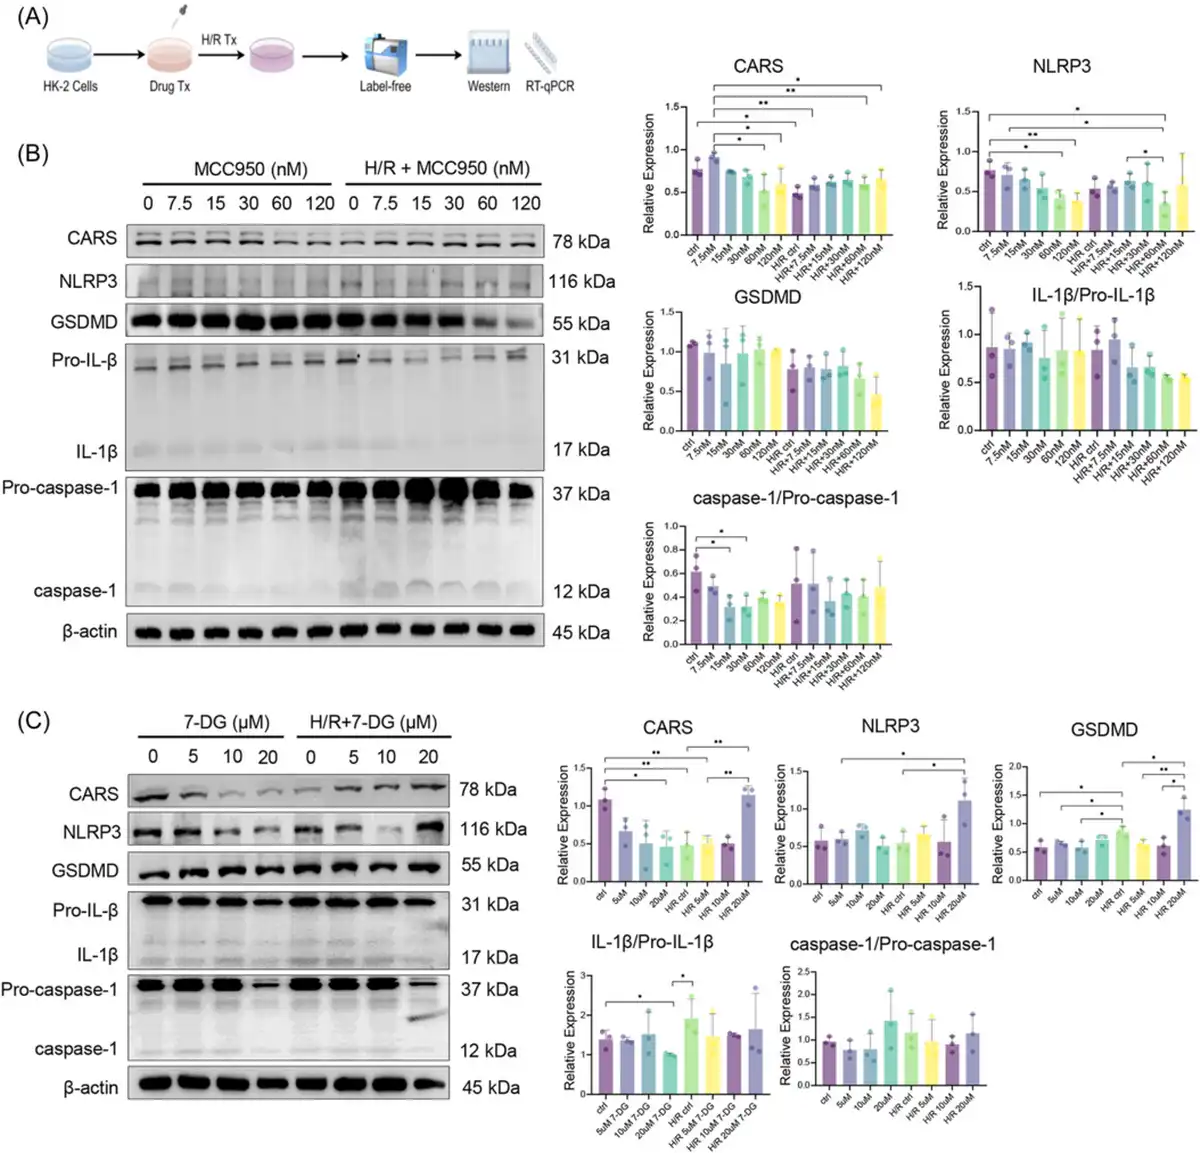
Figure 4
Expression of CARS and pyroptosis‐related proteins after H/R treatment and pyroptosis regulation. (A) The schematic diagram of the experiments, (B) expression of CARS and pyroptosis‐related proteins upon H/R treatment and pyroptosis inhibition by MCC950 in different concentrations, (C) expression of CARS and pyroptosis‐related proteins upon H/R treatment and pyroptosis activation by 7‐DG in different concentrations. Densitometric quantification normalized to β‐actin is shown to the right of the immunoblots. All data are presented as mean ± standard errors. *p < 0.05; **p < 0.01. CARS, cysteinyl‐tRNA synthetase; GSDMD, Gasdermin D; H/R, hypoxia/reoxygenation; IL‐1β, interleukin‐1β; NLRP3, NOD‐like receptor protein 3; qRT‐PCR, quantitative reverse transcription polymerase chain reaction; tRNA, transfer RNA; Tx, treatment.
2.4 Pyroptosis regulation affected CARS during H/R treatment
After verifying that CARS affected expressions of pyroptosis‐related proteins during H/R treatment, we then examined the interactions of CARS and pyroptosis‐related proteins by interfering pyroptosis. MCC950 and 7‐DG were used to inhibit and activate pyroptosis in HK‐2 cells, respectively. The H/R treatment followed pyroptosis regulation (Figure 4A). The expression of NLRP3 and GSDMD increased upon H/R treatment and decreased following the MCC950 treatment, whereas the expression of CARS exhibited the opposite changes (Figure 4B). The expression of IL‐1β and caspase‐1 did not show significant changes. The treatment of 7‐DG has the opposite results, which caused the strongest expression of NLRP3 and GSDMD at the concentration of 10 μm (Figure 4C). The expression of CARS did not change much at this concentration of 7‐DG. The expression of IL‐1β/Pro‐IL‐1β and caspase‐1/Pro‐caspase‐1 did not change significantly. These results indicated the pyroptosis regulation was able to affect the expression of CARS during H/R treatment, further supporting the close correlation of CARS and pyroptosis upon H/R treatment.
2.5 CARS overexpression upregulated pyroptosis‐related proteins following H/R treatment
To further explore the association between CARS and pyroptosis, we then examined the expression of CARS and pyroptosis‐related proteins during the combined H/R treatment and pyroptosis regulation (Figure 5A). The results of Western blot indicated that the changes of NLRP3 and GSDMD during MCC950 treatment were further enhanced after CARS overexpression (Figure 5B) and the increased expression of NLRP3 and GSDMD following 7‐DG treatment became even more obvious after CARS silencing (Figure 5C). The expression of IL‐1β/Pro‐IL‐1β and caspase‐1/Pro‐caspase‐1 did not show significant changes.
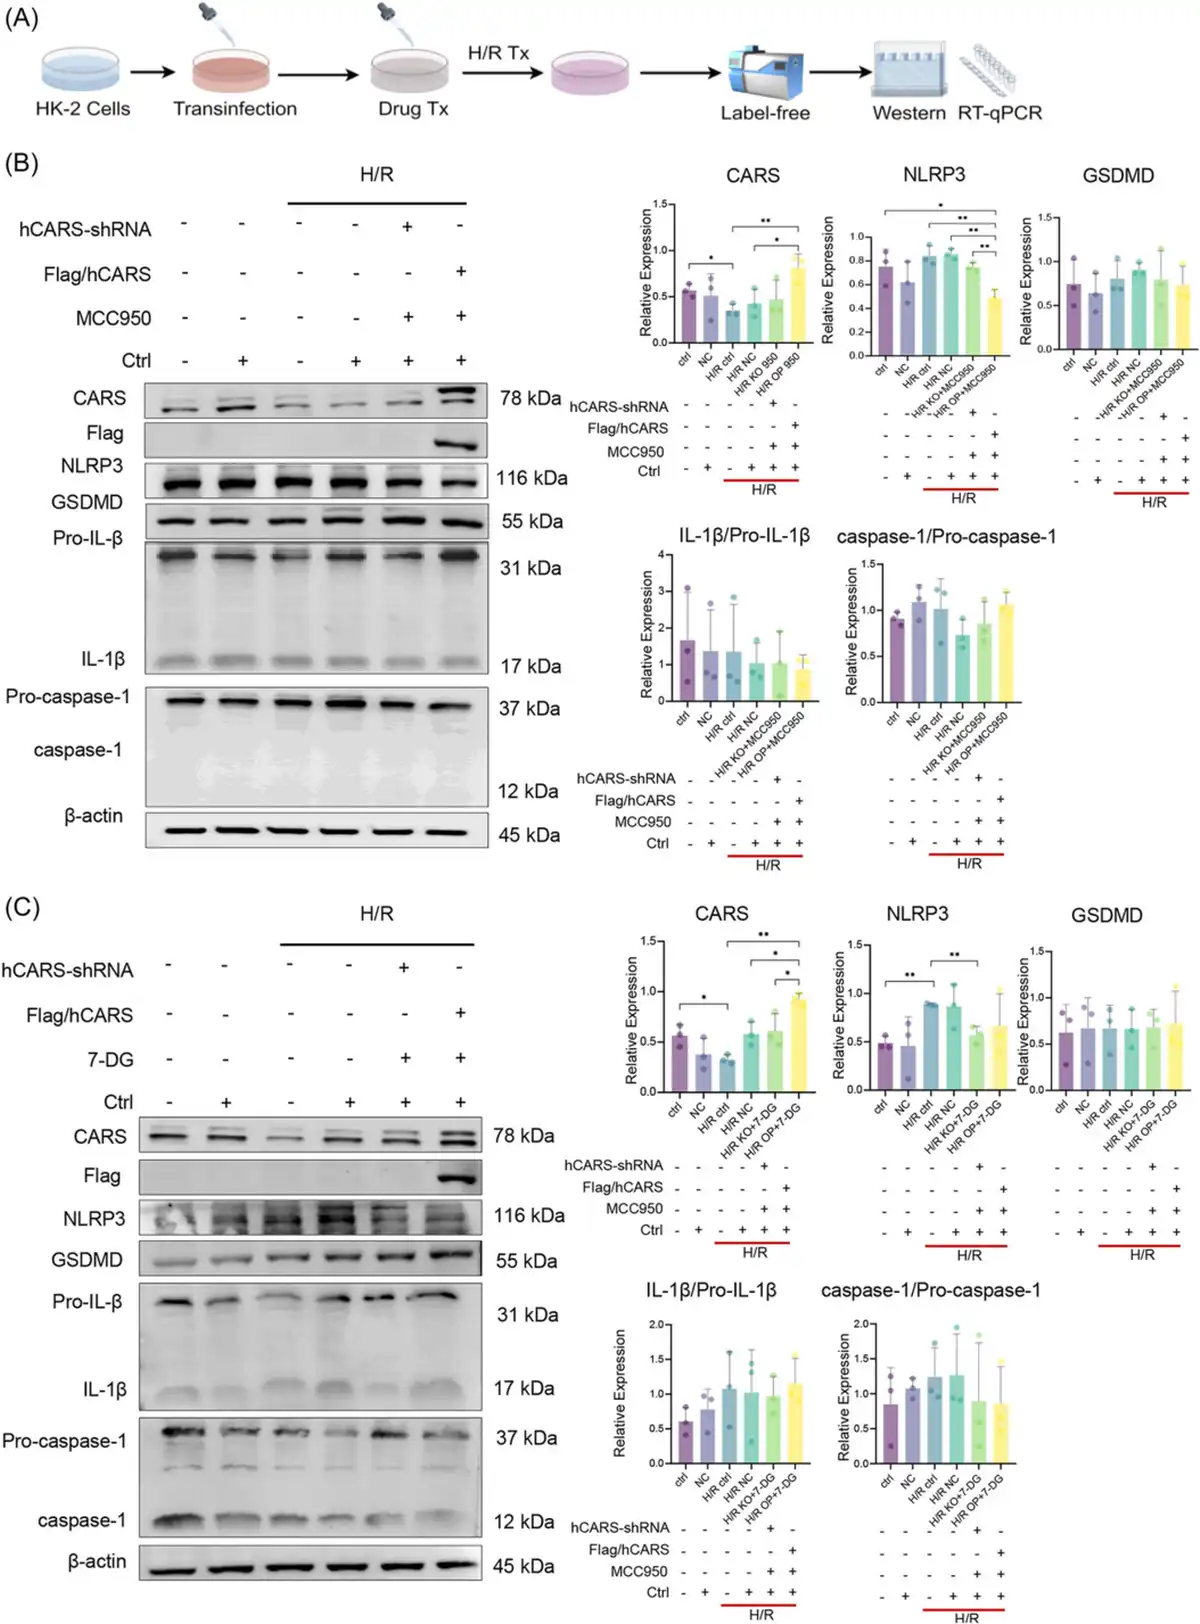
Figure 5
Expression of CARS and pyroptosis‐related proteins after the combination of pyroptosis regulation and CARS intervention in H/R HK‐2 cells. (A) The schematic diagram of the experiments, (B) expression of CARS and pyroptosis‐related proteins after CARS intervention and pyroptosis inhibition by MCC950 in H/R HK‐2 cells, (C) expression of CARS and pyroptosis‐related proteins after CARS intervention and pyroptosis activation by 7‐DG in H/R HK‐2 cells. Densitometric quantification normalized to β‐actin is shown to the right of the immunoblots. All data are presented as mean ± standard errors. *p < 0.05, **p < 0.01. CARS, cysteinyl‐tRNA synthetase; Ctrl, control; GSDMD, Gasdermin D; H/R, hypoxia/reoxygenation; IL‐1β, interleukin‐1β; KO, knock out; NC, negative control; NLRP3, NOD‐like receptor protein 3; OP, overexpression; qRT‐PCR, quantitative reverse transcription polymerase chain reaction; shRNA, small hairpin RNA; tRNA, transfer RNA; Tx, treatment.
3 DISCUSSION
This study for the first‐time reports CARS is associated with renal tubular damage induced by IRI, potentially involving pyroptosis (Figure 6). Our findings started with proteomic analysis that proved CARS was significantly downregulated in human renal tubular cells during IRI. Experimental exploration indicated the downregulation of CARS upon the IRI treatment and hinted at the close correlation between CARS and pyroptosis. Knocking down CARS exacerbated the injury of renal tubular cells after IRI treatment, whereas overexpression of CARS exhibited the opposite impact.
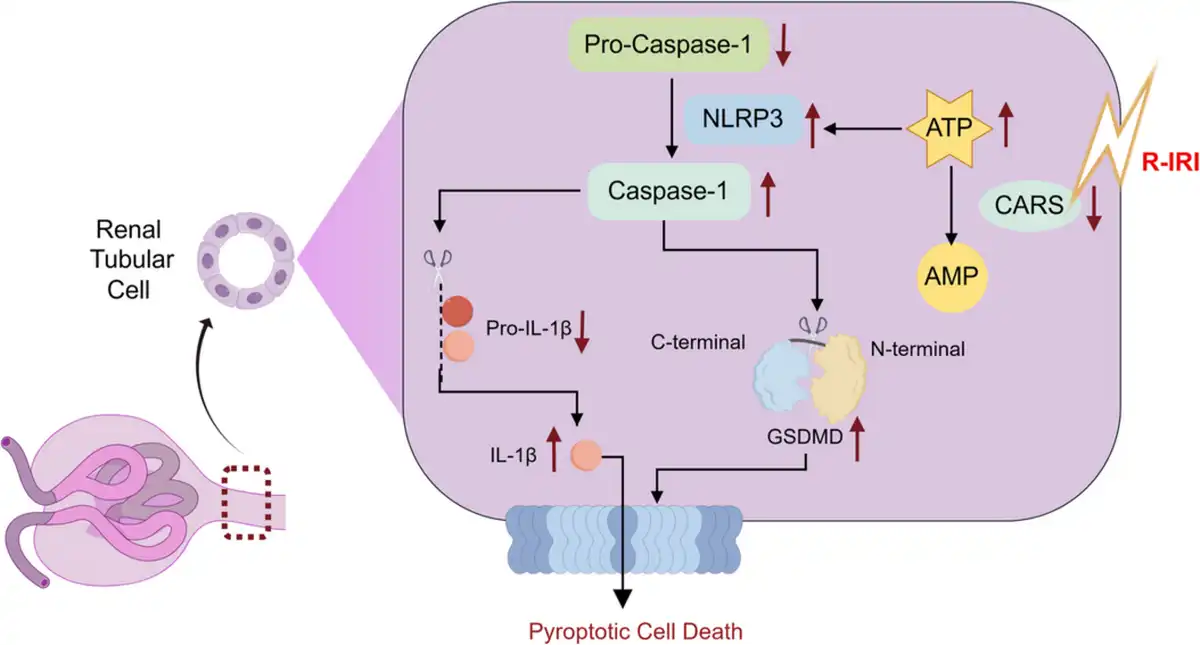
Figure 6
Schematic illustration of the role of CARS in alleviating pyroptosis in renal tubular cells in renal IRI. Upon the stress of renal IRI, the expression of CARS decreases, resulting in an impaired metabolism of ATP. The accumulation of ATP, in turn, enhanced the assembly of NLRP3 inflammasome, therefore exacerbating the pyroptosis injury of renal tubular epithelial cells. AMP, adenosine monophosphate; ATP, adenosine triphosphate; CARS, cysteinyl‐tRNA synthetase; GSDMD, Gasdermin D; IL‐1β, interleukin‐1β; NLRP3, NOD‐like receptor protein 3; NLRP3, NOD‐like receptor protein 3; R‐IRI, renal ischemia–reperfusion injury; tRNA, transfer RNA.
Pyroptosis is a physiology process manifested by release of large number of inflammatory cytokines, which causes progressive cell swelling until the cell membrane ruptures, and then triggers immune cascade reactions in injured tissue., During renal IRI, pyroptosis of renal tubular epithelial cells was accompanied by the injury and death of renal tubular epithelium, loss of renal function and renal tissue damage., Consistent with the existing literature, our findings implied the involvement of pyroptosis in renal IRI. In addition, we identified a potentially novel regulatory of pyroptosis, that is, CARS, in renal tubular cells during IRI and indicated the close relationship between CARS and pyroptosis.
CARS is a member of aminoacyl‐tRNA synthetase family, and participates in regulation of multiple biological process including splicing RNA, regulation of transcription and translation, and signaling., , CARS catalyzes the synthesis of cysteine hydropersulfide from L‐cysteine as well as cotranslational cysteine polysulfidation, therefore being involved in the regulation of bioenergetics. The normal function of CARS requires ATP hydrolysis., , Since CARS metabolizes ATP, which is a proven stimulator of pyroptosis, we suspected CARS might be involved in the damage of renal tubular epithelial cells in IRI‐induced AKI via pyroptosis. When the expression of CARS is altered in human renal proximal tubular epithelial cells during IRI, CARS is not able to effectively catalyze ATP hydrolysis, resulting in the blocked ATP utilization inside the cells, , and, in turn, inducing the assembly of NLRP3 inflammasome, which activates the downstream caspase‐1 dependent pyroptosis and causes significant cell damage if the injury persists., In this study, it was observed that during IRI, cell death accompanied by ATP utilization disorder and the changed expression of CARS occurred in renal tubular epithelial cells, and knockdown of CARS further aggravated ATP utilization disorder, suggesting that CARS may participate in pyroptosis via ATP pathway.
Therefore, CARS might be a potential target of further strategies for managing IRI‐induced AKI, of which the underlying mechanism might be related to ATP metabolism; however, its detailed regulatory pathways are yet to be elucidated. Interventions targeting regulatory proteins on the pathway of pyroptosis might help early prevention and treatment of AKI. Our results implied CARS might be a potential target. Strategies that can stabilize CARS or maintain its normal function might be effective in alleviating tubular cell damage induced by renal IRI. To accomplish this target, we need to further explore the inherent regulatory mechanisms of CARS, providing evidence for the development of small molecular drugs.
There are some limitations that should be noted. First, we did not observe the expected increased expression of NLRP3 after knocking down CARS in HK‐2 cells, nor the expected decreased expression of NLRP3 after combined treatment of CARS overexpression and pyroptosis inhibition in the IRI mice model. The expression of IL‐1β and caspase‐1 also had similar results. The possible explanation is that these proteins are regulated by more than one mechanism including CARS, therefore their changes might be jointly influenced by multiple factors. Interventions specific to CARS might not be strong enough to exhibit obvious effects. In addition, there might be some crosstalk by which CARS regulates pyroptosis, but yet to be elucidated. Second, the knocking down efficiency was suboptimal. As this is an exploratory study, using genetic knockout mice, particularly conditional knockout mice, to further explore the role of CARS in renal IRI and its upstream regulatory mechanisms will be our next step. Third, although many other programmed cell deaths, including autophagy, apoptosis, and ferroptosis, are reported to be involved in renal tubular injury in AKI, whether the crosstalk between pyroptosis and other programmed cell deaths is involved in IRI‐AKI and other AKI subtypes was not examined in this study and awaits further clarification.
In summary, our findings suggested CARS is associated with renal tubular damage during IRI, potentially involving pyroptosis; however, the detailed regulatory mechanism remains unclear. Future investigations of regulatory mechanisms of CRAS in pyroptosis might help establish its role as a potential target for early intervention of AKI.
4 MATERIALS AND METHODS
4.1 Cells and mice
Human renal proximal tubular epithelial cells (HK‐2) were purchased from the Cell Bank of the Chinese Academy of Sciences and cultivated in Dulbecco's Modified Eagle Medium/Nutrient Mixture F‐12 (DF‐12) medium (Hyclone), supplemented with 10% fetal bovine serum, 100 U/mL penicillin, and 100 μg/mL streptomycin. Male C57BL/6 mice aged 8–10 weeks and weighing 18–22 g were purchased from Chengdu Dashuo Experimental Animal Center and allowed to acclimate with free access to water and food for 1 week before use. All animal care procedures were conducted in compliance with the institutional guidelines for the use and care of animals established by Sichuan Provincial People's Hospital.
4.2 Vector construct
Experimental vectors were purchased from Vector Builder, including DNA vector pRP[Exp]‐EGFP‐EF1A > FLAG/hCARS (FLAG/hCARS) for overexpress CARS in HK‐2 cells, small hairpin RNA (shRNA) vector pRP[Exp]‐EGFP‐U6 > hCARS (hCARS‐shRNA) for knocking down CARS in HK‐2 cells, and ultra‐purified adenovirus vector pAV[shRNA]‐EGFP‐U6 > mCars shRNA (mCars‐shRNA) for knocking down CARS in the IRI mouse model. For details of the vectors, please see Figure S2.
4.3 HK‐2 H/R model
HK‐2 cells were cultured following the supplier's instruction. Cells that had reached a confluence of 80% were put into the MIC‐101 Anoxic Modular Incubator System (Billups Rosenberg) equipped with an oxygen (O2) concentration detector for hypoxia–reperfusion treatment. Upon closing the incubator, the airflow switch was turned on to supply mixed gas (95% N2 and 5% CO2). The airflow rate was changed from initial high‐volume ventilation to low‐volume ventilation when the O2 concentration dropped to 0.5 and maintained for 15 min to allow the O2 concentration to reach 0.1. Then the airflow switch was turned off, and the whole incubator system was transferred to a CO2 incubator and cultured at 37°C for different durations of hypoxia treatment, including 0, 15, 30, and 45 min and 1, 2, 3, 4, 5, 6, and 24 h. Then the cells were removed from the MIC‐101 system and continued another 24 h of culture in the CO2 incubator for reperfusion treatment. Cell viability was determined by CCK‐8 assay.
4.4 LFQ proteomics
The mass spectrometry data for H/R HK‐2 cells were analyzed using MaxQuant software (version 1.5.6.0) based on established protocols. UNIPROT database was used, and the reverse decoy of the protein was searched against using MaxQuant. The LFQ method, incorporating a match between runs and iBAQ, was employed to enhance accuracy. Trypsin was designated as the enzyme, permitting up to three missed cleavages. Variable modifications included oxidation [M] and acetylation [protein N‐term] (up to three per peptide), while carbamidomethyl [C] served as the fixed modification. Stringent criteria were implemented, with an FDR for peptides and proteins set below 0.01. Unique and razor peptides were exclusively utilized for quantification, adhering to default parameters for all other settings. Proteins exhibiting significant expression differences between H/R HK‐2 cells and normal HK‐2 cells were selected for clustering analysis.
4.5 Cell transfection
HK‐2 cells were transfected with FLAG/hCARS and hCARS shRNA using Lipofectamine 3000 (Invitrogen) in Opti‐MEM (Life Technologies), adhering to the protocols provided by the manufacturers. The cells were then continuously cultured for 70 h and harvested afterwards. The efficacy of transfection was determined by Western blot analysis.
4.6 Pyroptosis intervention
NLRP3 antagonist MCC950 (Selleck) and caspase‐1 agonist 7‐DG (Sigma) were added to a fresh cell culture medium to inhibit and activate pyroptosis, respectively. The treatment duration was 24 h. HK‐2 cells for the H/R HK‐2 model received H/R treatment as described above afterwards.
4.7 Quantitative RT‐PCR
Total RNA from HK‐2 cells was isolated using Trizol reagent (Life Technologies) following the provided protocol. Reverse transcription was performed using the PrimeScript RT Reagent Kit and random primers (TaKaRa), with reactions set up in an S1000 Thermal Cycler (Bio‐Rad). PCR amplification was carried out using the CFX96 Real‐Time System (Bio‐Rad). The primer sequences for CARS were forward 5′‐CAGCAAAGCTGGCCAAGATG‐3′ and reverse 5′‐TGGGCAGACCATGCTTACATT‐3′. Glyceraldehyde‐3‐phosphate dehydrogenase served as the housekeeping gene, and the relative expression levels were calculated using the method.
4.8 ATP and AMP determination
Cellular ATP and AMP levels were determined using ATP Assay Kit (Promega) and AMP Assay Kit (Abcam), in accordance with the manufacturer's instructions.
4.9 Western blot analysis
Cell and tissue samples were lysed in radio Immunoprecipitation Assay Lysis buffer buffer (Beyotime), and protein concentrations were determined using the bicinchoninic acid assay. Proteins were denatured at 99°C for 5 min in a metal bath (Wealtec) and subsequently separated by sodium dodecyl sulfate–polyacrylamide gel electrophoresis. Following electrophoresis, proteins were transferred onto polyvinylidene difluoride membranes (Thermo Fisher Scientific) at 100 V and blocked with 5% bovine serum albumin (Solarbio). Membranes were incubated overnight at 4°C with the following primary antibodies: anti‐caspase‐1 (rabbit, 1:1000, Abcam, Cat#: ab179515), anti‐IL‐1β (rabbit, 1:1000, ZenBio, Cat#: 516288), anti‐NLRP3 (rabbit, 1:500, Abcam, Cat#: ab214185), anti‐CARS (rabbit, 1:1000, Abcam, Cat#: ab235536), anti‐GSDMD (rabbit, 1:1000, Abcam, Cat#: ab209845), and anti‐β‐actin (rabbit, 1:5000, Proteintech, Cat#: HRP‐60008). After washing, membranes were incubated for 2 h at room temperature with a horseradish peroxidase (HRP)‐conjugated secondary antibody (ABclonal). Protein signals were detected using the Image Quant LAS 4000 imaging system (Amersham). Band intensities were normalized to β‐actin and quantified using ImageJ software (NIH).
4.10 IRI surgical procedure
Surgical procedures were carried out under aseptic conditions. After a 12‐h fasting period with free access to water, C57BL/6 mice were anesthetized via intraperitoneal injection of a 1% sodium pentobarbital solution (50 mg/kg). The mice were then positioned supine and maintained at a temperature of 32°C throughout the surgical procedure. The abdominal cavity was opened via a ventral midline incision and bilateral renal pedicles were exposed after dissecting soft tissues around kidneys. For mice in the IRI experimental group, bilateral renal arteries and veins were clamped using microvascular clamps (RoBoz Surgical Instrument Co) for 2 h, followed by clamp removal and layered closure of the abdominal cavity. In the sham operation group, the bilateral renal pedicles were exposed but left unclamped. After the operation, the mice were euthanized 24 h afterwards to collected tissue samples. Each kidney was cut into halves, of which one was stored at −80°C refrigerator for subsequent tests, and the other was fixed in 4% paraformaldehyde for further examination. The research protocol had been approved by the Institutional Review Board of Sichuan Provincial People's Hospital (Approval No. 2018.76) and conducted in compliance with local animal care guidelines.
4.11 CARS interference
To interfere with the expression of CARS, mice in the CARS knockdown group were injected with an ultra‐purified adenovirus vector that carried mCars‐shRNA via the caudal vein 14 days before the IRI surgical procedures. The number of adenovirus vector was 10 × 1010 in each mouse. In contrast, mice in the negative control group were injected with 100 μL adenovirus via caudal vein 14 days before the IRI surgical procedures. Mice in the DEX group were intraperitoneally injected DEX (6 mg/kg) 30 min before the IRI surgical procedures. The efficiency of interference was evaluated using GFP embedded in the mCars‐shRNA vector by ex vivo bioluminescence imaging.
4.12 Pathological examinations
Sections (2 μm thickness) were prepared from kidney samples that had been embedded in paraffin wax, deparaffinized with xylene, and hydrated with graded ethanol. Hematoxylin–eosin stain and periodic acid Schiff stain of the sections were performed for light microscopic examinations. For immunohistochemistry, the sections were incubated with monoclonal primary antibodies overnight at 4°C, followed by incubation with a biotinylated secondary antibody (Proteintech) at room temperature for 2 h. 3,3'‐diaminobenzidine chromogenic substrate (Zsbio) was applied to visualize the staining. Nuclei were counterstained with hematoxylin (Solarbio) and differentiated with a 1% hydrochloric acid alcohol solution (Solarbio). Transmission electronic microscopy examination was also conducted as per local operation procedure.
4.13 Statistical analyses
Values were expressed as means ± standard deviation. To assess group differences, the unpaired Student's t test was employed for normally distributed variables, while the Mann–Whitney U test was utilized for skewed distributions. Statistical significance was defined as a two‐sided p < 0.05. All statistical analyses and graphical representations were conducted with GraphPad Prism version 8.6 (GraphPad Software).
AUTHOR CONTRIBUTIONS
Yunlin Feng, Yi Li, and Guisen Li contributed to study conception and design. Hongsha Yang, Meidie Yu, Liming Huang, and Yun Tang contributed to experiments and data curation. Yunlin Feng, Hongsha Yang, Pan Song, Meidie Yu, and Yi Li contributed to data interpretation and analysis. Hongsha Yang and Yunlin Feng drafted the manuscript. All authors revised the manuscript critically to incorporate important intellectual content. All authors gave final approval of the version to be submitted.
CONFLICT OF INTEREST STATEMENT
The authors declare no conflicts of interest.
ETHICS STATEMENT
All animal experiments had been approved by the Institutional Review Board of Sichuan Provincial People's Hospital (No. 2018.76) and carried out in accordance with local animal care guidelines.
ACKNOWLEDGMENTS
We sincerely thank Prof. Martin Gallagher for revising the English writing. We also thank Figdraw for providing the online platform, which enabled the creation of the mechanistic figure. This work was partly supported by National Natural Science Foundation of China (81800613 and 81700607), Sichuan Science and Technology Support Program (2023YFSY0027 and 2019YFS0538), and Fundamental Research Funds for the Central Universities from UESTC (ZYGX2019J105).
REFERENCES
- 1. Mehta RL, Burdmann EA, Cerdá J, et al. Recognition and management of acute kidney injury in the international society of nephrology 0by25 global snapshot: a multinational cross‐sectional study. Lancet. 2016;387(10032):2017–2025.
- 2. Yang L, Xing G, Wang L, et al. Acute kidney injury in China: a cross‐sectional survey. Lancet. 2015;386(10002):1465–1471.
- 3. O'Neal JB, Shaw AD, Billings FT. Acute kidney injury following cardiac surgery: current understanding and future directions. Crit Care. 2016;20(1):187.
- 4. Zhao H, Alam A, Soo AP, George AJT, Ma D. Ischemia–reperfusion injury reduces long term renal graft survival: mechanism and beyond. EBioMedicine. 2018;28:31–42.
- 5. Liu BC, Tang TT, Lv LL, Lan HY. Renal tubule injury: a driving force toward chronic kidney disease. Kidney Int. 2018;93(3):568–579.
- 6. Martin‐Sanchez D, Fontecha‐Barriuso M, Sanchez‐Niño MD, et al. Cell death‐based approaches in treatment of the urinary tract‐associated diseases: a fight for survival in the killing fields. Cell Death Dis. 2018;9(2):118.
- 7. Sarhan M, von Mässenhausen A, Hugo C, Oberbauer R, Linkermann A. Immunological consequences of kidney cell death. Cell Death Dis. 2018;9(2):114.
- 8. Yang JR, Yao FH, Zhang JG, et al. Ischemia–reperfusion induces renal tubule pyroptosis via the CHOP‐caspase‐11 pathway. Am J Physiol—Renal Physiol. 2014;306(1):F75–F84.
- 9. Wu H, Huang T, Ying L, et al. MiR‐155 is involved in renal ischemia–reperfusion injury via direct targeting of FoxO3a and regulating renal tubular cell pyroptosis. Cell Physiol Biochem. 2016;40(6):1692–1705.
- 10. Yang D, He Y, Muñoz‐Planillo R, Liu Q, Núñez G. Caspase‐11 requires the Pannexin‐1 channel and the purinergic P2X7 pore to mediate pyroptosis and endotoxic shock. Immunity. 2015;43(5):923–932.
- 11. Chen Q, Zhang X, Yang H, et al. CD8 + CD103 + iTregs protect against ischemia–reperfusion‐induced acute kidney injury by inhibiting pyroptosis. Apoptosis. 2024;29(9‐10):1709–1722.
- 12. Huang W, Zhang H, Wang L, et al. Ulinastatin attenuates renal ischemia–reperfusion injury by inhibiting NLRP3 inflammasome‐triggered pyroptosis. Int Immunopharmacol. 2024;143(Pt 1):113306.
- 13. Wang L, Shao Z, Wang N, et al. Receptor‐interacting protein kinase 1 confers autophagic promotion of gasdermin E‐mediated pyroptosis in aristolochic acid‐induced acute kidney injury. Ecotoxicol Environ Saf. 2024;284:116944.
- 14. Griffin NM, Yu J, Long F, et al. Label‐free, normalized quantification of complex mass spectrometry data for proteomic analysis. Nat Biotechnol. 2010;28(1):83–89.
- 15. Chen Q, Xu J, Liu L, et al. Proteomic analysis of idiopathic nephrotic syndrome triggered by primary podocytopathies in adults: regulatory mechanisms and diagnostic implications. J Proteome Res. 2024;23(6):2090–2099.
- 16. Funwei RI, Thomas BN, Falade CO, Ojurongbe O. Extensive diversity in the allelic frequency of Plasmodium falciparum merozoite surface proteins and glutamate‐rich protein in rural and urban settings of southwestern Nigeria. Malar J. 2018;17(1):1.
- 17. Heidari SS, Nafar M, Kalantari S, et al. Urinary epidermal growth factor is a novel biomarker for early diagnosis of antibody mediated kidney allograft rejection: a urinary proteomics analysis. J Proteomics. 2021;240:104208.
- 18. Miao EA, Rajan JV, Aderem A. Caspase‐1‐induced pyroptotic cell death. Immunol Rev. 2011;243(1):206–214.
- 19. Man SM, Karki R, Kanneganti TD. Molecular mechanisms and functions of pyroptosis, inflammatory caspases and inflammasomes in infectious diseases. Immunol Rev. 2017;277(1):61–75.
- 20. Akaike T, Ida T, Wei FY, et al. Cysteinyl‐tRNA synthetase governs cysteine polysulfidation and mitochondrial bioenergetics. Nat Commun. 2017;8(1):1177.
- 21. Newberry KJ. Structural origins of amino acid selection without editing by cysteinyl‐tRNA synthetase. EMBO J. 2002;21(11):2778–2787.
- 22. Hayano M, Yang WS, Corn CK, Pagano NC, Stockwell BR. Loss of cysteinyl‐tRNA synthetase (CARS) induces the transsulfuration pathway and inhibits ferroptosis induced by cystine deprivation. Cell Death Differ. 2016;23(2):270–278.
- 23. Moen SO, Edwards TE, Dranow DM, et al. Ligand co‐crystallization of aminoacyl‐tRNA synthetases from infectious disease organisms. Sci Rep. 2017;7(1):223.
- 24. Kim T, Son WS, Morshed MN, et al. Discovery of thienopyrrolotriazine derivatives to protect mitochondrial function against Aβ‐induced neurotoxicity. Eur J Med Chem. 2017;141:240–256.
- 25. Jung M, Kasamatsu S, Matsunaga T, et al. Protein polysulfidation‐dependent persulfide dioxygenase activity of ethylmalonic encephalopathy protein 1. Biochem Biophys Res Commun. 2016;480(2):180–186.
- 26. Cao Z, Wang H, Mao X, Luo L. Noncanonical function of threonyl‐tRNA synthetase regulates vascular development in zebrafish. Biochem Biophys Res Commun. 2016;473(1):67–72.
- 27. Fliss H, Gattinger D. Apoptosis in ischemic and reperfused rat myocardium. Circ Res. 1996;79(5):949–956.
- 28. Weigt SS, Palchevskiy V, Belperio JA. Inflammasomes and IL‐1 biology in the pathogenesis of allograft dysfunction. J Clin Invest. 2017;127(6):2022–2029.
- 29. Schulze WX, Usadel B. Quantitation in mass‐spectrometry‐based proteomics. Annu Rev Plant Biol. 2010;61:491–516.