The world has experienced a series of crises that have had a severe impact on individuals living with and affected by HIV in the past 2 years, particularly during the coronavirus disease 2019 (COVID-19) era []. These crises have not only hindered the global response to the AIDS pandemic but also exacerbated existing socioeconomic inequalities within and between countries, particularly in Sub-Saharan Africa []. The COVID-19 pandemic has caused significant disruptions to essential HIV treatment and prevention services, derailing the progress made in HIV response [, ].
It is our collective responsibility to put an end to the AIDS epidemic, honoring the memory of the 39 million individuals who have lost their lives to this disease [, ]. The Joint United Nations Program on HIV/AIDS (UNAIDS) set a global target in December 2020, the 95-95-95 goal, aiming to achieve the following by 2025: 95% of all people with HIV will be aware of their HIV status, 95% will receive consistent antiretroviral therapy, and 95% of those on treatment will achieve viral suppression []. However, the current reality is that only three-quarters of people with HIV have access to antiretroviral treatment, and 52% of children with HIV have access to life-saving medication []. Shockingly, ∼10 million adult individuals still lack access to treatment, and the gap in HIV treatment coverage between children and adults is widening instead of narrowing [, ].
Ethiopia has embraced the UNAIDS target as a crucial component of its efforts to eliminate HIV/AIDS epidemics by 2030. The country has been collaborating with numerous partners and stakeholders to enhance disease detection, viral load testing, and adherence to antiretroviral therapy []. Consequently, the national prevalence of HIV infection among individuals aged 15–49 has decreased to 0.9%, although variations persist based on gender, location, and specific population groups, with higher rates among women and in urban areas [].
Achieving viral load suppression (VLS) is crucial for the effective treatment and prevention of complications and deaths related to HIV infection [, ]. The World Health Organization (WHO) recommends regular viral load testing as the preferred method for monitoring and confirming treatment failure []. Virological suppression is defined as when the viral load count drops below 1000 copies/mL of blood or becomes undetectable after a sufficient duration of antiretroviral therapy (ART), possibly within 6 months of initiation [].
A longitudinal analysis conducted across multiple countries in Sub-Saharan Africa revealed that the rates of virological suppression range from 90% to 93% []. In Rwanda, the rate is 83% [], while in Cameroon it is 79.4% []; in Nigeria, it is 80.2% [], and in Tanzania, it is 94% []. In Ethiopia, the virological suppression rates vary, with Hawassa reporting 40.9% [], West Gojjam reporting 51.73% [], North Shewa zone reporting 72% [], and Debre Markos reporting 92% []. These variations in the reports highlight the need for nationally representative data on virological suppression in Ethiopia. It is critical to continue concerted efforts to address the uneven distribution of HIV infection and work toward achieving global targets uniformly within the remaining time frame [].
In order to facilitate the establishment of a bold future goal, it is essential to analyze the pooled prevalence of virological suppression and the factors that contribute to it within the Ethiopian context. Therefore, the objectives of this review are to determine the overall national rate of virological suppression and analyze the contextual predictors of virological suppression using internationally recognized frameworks of key performance indicators. The findings of this study will provide valuable insights for health care providers and assist the country in sustaining the achievements of virological suppression while addressing areas of improvement to achieve the goal of ending AIDS by 2030.
METHODS
Reporting
We strictly followed the Preferred Reporting Items for Systematic Reviews and Meta-analyses (PRISMA) guidelines [] with a supplementary file research checklist (Supplementary Table 1). The review began on May 14, 2023, and was completed on July 11, 2023, including the date for formulation of the research question and the preliminary search. We wrote a detailed protocol of the systematic review and meta-analysis before the review started and registered it with the Prospero database (registration number CRD42023434248; https://www.crd.york.ac.uk/prospero/#recordDetails).
Inclusion and Exclusion Criteria
The articles selected for this systematic review and meta-analysis consisted of cohort, case[FIGURE DASH]control, and cross-sectional studies. Those studies reported the proportion of viral suppression at various time intervals and included adjusted effect measures of factors associated with virological suppression. Additionally, the studies had to be conducted in Ethiopia using national HIV program data. Studies that lacked full-text access and requiring subscription, qualitative studies, and conference proceedings without full-text reports were excluded from the analysis.
Search Strategy
Website searches (Google, Google Scholar, and registries) and database searches (PubMed, Science Direct, and Hinari [research4life]) were conducted to find research articles. The search strategy used in PubMed was [((virological) OR (viral)) AND ((suppression) OR (re-suppression)) AND ((predictors) OR (factors) OR (determinants)) AND ((HIV) OR (AIDS)) AND ((“antiretroviral therapy”) OR (ART) OR (HAART)) AND (Ethiopia)]; similar search terms were used for Hinari. In addition, Ethiopian university online repositories (University of Gondar, Addis Ababa University, Hawassa University, and Bahirdar University) were searched. Endnote 20 reference manager software was used to manage duplicated references and for citations in the manuscript. All accessed databases were searched from June 18 to 23, 2023.
Outcome Measurement/Ascertainment
Virological suppression was considered when viral load copies become <1000 copies/mL of blood after initiation of ART [].
Data Extraction Process
Data from each study were independently extracted by 2 reviewers (A.M. and H.Y.) and cross-checked by both reviewers. Any discrepancies were resolved through revision. The extracted data included the first author and year of publication, sample size, number of individuals with the outcome of interest, study design, study population with sample size, geographical location, funding information, and response rate. The data were extracted from June 25 to July 2, 2023.
Quality Assessment
Two authors (A.M., Y.T.) independently evaluated the quality of the articles using the Newcastle[FIGURE DASH]Ottawa Scale, which is a tool for assessing the quality of cross-sectional, case[FIGURE DASH]control, and cohort studies [].
The criteria for cross-sectional studies consisted of 3 sections. The first section focused on selection (rated on a scale of up to 5 stars), which considers the representativeness of the average general population, justifiable sample size, satisfactory response rate, and the use of a validated measurement tool for ascertainment of the exposure (risk factors). The second section assessed the comparability of the study (rated on a scale of up to 2 stars), which considers whether subjects in different outcome groups are comparable based on the study design or analysis and whether confounding factors are controlled for. The third section assessed the outcome (rated on a scale of up to 3 stars), which includes assessment of outcome (independent blind assessment, record linkage, self-report, and no description) and the statistical test used to describe the data (whether it is clearly described and appropriate and the measurement of the association is presented, including confidence intervals and probability level [P value]).
For case–control studies, the criteria included selection, which was evaluated with a maximum of 4 stars by considering the adequacy of the case definition and representativeness of the cases; selection of controls and definition of controls’ comparability, assessed with a maximum of 2 stars by comparability of cases and controls on the basis of the design or analysis; and exposure, graded with a maximum of 4 stars by considering the method of ascertainment of exposure and use of the same method of ascertainment for cases and controls.
Cohort studies had criteria that included selection, graded with up to 6 stars by considering the representativeness of the exposed cohort, selection of the nonexposed cohort, ascertainment of exposure, and demonstration that the outcome of interest was not present at the start of the study; comparability, graded with up to 2 stars by considering the comparability of the cohorts on the basis of the design or analysis; outcome, graded with up to 5 stars by considering the methods of assessment of outcome, whether follow-up was long enough for outcomes to occur, and adequacy of follow-up of cohorts.
Cross-sectional studies that scored ≥6, case–control studies that scored ≥7, and cohort studies scored that ≥9 on the quality assessment criteria were included in the review (Supplementary Table 2). In cases where there was disagreement between the 2 assessors, the process was repeated and resolved with the involvement of a third reviewer (M.M.).
Statistical Analysis and Data Synthesis
Publication bias was assessed using funnel plots, or Egger's test for a more objective evaluation. The heterogeneity of the studies was assessed using I2 and Q statistics, and a sensitivity analysis was performed to identify any outlier results in the included studies. The Der Simonian Laird random-effects model was used to estimate the overall proportion of viral suppression. A subgroup analysis was conducted based on the geographical location of the study, type of antiretroviral therapy regimen, sample size, study population by age, and study design to examine variations in outcomes. STATA 17 statistical software was used for analysis. A cumulative meta-analysis was conducted to indicate temporal variation of the virological suppression rate by including studies sequentially from their year of publication.
RESULTS
A comprehensive search of databases and websites, including Google Scholar (n = 846), PubMed (n = 111), science direct (n = 25), Hinari research4life (n = 96), Ethiopian university online repositories (Hawassa University n = 1, Bahirdar University n = 1, and Addis Ababa University n = 1), and other sources (n = 1), yielded a total of 1081 articles. After removing 104 duplicate articles, 977 articles remained. Among these, 848 articles were excluded based on a lack of matching titles and abstracts. Additionally, 108 articles were excluded after a full-text review due to differences in outcome variable measurement (n = 10), duplication (n = 4), and being conducted outside Ethiopia (n = 94). Finally, a total of 21 articles were included for quantitative review (Figure 1).
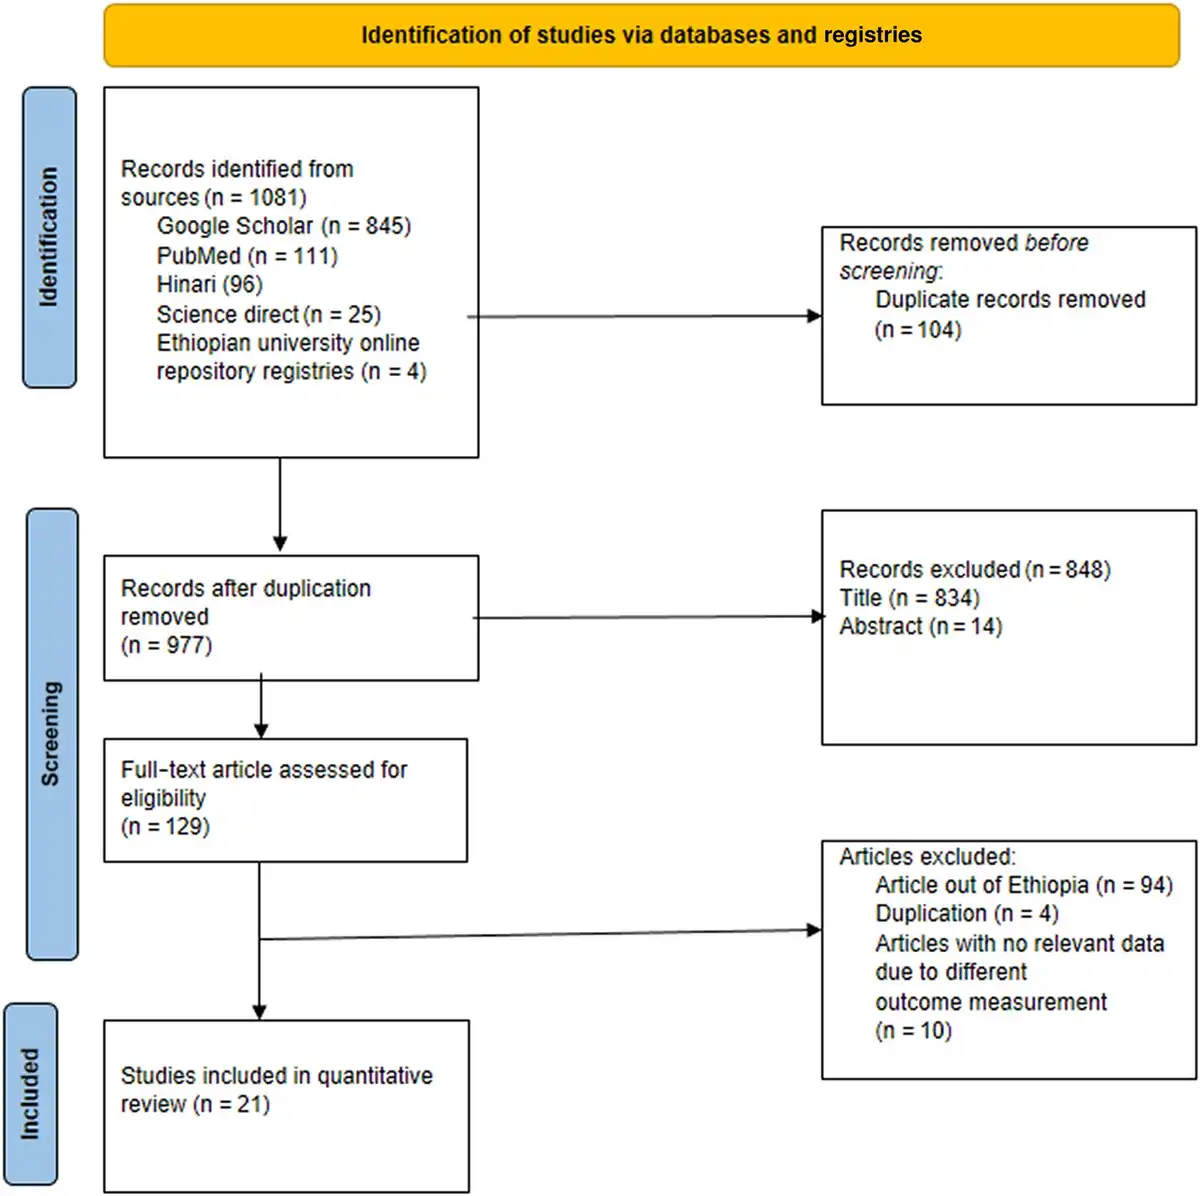
Figure 1
PRISMA flow-chart diagram describing the screening and selection of studies for systematic review and meta-analysis in Ethiopia.
Characteristics of the Included Articles in Ethiopia
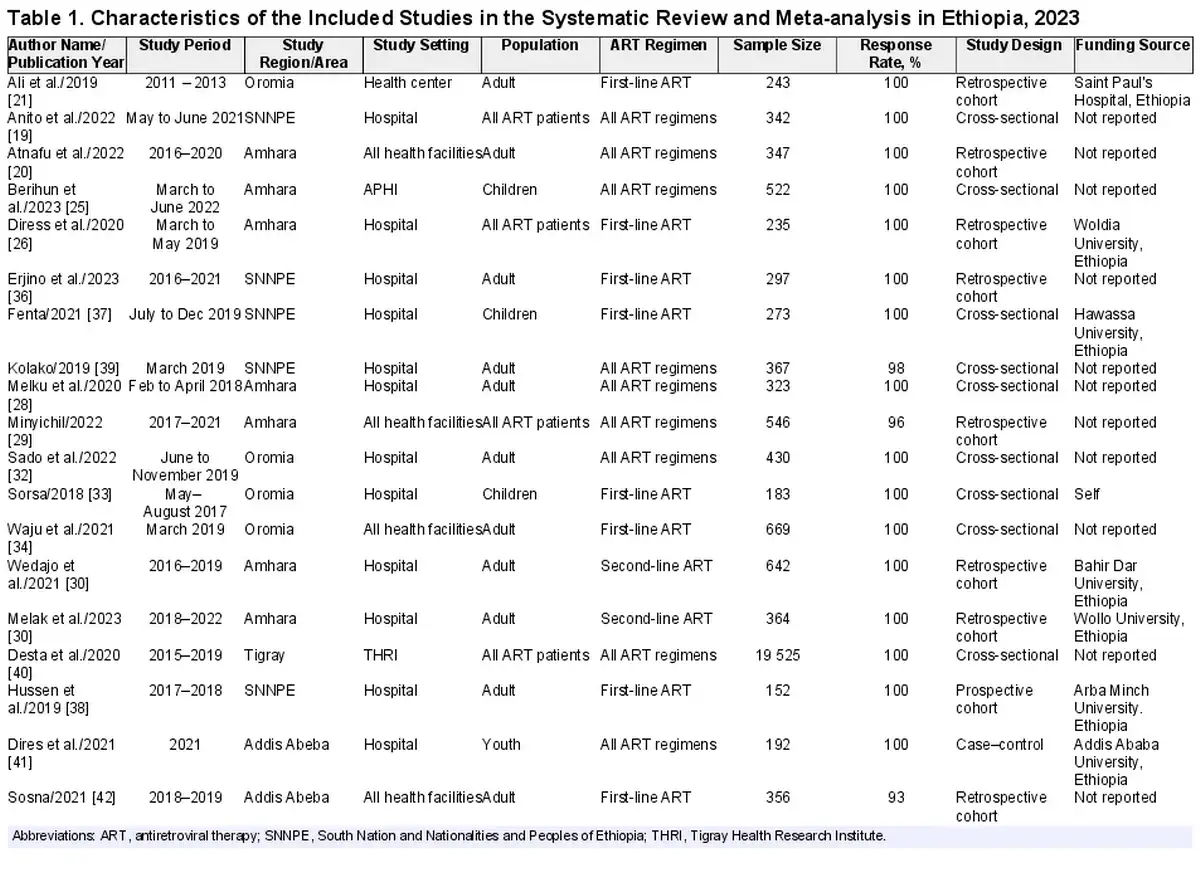
The studies found through database searching and included for the current review were performed between 2016 and 2022 and published between 2018 and 2023. Regarding the study area/region, 7 articles were conducted in the Amhara region [, ], 6 studies in the Oromia region [, ], 5 articles in the South Nation and Nationalities and Peoples of Ethiopia (SNNPE) region [, ], 1 study in the Tigray region [], and 2 studies in the Addis Abeba city administration [, ].
Ten articles were conducted using a cross-sectional study design [, , , , , , ], 2 studies were conducted using a case–control study design [, ], 8 studies were conducted using a retrospective cohort study [, , , , , , , ], and 1 study was conducted using a prospective cohort study []. Nine studies were conducted on first-line ART patients [, , , , , , , , ], 9 studies were conducted on both first- and second-line ART patients [, , , , , , , , , ], and 2 were conducted on second-line ART patients [, ]. The minimum sample size was 152 in the study in Arba Minch [], and the maximum sample size was 19 525 in the study in the Tigray region (Table 1) [].
Publication Bias
Figure 2 shows a funnel plot for HIV viral load suppression, which indicates symmetries. Egger's test showed no small-study effects, with a P value of .747.
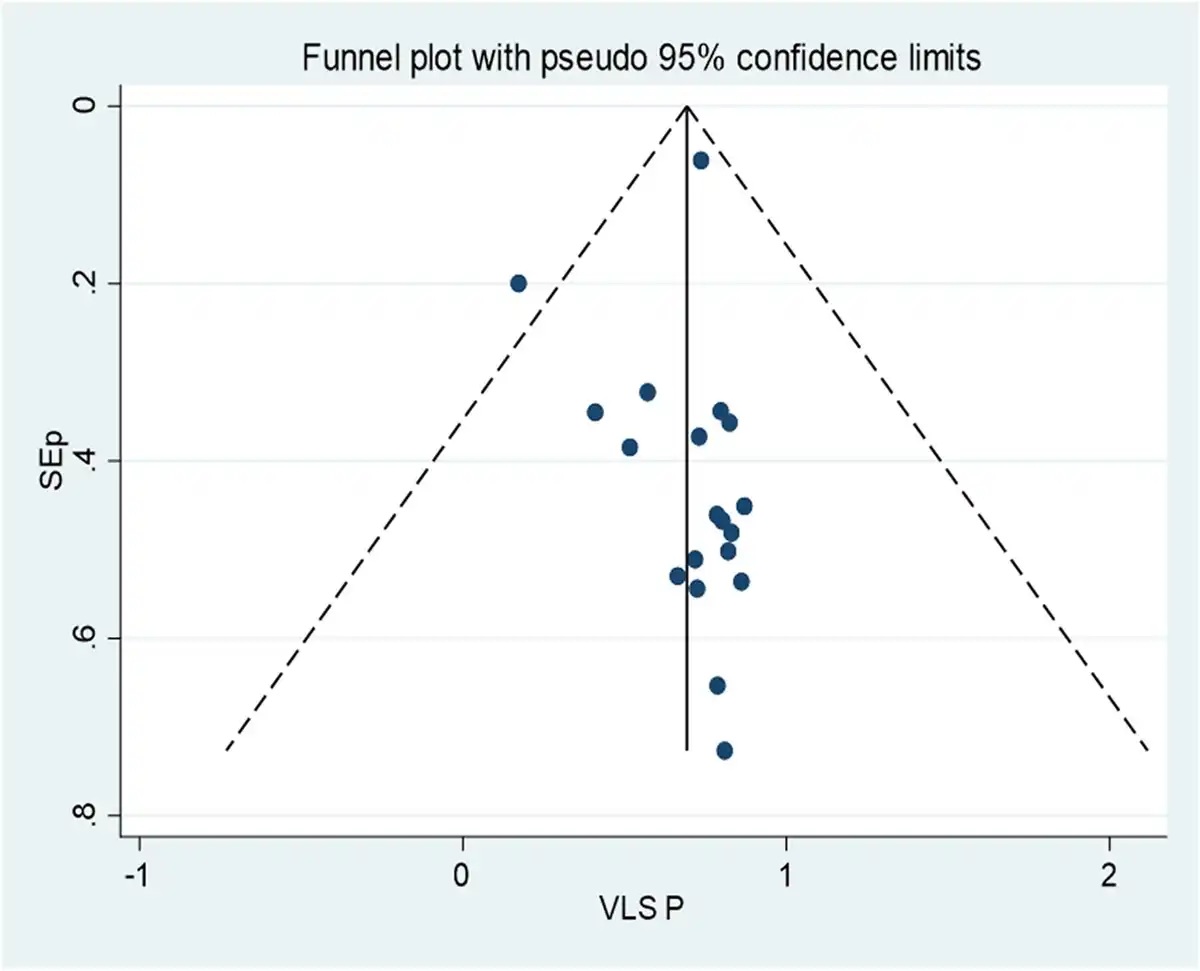
Figure 2
Funnel plot, in which the vertical line indicates the effect size, whereas the diagonal line indicates the precision of individual studies with a 95% confidence limit. VLS P, viral load suppression proportion.
Meta-analysis of the Proportion With Virological Suppression in Ethiopia
Virological suppression rate (suppressed: <1000 copies/mL of blood; or unsuppressed: ≥1000 copies/mL of blood) was determined according to the Ethiopian context. To determine the pooled proportion of viral suppression, 19 studies were included, with a total sample size of 26 240 participants. By definition, the pooled prevalence of virological suppression in the Ethiopian context was 71% (95% CI, 64%–77%; I2 = 98.77; Q statistics P ≤ .01) (Figure 3).
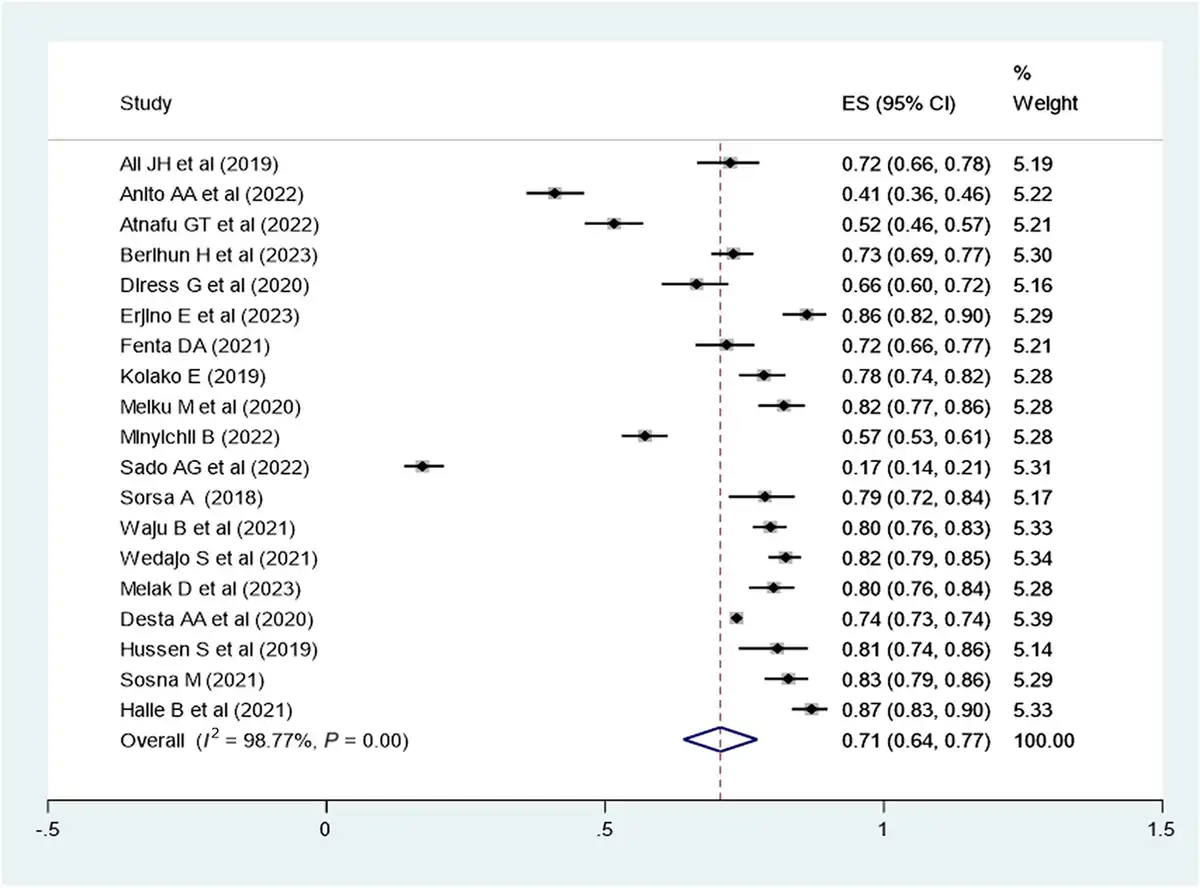
Figure 3
Forest plot of the proportion of virological suppression in Ethiopia and its 95% CI. The midpoint of each line illustrates the estimated proportion of VL in each study. The diamond shows the pooled proportion.
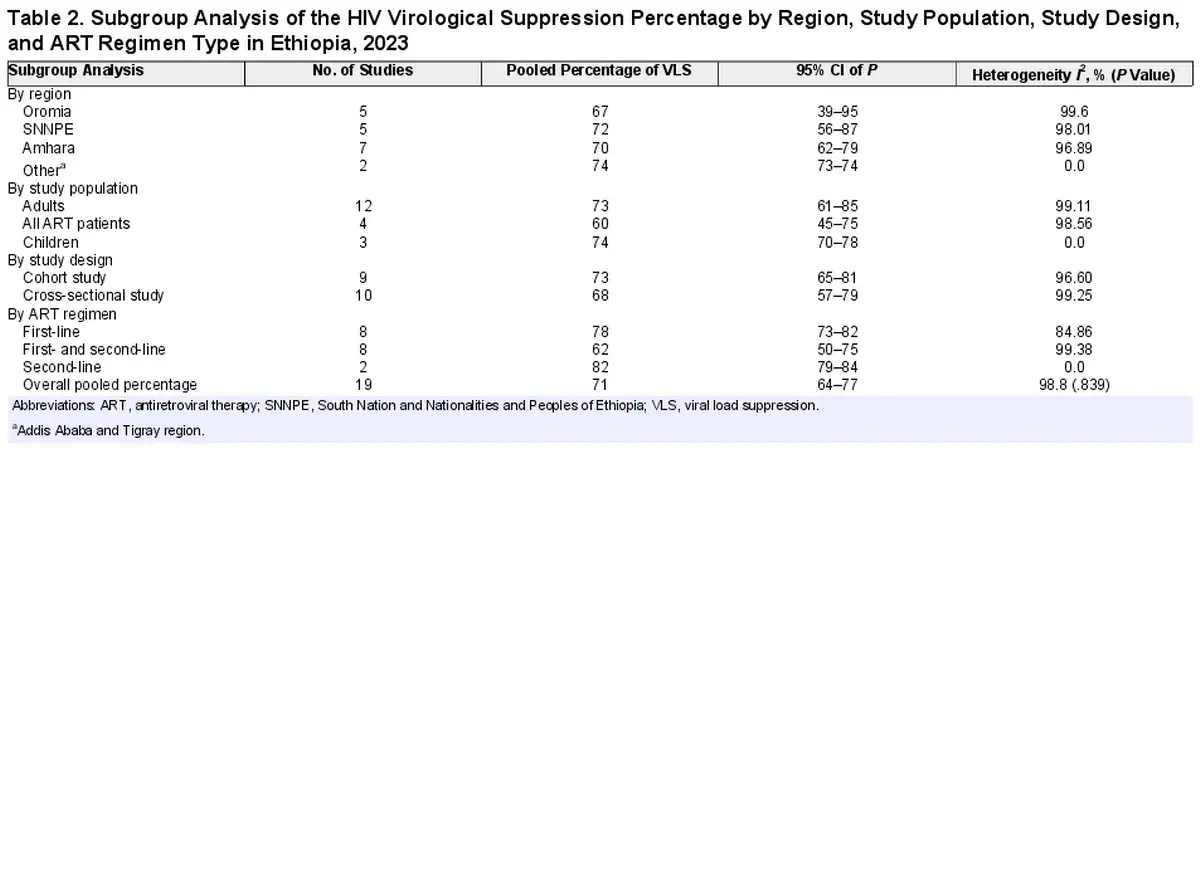
Subgroup Analysis of Virological Suppression in Ethiopia
A subgroup analysis was employed by region (Figure 4), study population, study design, and ART regimen. The virological suppression rate was 62% in the Oromia region, 72% in the SNNPE region, 70% in the Amhara region, and 74% in other regions (Tigray and Adis Ababa). The pooled virological suppression rate among adults was found to 73% (95% CI, 61%–85%), whereas in children it was 74% (95% CI, 70%–78%). The pooled virological suppression rate for patients on first-line ART was 78% (95% CI, 73%–82%), whereas for those on second-line ART it was 82% (95% CI, 79%–84%) (Table 2).
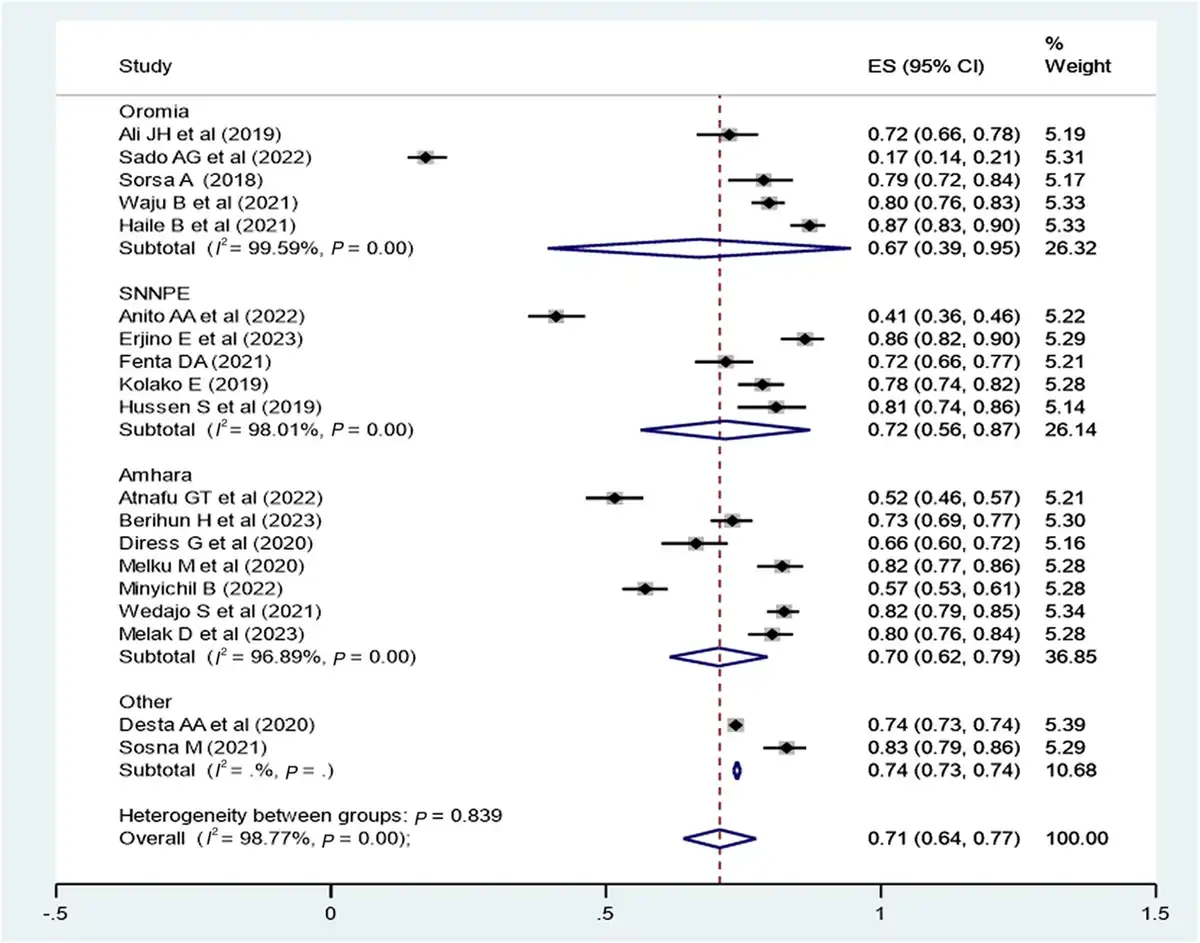
Figure 4
Subgroup analysis by region of Ethiopia to determine the pooled proportion of virological suppression in each region. The midpoint of each line illustrates the estimated proportion of VL in each study. The diamond shows the pooled proportion.
Cumulative Proportion of Virological Suppression Rate Over the Publication Years (2018–2023) in Ethiopia
The cumulative proportion of virological suppression in Ethiopia was higher from 2018 to 2020 but constantly decreased from 2020 to 2023 (Figure 5).
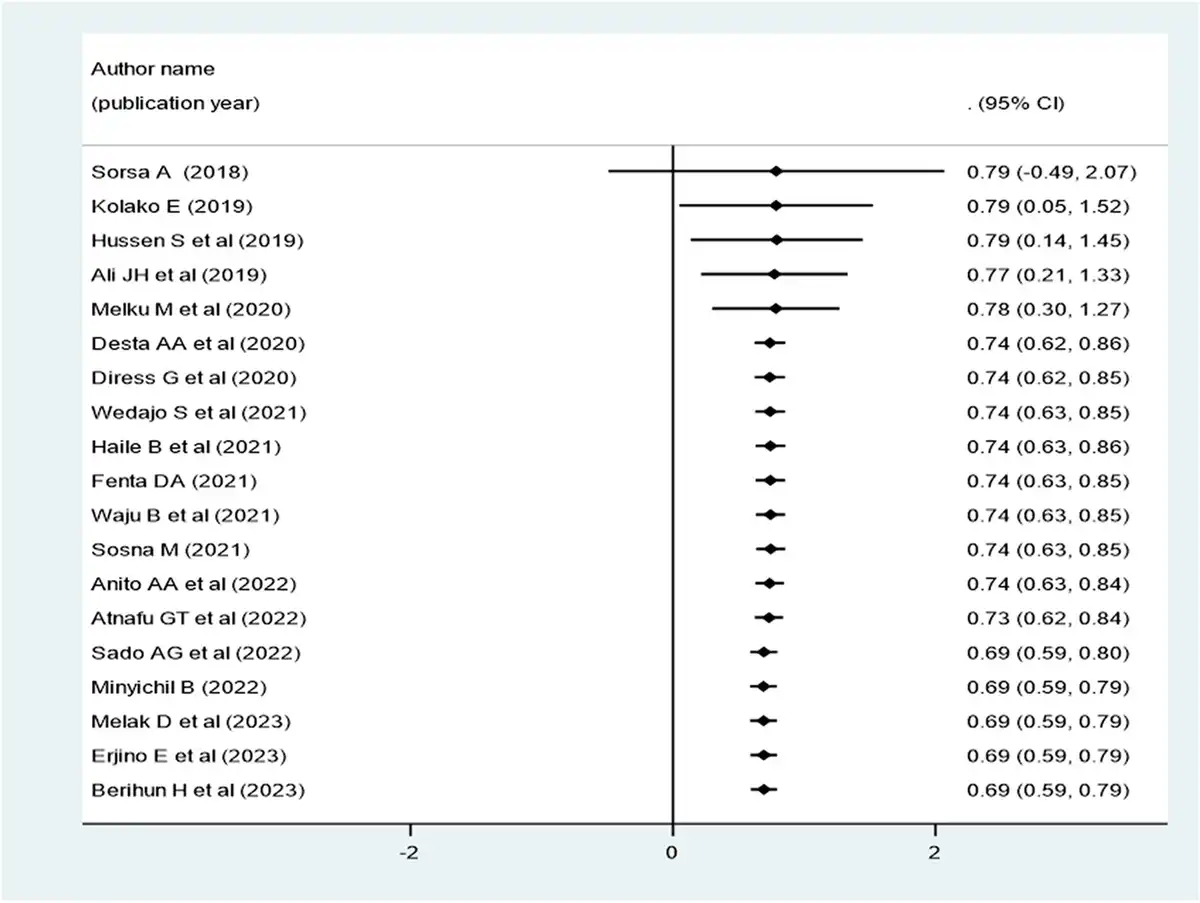
Figure 5
Forest plot for the cumulative proportion of virological suppression over the publication year of individual articles conducted in Ethiopia (2018–2023).
Systematic Review of Factors Associated With Virological Suppression in Ethiopia
Different factors, such as sociodemographic, clinical, and treatment-related factors, contribute to virological suppression.
Sociodemographic Factors Associated With Virological Suppression
Based on the primary study report, being female was positively associated with virological suppression (adjusted hazard ratio [AHR], 1.50; 95% CI, 1.05–2.15 []; adjusted relative risk [ARR], 1.18; 95% CI, 1.017–1.192 []; adjusted odds ratio [AOR], 1.9; 95% CI, 1.04–3.48 []). Another study revealed a similar finding, in which being male had a positive association with viral suppression status (AOR, 1.27; 95% CI, 1.18–1.37) []. Different age categories also showed an association with viral suppression: ages 15–19 years (AOR, 4.86; 95% CI, 3.86–6.12), 20–24 years (AOR, 1.96; 95% CI, 1.57–2.45), 25–29 years (AOR, 1.79; 95% CI, 1.55–2.08), 30–34 years (AOR, 1.46; 95% CI, 1.29–1.65), 35–39 years (AOR, 1.43; 95% CI, 1.27–1.61), 40–44 years (AOR, 1.22; 95% CI, 1.08–1.39), 45–49 years (AOR, 1.22; 95% CI, 1.06–1.40) were positively associated with viral suppression status compared with older age groups 50+ years []. In the primary study, having formal education in primary school (ARR, 1.38; 95% CI, 1.032–1.841) and secondary and above (ARR, 1.65; 95% CI, 1.253–2.164) were positively associated with viral suppression [].
Clinical Factors Associated With Virological Suppression
In the primary study, malnourished patients were less likely to achieve viral suppression (AOR, 0.565; 95% CI, 0.329–0.971) [], and patients with a BMI between 18.5 and 24.9 kg/m2 were more likely to have virological resuppression (AHR, 1.42; 95% CI, 1.03–1.95) []. Poor adherence (AOR, 0.504; 95% CI, 0.287–0.886) [] and another study [] showed that poor adherence was more likely to lead to suppression (AOR, 2.56; 95% CI, 1.97–3.33). CD4 count <200 cells/mm3 (AOR, 0.149; 95% CI, 0.071–0.314) [] and CD4 count >350 cells/mm3 (AHR, 1.98; 95% CI, 1.12–3.51) [] showed a positive association with viral suppression. The presence of opportunistic infection (AHR, 1.85; 95% CI, 1.06–3.24) showed a positive association with virological suppression status [].
Treatment-Related Predictors of Virological Suppression
NVP-based (AOR, 0.125; 95% CI, 0.034–0.464) and EFV-based (AOR, 0.223; 95% CI, 0.063–0.0795) ART regimens were less likely to suppress viral load than PI-based regimens []. Another study showed that patients on second-line regimens were more likely to have virological suppression than those on first-line regimens (AOR, 8.98; 95% CI, 2.64–30.58) []. Patients who used cotrimexazole preventive therapy (CPT; AHR, 1.997; 95% CI, 1.108–3.600 []; AOR, 2.6; 95% CI, 1.23–5.48 []) and isoniazid preventive therapy (IPT; AHR, 3.09; 95% CI, 1.72–5.53 []) were more likely to achieve virological suppression compared with nonusers.
Meta-analysis of Factors Associated With Virological Suppression in Ethiopia
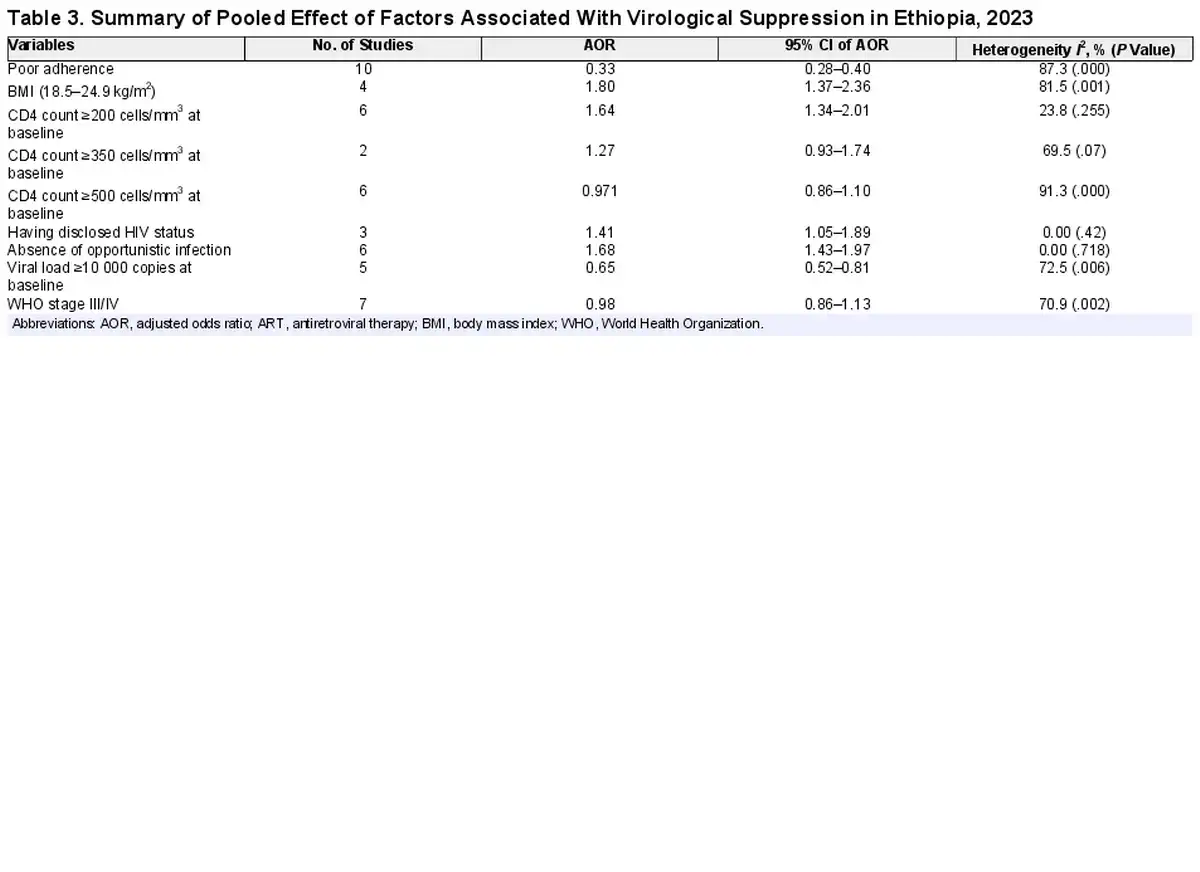
The pooled effect of patient adherence to ART showed that patients with poor adherence were 0.33 times less likely to achieve virological suppression (AOR, 0.33; 95% CI, 0.28–0.40) (Figure 6). The pooled effect of BMI (18.5–24.9 kg/m2) showed a positive association with virological suppression (AOR, 1.8; 95% CI, 1.37–2.36) (Figure 7). The pooled effect of CD4 count ≥200 cells/mm3 indicated a 1.64 times higher rate of virological suppression compared with CD4 <200 cells/mm3 (AOR, 1.64; 95% CI, 1.34–2.01) (Figure 8).
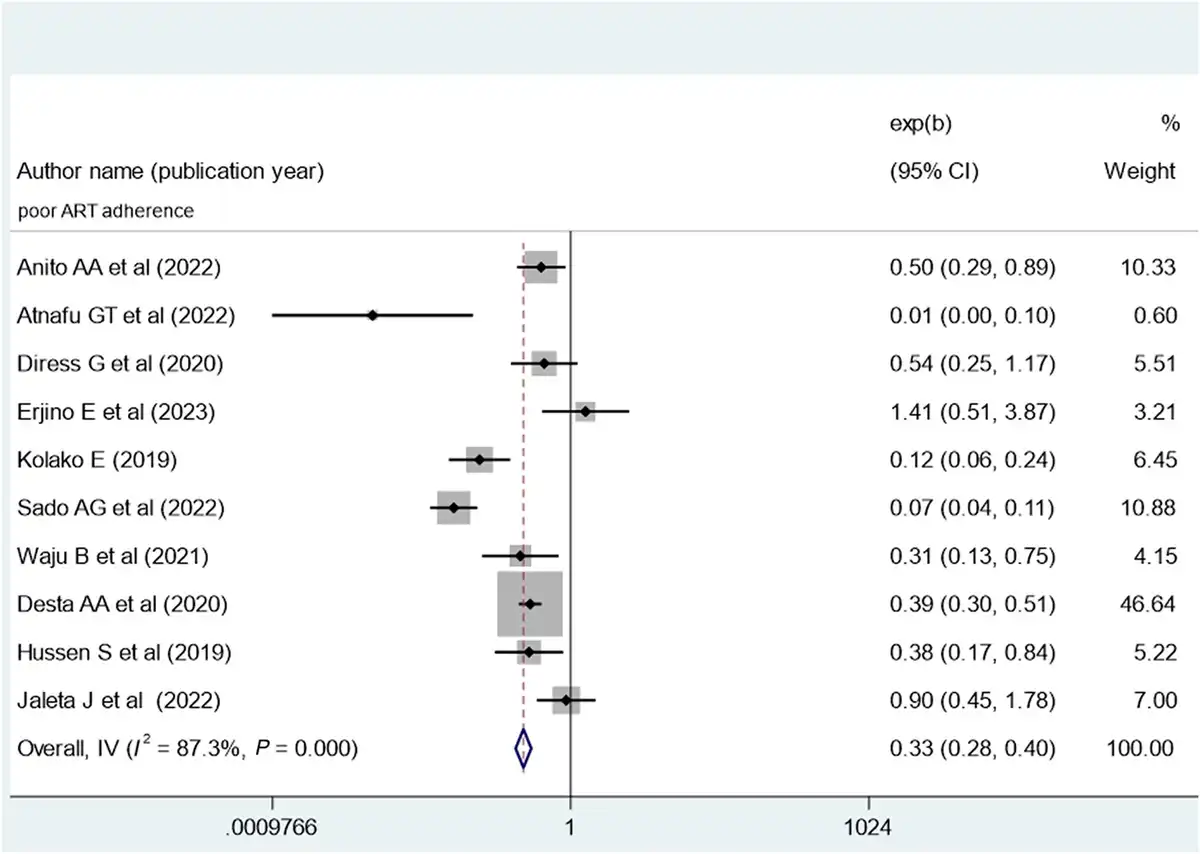
Figure 6
Forest plot of the adjusted odds ratios with corresponding 95% CIs of studies on the association of poor ART adherence and virological suppression in Ethiopia. ART, antiretroviral therapy.
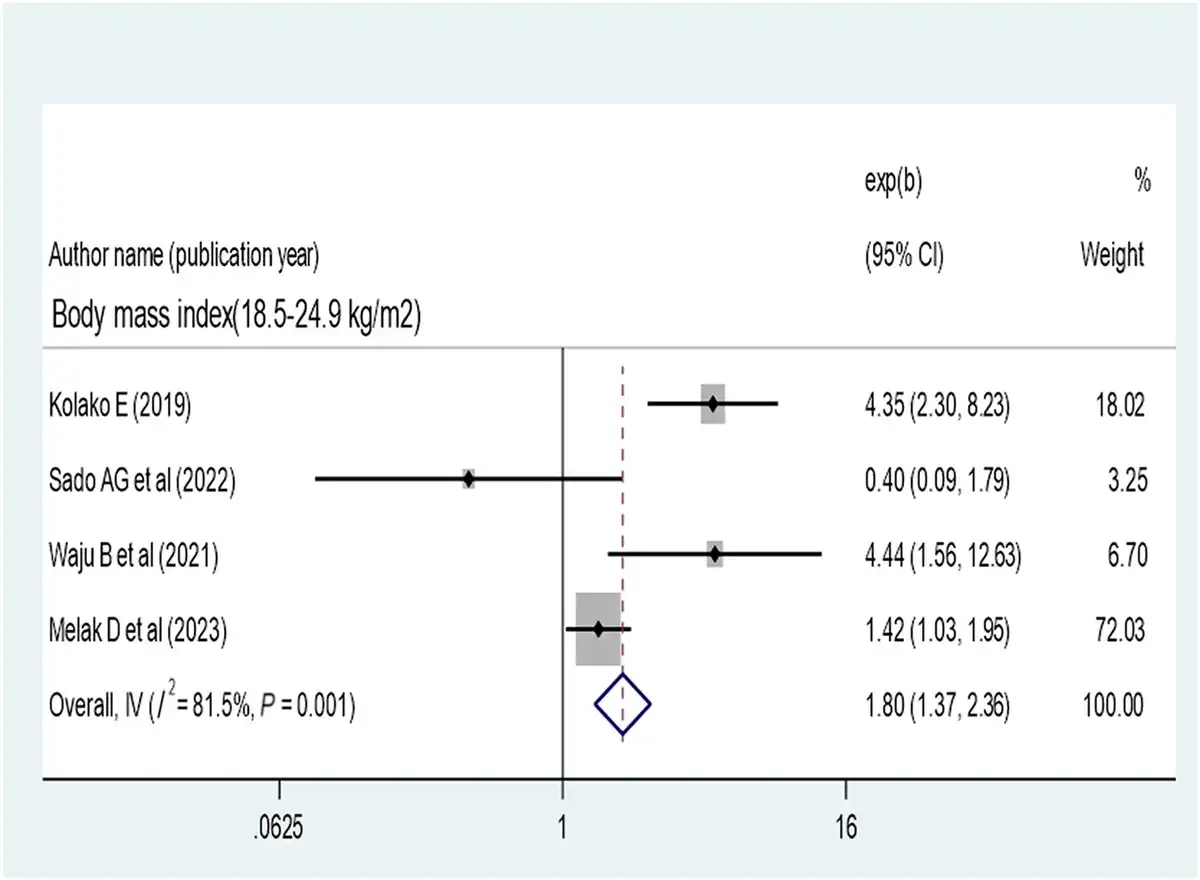
Figure 7
Forest plot of the adjusted odds ratios with corresponding 95% CIs of studies on the association of body mass index and virological suppression.
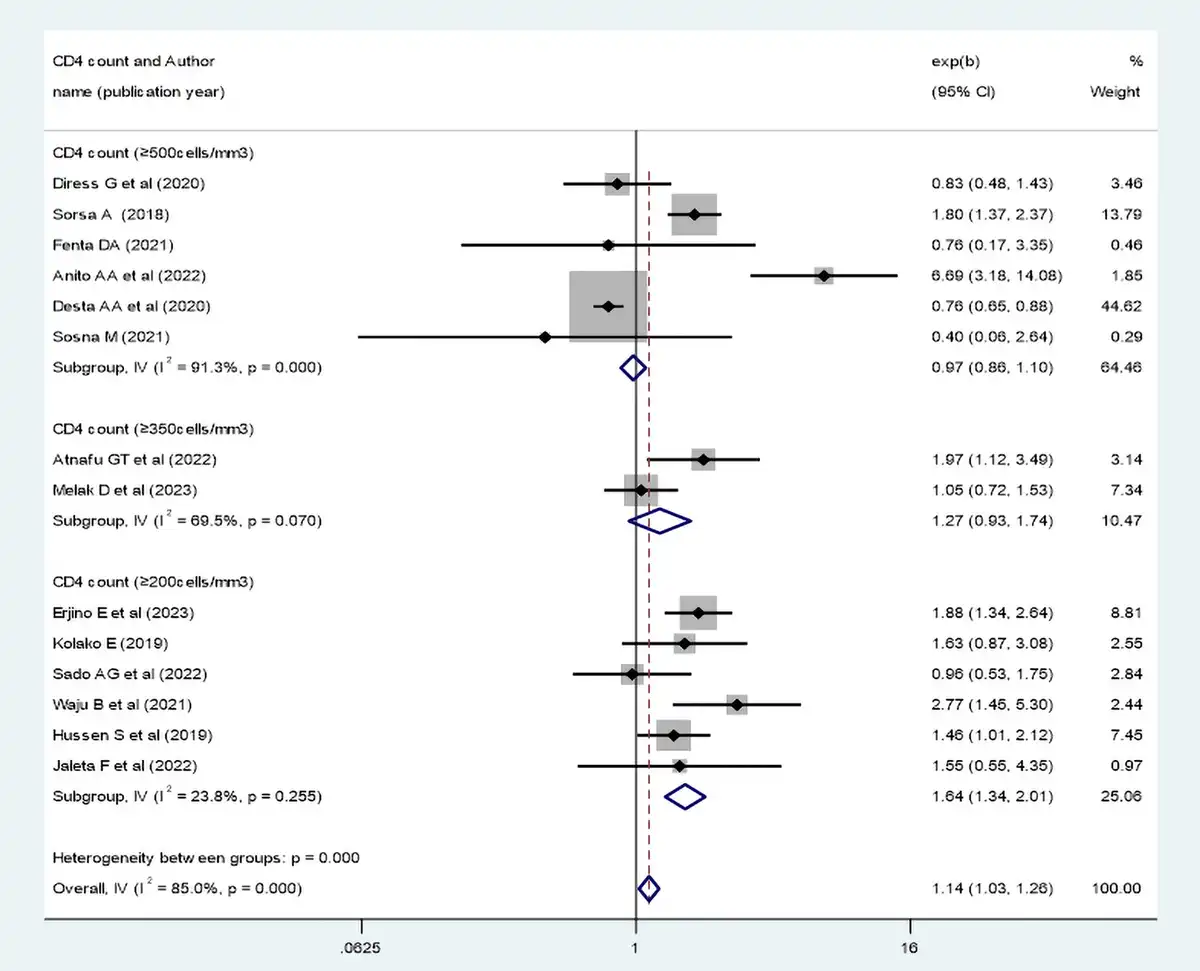
Figure 8
Forest plot of the adjusted odds ratios with corresponding 95% CIs of studies on the association of CD4 count and virological suppression. CD4, cluster of differentiation.
Patients who disclosed their HIV status were 1.41 times more likely to have virological suppression (AOR, 1.41; 95% CI, 1.05–1.89) (Figure 9). Opportunistic infection also determines virological suppression; the absence of opportunistic infection increases virologic suppression by 1.68-fold as compared with patients with opportunistic infection (AOR, 1.68; 95% CI, 1.43–1.97) (Figure 10). Baseline viral load count showed a significant association with viral suppression; viral load count ≥10 000 copies/mL of blood had 35% lower virologic suppression as compared with its counterparts (AOR, 0.65; 95% CI, 0.52–0.81) (Figure 11). In this study, the pooled effect of WHO stage did not show a significant association with virological suppression. A summary of the findings can be found in Table 3.
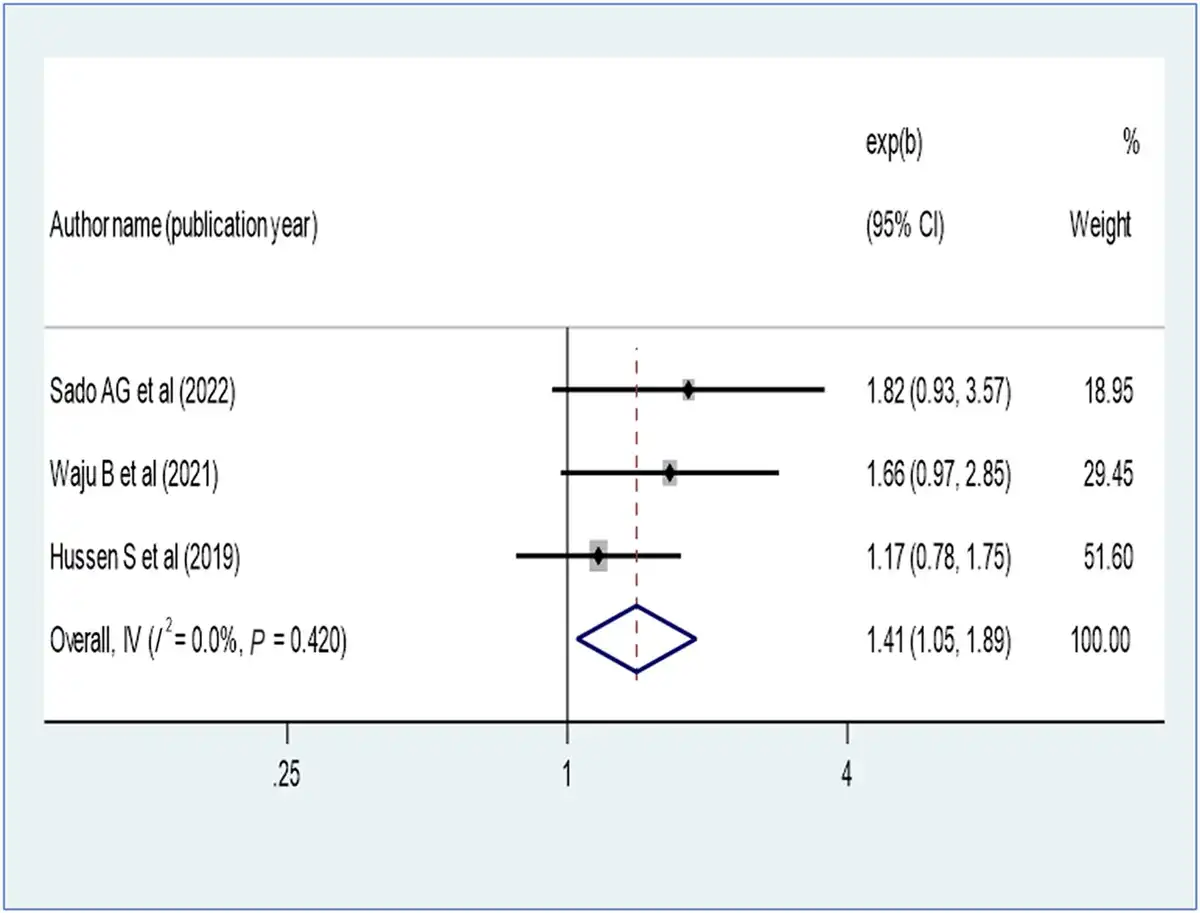
Figure 9
Forest plot of the adjusted odds ratios with corresponding 95% CIs of studies on the association of disclosure of HIV status and virological suppression.
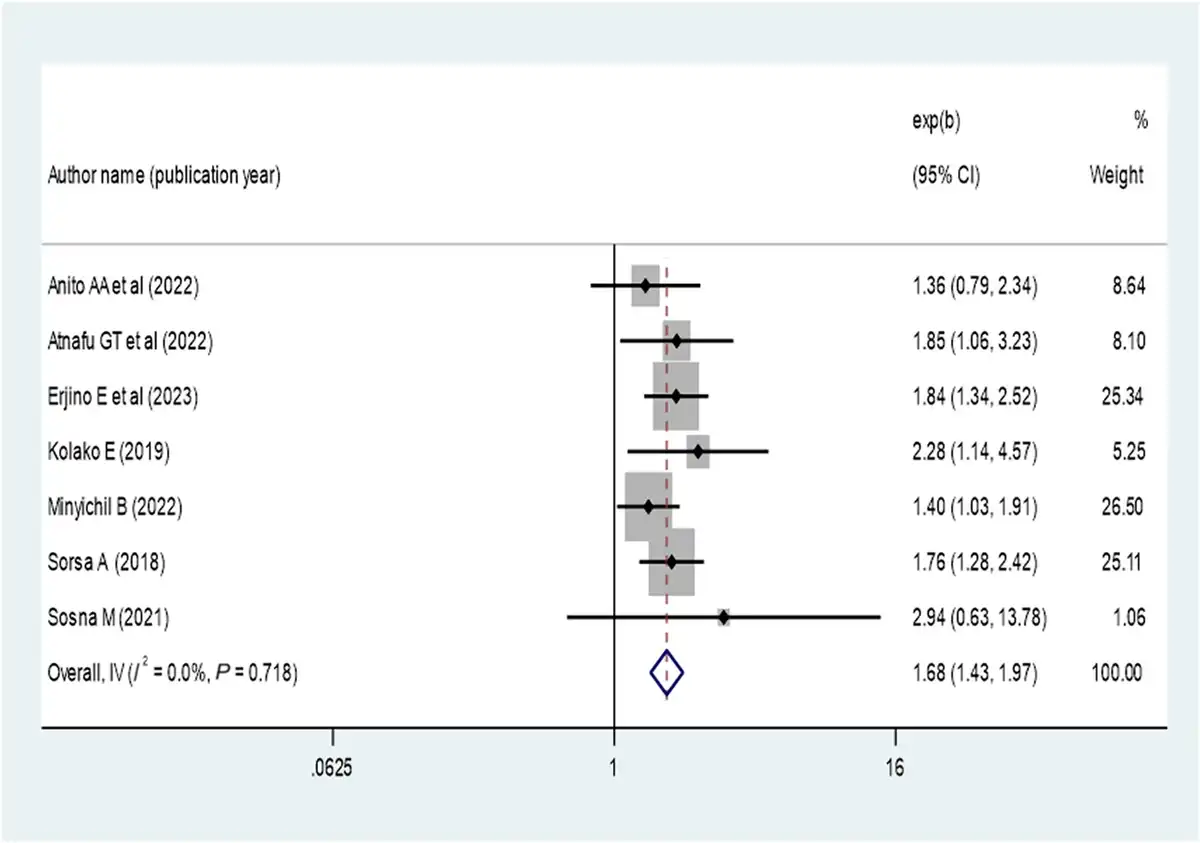
Figure 10
Forest plot of the adjusted odds ratios with corresponding 95% CIs of studies on the association of absence opportunistic infection and virological suppression.
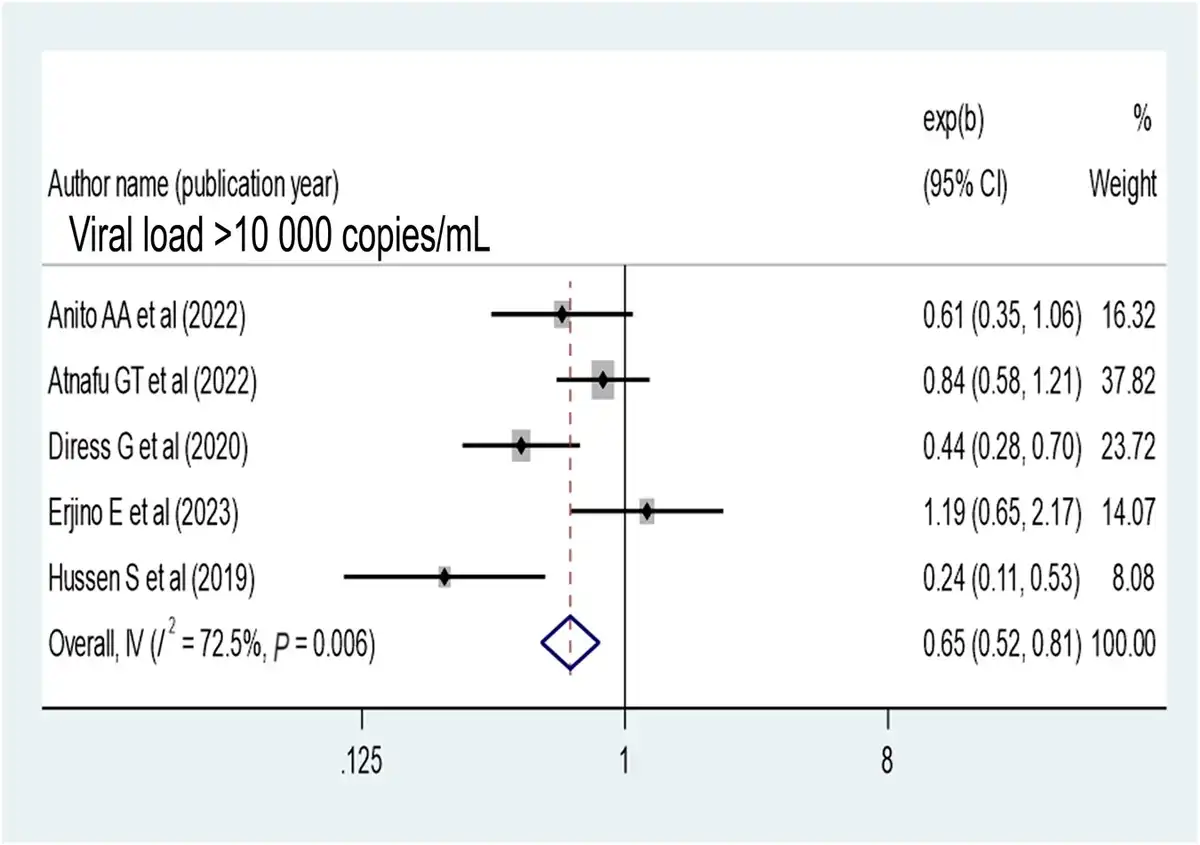
Figure 11
Forest plot of the adjusted odds ratios with corresponding 95% CIs of studies on the association of baseline viral load ≥10 000 copies/mL and virological suppression.
DISCUSSION
The objectives of this systematic review and meta-analysis were to determine the pooled proportion of virological suppression and investigate the pooled impact of factors contributing to virological suppression using primary studies conducted using HIV program data in Ethiopia. Based on our analysis of data from 19 primary studies conducted in Ethiopia, the pooled prevalence of virological suppression was 71% (95% CI, 64%–77%). This estimate is lower compared with the global target for virological suppression in controlled patients [], multicounty longitudinal cohort analysis studies and meta-analyses of virological success rates in Sub-Saharan Africa [, ], a randomized controlled trial in Botswana [], and a recent EPHI report in Ethiopia.
The variation in measurement of viral suppression in different contexts may explain this discrepancy. The low rate of virological suppression in this study could be attributed to an increased rate of treatment failure, as indicated by a recent meta-analysis in Ethiopia [], as well as the impact of the COVID-19 pandemic on HIV care and treatment []. However, the findings of this study align with a nationwide estimate of virological suppression in Cameroon []. It is worth noting that the finding of this review is higher than the results reported in some studies conducted in certain regions of Ethiopia [, ].
The cumulative meta-analysis conducted in this study indicates a decline in the cumulative rate of virological suppression from 2020 to 2023. This decrease could be attributed to various challenges faced in Ethiopia. One of the significant challenges is the COVID-19 pandemic, which has had a profound impact on all aspects of HIV service delivery []. This includes difficulties in scheduling appointments for medication refills, difficulties with clinical and laboratory follow-ups for routine viral load testing, and an increase in the number of individuals lost to ART follow-up [, ]. Additionally, health care facilities have prioritized the response to COVID-19, leading to a disruption in routine HIV services [], and the COVID-19 pandemic has had a detrimental effect on HIV treatment and prevention services globally [, ].
This review suggests that Ethiopia has not yet reached the global target of achieving virological suppression in 95% of patients on ART. In order to enhance the likelihood of achieving positive virological outcomes, it is necessary to address various factors and challenges. This systematic review and meta-analysis found that factors such as patient adherence to ART, body mass index, baseline CD4 count, disclosure, opportunistic infections, and baseline viral load count had a significant pooled impact on virological suppression in Ethiopia. By focusing on these factors, improvements can be made to enhance virological suppression rates in the country.
This review discovered that low patient adherence to ART had a notable negative impact on virological suppression in Ethiopia. This finding aligns with another meta-analysis that demonstrated a correlation between higher adherence rates and increased levels of viral suppression [, ], which suggests that identifying and addressing barriers to adherence are crucial to enhancing virological suppression.
Nutritional status, as indicated by BMI and baseline CD4 count, was identified as another contributing factor to viral suppression in Ethiopia. Patients with a normal BMI (18.5–24.9 kg/m2), according to the WHO classification, were more likely to achieve viral load suppression, which is in line with the findings of primary studies []; this is because BMI has a predictive impact on immune recovery, which is crucial for controlling viral replication. Additionally, the baseline CD4 count of patients was found to determine virological suppression, which is consistent with previous studies [, ]. CD4 count plays a vital role in immune function, protecting the body against opportunistic infections and multiplication of the virus.
Disclosure of HIV status was an important factor contributing to viral suppression in this review, and this finding is supported by other studies [, , ]; this is because disclosure improves adherence to ART []. This implies that encouraging environments supportive of social disclosure can enhance the viral suppression rate.
The presence of opportunistic infections plays a significant role in determining the virological suppression of patients receiving ART. Patients without any opportunistic infections are more likely to achieve virological suppression, which is supported in the literature [, ]. Initiating ART can help prevent many opportunistic infections, but in Ethiopia, the late presentation of patients to care and treatment leads to a high incidence of opportunistic infections and nonsuppression of the virus. This finding suggests that preventing and managing common opportunistic infections can improve viral suppression in Ethiopia. Additionally, a high baseline viral load copy reduces the rate of viral suppression in Ethiopia, which is consistent with the literature [, , ] because a high viral load indicates disease progression and adherence issues, resulting in lower viral suppression. Furthermore, limited appropriate action is taken based on viral load results in various resource-poor settings [].
CONCLUSIONS
In this study, the pooled percentage of virological suppression was very low compared with the global target of viral suppression by 2025 and the recent EPHI report in Ethiopia. Adherence to ART, body mass index, baseline CD4 count, disclosure, opportunistic infections, and baseline viral load count were identified as significant contributing factors to virological suppression. The current study recommends that responsible stakeholders in HIV programs should maximize their effort to achieve the global target of virological suppression by addressing significant predictors. Appropriate action on viral load test results should be taken to track progress toward ending HIV public health threats. Although sufficient primary studies were utilized to determine the pooled virological suppression rate, there was a lack of representation from certain regions of Ethiopia. As a result, it is necessary for researchers to conduct additional studies in these regions that were not included in the systematic review and meta-analysis of the current study, and thorough investigation should be conducted to determine the possible cause of temporal variation in the viral suppression rate.
Acknowledgments
Authors’ information. D.M. (Lecturer): Department of Epidemiology and Biostatistics, School of Public Health, Colleges of Medicine and Health Science, Wollo University, Dessie, Ethiopia ([email protected]); F.D.B. (Lecturer): Department of Epidemiology and Biostatistics, School of Public Health, Colleges of Medicine and Health Science, Wollo University, Dessie, Ethiopia ([email protected]); H.Y. (Lecturer): Department of Epidemiology and Biostatistics, School of Public Health, Colleges of Medicine and Health Science, Wollo University, Dessie, Ethiopia ([email protected]); A.E. (Lecturer): Department of Epidemiology and Biostatistics, School of Public Health, Colleges of Medicine and Health Science, Wollo University, Dessie, Ethiopia ([email protected]); A.M. (Assistant Professor): Department of Epidemiology and Biostatistics, School of Public Health, Colleges of Medicine and Health Science, Wollo University, Dessie, Ethiopia ([email protected]); A.A.Z. (Assistant Professor): Department of Public Health Nutrition, School of Public Health, College of Medicine and Health Sciences, Wollo University, Dessie, Ethiopia ([email protected]); B.W. (Lecturer): Department of Public Health Nutrition, School of Public Health, College of Medicine and Health Sciences, Wollo University, Dessie, Ethiopia ([email protected]); F.Y.A. (Assistant Professor): Department of Public Health Nutrition, School of Public Health, College of Medicine and Health Sciences, Wollo University, Dessie, Ethiopia ([email protected]); A.H.A. (Lecturer): Department of Public Health Nutrition, School of Public Health, College of Medicine and Health Sciences, Wollo University, Dessie, Ethiopia ([email protected]); N.K. (Lecturer): Department of Health Promotion, School of Public Health, College of Medicine and Health Sciences, Wollo University, Dessie City, Ethiopia ([email protected]); A.M.M. (Assistant Professor): Department of Health System Management, School of Public Health, College of Medicine and Health Sciences, Wollo University, Dessie City, Ethiopia ([email protected]); M.M.M. (Lecturer): Department of Health System Management, School of Public Health, College of Medicine and Health Sciences, Wollo University, Dessie City, Ethiopia ([email protected]); Y.T. (Lecturer): Department of Health System Management, School of Public Health, College of Medicine and Health Sciences, Wollo University, Dessie City, Ethiopia ([email protected]); E.A. (Lecturer): Department of Reproductive and Family Health, School of Public Health, College of Medicine and Health Sciences, Wollo University, Dessie City, Ethiopia ([email protected]); N.C. (Assistant Professor): Department of Reproductive and Family Health, School of Public Health, College of Medicine and Health Sciences, Wollo University, Dessie City, Ethiopia ([email protected]); T.B. (Assistant Professor): Department of Reproductive and Family Health, School of Public Health, College of Medicine and Health Sciences, Wollo University, Dessie City, Ethiopia ([email protected]); Z.A. (Lecturer): Department of Reproductive and Family Health, School of Public Health, College of Medicine and Health Sciences, Wollo University, Dessie City, Ethiopia ([email protected])
Author contributions. All authors reviewed and put substantial effort into this study. D.M. and F.D.: conceptualization and design of the study; F.Y., A.H., and Z.A.: searching the databases; M.M., A.M., Y.T.: quality appraisal of the included primary studies; N.C., A.A., and H.Y.: data extraction; D.M., A.E., B.W., A.M.: analysis, interpretation of the data, and writing the first draft of the article; D.M., F.D., Z.A., and E.A.: writing the final draft of the article; N.K., T.B., and D.M.: editing and approval of the final research before submission.
Data availability. The data sets used and analyzed during the current study are available from the corresponding author and can be shared upon justifiable request.
Patient consent. No primary data were used; thus, patient consent was not required.
References
- 1. IN DANGER. According to the Joint United Nations Programme on HIV/AIDS Licence, the UNAIDS Global AIDS Update 2022, Geneva, was published in 2022 under the CC BY-NC-SA 3.0 IGO.UNAIDS. Available at: https://creativecommons.org/licenses/by-nc-sa/3.0/igo/. Accessed 16 June 2023.
- 2. UNAIDS. Indicators and questions for monitoring progress on the 2021 Political Declaration on HIV and AIDS 2022. 2023. Available at: https://www.unaids.org/en/resources/documents/2024/global-aids-monitoring-guidelines. Accessed 16 June 2023.
- 3. Chipanta D, Amo-Agyei S, Giovenco D, Estill J, Keiser O. Socioeconomic inequalities in the 90-90-90 target, among people living with HIV in 12 Sub-Saharan African countries—implications for achieving the 95-95-95 target—analysis of population-based surveys. EClinicalMedicine2022; 53:101652.
- 4. Zakaria HF, Ayele TA, Kebede SA, Jaldo MM, Lajore BA. Joint modeling of incidence of unfavorable outcomes and change in viral load over time among adult HIV/AIDS patients on second-line anti-retroviral therapy, in selected public hospitals of Addis Ababa, Ethiopia. HIV/AIDS (Auckl)2022; 14:341–54.
- 5. UNAIDS. UNAIDS 90-90-90 an ambitious treatment target to help end the AIDS epidemic 2014. Available at: https://www.unaids.org/en/resources/documents/2017/90-90-90. Accessed 16 June 2023.
- 6. Frescura L, Godfrey-Faussett P, Ali Feizzadeh A, et al Achieving the 95 95 95 targets for all: a pathway to ending AIDS. PLoS One2022; 17:e0272405.
- 7. UNICEF. Understanding and improving viral load suppression in children with HIV in Eastern and Southern Africa. Available at: https://www.unicef.org/esa/reports/understanding-and-improving-vls. Accessed 16 June 2023.
- 8. EPHI. Current-progress-towards-90-90-90-HIV-treatment-achievement-and-exploration-of-challenges-faced-in-Ethiopia. 2020. Available at: https://ephi.gov.et/wp-content/uploads/2021/06/1. Accessed 13 January 2024.
- 9. EPHIA. Ethiopia population-based HIV impact assessment EPHIA 2017–2018. 2018. Available at: https://phia.icap.columbia.edu/wp-content/uploads/2020/02/3511. Accessed 17 June 2023.
- 10. Haileamlak A. Will Ethiopia achieve the global target of 90-90-90?Ethiop J Health Sci2019; 29:298.
- 11. CSA/ICF. Ethiopian Demographic and Health Survey 2016. CSA and ICF; 2016.
- 12. El-Sadr WM, Rabkin M, Nkengasong J, Birx DL. Realizing the potential of routine viral load testing in Sub-Saharan Africa. J Int AIDS Soc2017; 20(S7):1.
- 13. World Health Organization. Editor Consolidated Guidelines on HIV Prevention, Testing, Treatment, Service Delivery and Monitoring. World Health Organization; 2021.
- 14. Inzaule SC, Kroeze S, Kityo CM, et al Long-term HIV treatment outcomes and associated factors in Sub-Saharan Africa: multicountry longitudinal cohort analysis. AIDS2022; 36:1437–47.
- 15. Elul B, Basinga P, Nuwagaba-Biribonwoha H, et al High levels of adherence and viral suppression in a nationally representative sample of HIV-infected adults on antiretroviral therapy for 6, 12 and 18 months in Rwanda. PLoS One2013; 8:e53586.
- 16. Fokam J, Sosso SM, Yagai B, et al Viral suppression in adults, adolescents and children receiving antiretroviral therapy in Cameroon: adolescents at high risk of virological failure in the era of “test and treat.” AIDS Res Ther 2019; 16:36.
- 17. Isaac EW, Ajani A, Difa AJ, Aremu JT, Oluwaseun OC, Hassan MD. Viral suppression in adult Nigerians in a regional antiretroviral therapy programme: a cross sectional descriptive study. World J AIDS2021; 11:1031.
- 18. Joseph D. Prevalence and Factors Associated With Viral Load Suppression Among People Living With HIV in Mwanza, Tanzania. Muhimbili University of Health and Allied Sciences; 2019.
- 19. Anito AA, Lenjebo TL, Woticha E, Solomon F. Magnitude of viral load suppression and associated factors among clients on antiretroviral therapy in public hospitals of Hawassa City Administration, Ethiopia. HIV AIDS (Auckl)2022; 14:529–38.
- 20. Atnafu GT, Moges NA, Wubie M, Gedif G. Incidence and predictors of viral load suppression after enhanced adherence counseling among HIV-positive adults in West Gojjam Zone, Amhara Region, Ethiopia. Infect Drug Resist2022; 15:261–74.
- 21. Ali JH, Yirtaw TG. Time to viral load suppression and its associated factors in cohort of patients taking antiretroviral treatment in East Shewa zone, Oromiya, Ethiopia, 2018. BMC Infect Dis2019; 19:1084.
- 22. Mehari EA, Muche EA, Gonete KA. Virological suppression and its associated factors of dolutegravir based regimen in a resource-limited setting: an observational retrospective study in Ethiopia. HIV/AIDS (Auckl)2021; 13:709–17.
- 23. Liberati A, Altman DG, Tetzlaff J, et al The PRISMA statement for reporting systematic reviews and meta-analyses of studies that evaluate health care interventions: explanation and elaboration. Ann Intern Med2009; 151:W-65–94.
- 24. Peterson J, Welch V, Losos M, Tugwell P. The Newcastle-Ottawa Scale (NOS) for assessing the quality of nonrandomised studies in meta-analyses. Ottawa Hospital Research Institute; 2011.
- 25. Berihun H, Bazie GW, Beyene A, Zewdie A, Kebede N. Viral suppression and associated factors among children tested for HIV viral load at Amhara Public Health Institute, Dessie branch, Ethiopia: a cross-sectional study. BMJ Open2023; 13:e068792.
- 26. Diress G, Dagne S, Alemnew B, Adane S, Addisu A. Viral load suppression after enhanced adherence counseling and its predictors among high viral load HIV seropositive people in North Wollo zone public hospitals, Northeast Ethiopia, 2019: retrospective cohort study. AIDS Res Treat2020; 2020:8909232.
- 27. Melak D, Wedajo S, Dewau R. Time to viral re-suppression and its predictors among adults on second-line antiretroviral therapy in South Wollo zone public hospitals: stratified cox-model. HIV AIDS (Auckl)2023; 15:411–21.
- 28. Melku M, Abebe G, Teketel A, et al Immunological status and virological suppression among HIV-infected adults on highly active antiretroviral therapy. Environ Health Prev Med2020; 25:43.
- 29. Minyichil B. Viral load suppression and its predictor among HIV seropositive people who receive enhanced adherence counseling at public health institutions in Bahir Dar, Northwest Ethiopia. Retrospective follow-up study. 2022.
- 30. Wedajo S, Degu G, Deribew A, Ambaw F. Rate of viral re-suppression and retention to care among PLHIV on second-line antiretroviral therapy at Dessie Comprehensive Specialized Hospital, Northeast Ethiopia: a retrospective cohort study. HIV AIDS (Auckl)2021; 13:877–87.
- 31. Jaleta F, Bekele B, Kedir S, et al Predictors of unsuppressed viral load among adults on follow up of antiretroviral therapy at selected public and private health facilities of Adama Town: unmached case-control study. BMC Public Health2022; 22:1770.
- 32. Sado AG, Chakso SW-M, Obsie GW. Human immunodeficiency virus viral load suppression and associated factors among client on anti-retroviral therapy in Asella Teaching and Referral Hospital, Ethiopia.
- 33. Sorsa A. Clinical, immunological and virological responses of zidovudine-lamivudine-nevirapine zidovudine-lamivudine-efavirenz antiretroviral treatment (ART) among HIV-1 infected children: Asella Teaching and Referral Hospital, South-East Ethiopia. Open Med Inform J2018; 12:11–8.
- 34. Waju B, Dube L, Ahmed M, Assefa SS. Unsuppressed viral load level in public health facilities: nonvirological predictors among adult antiretroviral therapy users in Southwestern Ethiopia. HIV/AIDS (Auckl)2021; 13:513–26.
- 35. Haile T, Hawulte B, Alemayehu S. A retrospective cross-sectional study on the prevalence and factors associated with virological non-suppression among HIV-positive adult patients on antiretroviral therapy in Woliso Town, Oromia, Ethiopia. Int J Med Health Sci2021; 15:158–64.
- 36. Erjino E, Abera E, Lemma Tirore L. Time to viral load suppression and its predictors among adult patients on antiretroviral therapy in Nigist Eleni Mohammed Memorial Comprehensive Specialized Hospital, Hossana, Southern Ethiopia. HIV AIDS (Auckl)2023; 15:157–71.
- 37. Fenta DA, Wube TB, Nuru MM. Long-term immunological and virological outcomes in children receiving highly active antiretroviral therapy at Hawassa University College of Medicine and Health Sciences, Southern Ethiopia. J Immunol Res2021; 2021:2498025.
- 38. Hussen S, Mama M, Mekonnen B, et al Predictors of time to viral load suppression of adult PLWHIV on ART in Arba Minch General Hospital: a follow up study. Ethiop J Health Sci2019; 29:751–8.
- 39. Kolako E. Viral load suppression and associated factors among HIV positive adults attending Hawassa University Comprehensive Specialized Hospital. 2019.
- 40. Desta AA, Woldearegay TW, Futwi N, et al HIV virological non-suppression and factors associated with non-suppression among adolescents and adults on antiretroviral therapy in Northern Ethiopia: a retrospective study. BMC Infect Dis2020; 20:4.
- 41. Dires YM, Manyazewal T, Charlotte H. Virological non-suppression and associated factors among adolescents and youth living with HIV in Ethiopia: A facility-based case-control study. 2021. Available at: https://doi.org/10.21203/rs.3.rs-1014693/v1. Accessed 16 June 2023.
- 42. Mideksa S. Viral Load Suppression and Associated Factors Among HIV/AIDS Patients on ART in Addis Ababa, Ethiopia 2021. Addis Ababa University; 2021.
- 43. Taieb F, Madec Y, Cournil A, Delaporte E. Virological success after 12 and 24 months of antiretroviral therapy in Sub-Saharan Africa: comparing results of trials, cohorts and cross-sectional studies using a systematic review and meta-analysis. PLoS One2017; 12:e0174767.
- 44. Wirth KE, Gaolathe T, Pretorius Holme M, et al Population uptake of HIV testing, treatment, viral suppression, and male circumcision following a community-based intervention in Botswana (Ya Tsie/BCPP): a cluster-randomised trial. Lancet HIV2020; 7:e422–33.
- 45. Endalamaw A, Mekonnen M, Geremew D, Yehualashet FA, Tesera H, Habtewold TD. HIV/AIDS treatment failure and associated factors in Ethiopia: meta-analysis. BMC Public Health2020; 20:8–2.
- 46. Tchouwa GF, Eymard-Duvernay S, Cournil A, et al Nationwide estimates of viral load suppression and acquired HIV drug resistance in Cameroon. EClinicalMedicine2018; 1:21–7.
- 47. Adugna A, Azanaw J, Sharew Melaku M. The effect of COVID-19 on routine HIV care services from health facilities in Northwest Ethiopia. HIV/AIDS (Auckl)2021; 13:1159–68.
- 48. Chilot D, Woldeamanuel Y, Manyazewal T. COVID-19 burden on HIV patients attending antiretroviral therapy in Addis Ababa, Ethiopia: a multicenter cross-sectional study. Front Med2022; 9:62.
- 49. Amhare AF, Zhao M, Seeley J, et al Impact of COVID-19 on HIV services and anticipated benefits of vaccination in restoring HIV services in Ethiopia: a qualitative assessment. Front Public Health2022; 10:1033351.
- 50. Altice F, Evuarherhe O, Shina S, Carter G, Beaubrun AC. Adherence to HIV treatment regimens: systematic literature review and meta-analysis. Patient Prefer Adherence2019; 13:475–90.
- 51. Dessie G, Wagnew F, Mulugeta H, et al The effect of disclosure on adherence to antiretroviral therapy among adults living with HIV in Ethiopia: a systematic review and meta-analysis. BMC Infect Dis2019; 19:52–8.
- 52. Ford N, Orrell C, Shubber Z, Apollo T, Vojnov L. HIV viral resuppression following an elevated viral load: a systematic review and meta-analysis. J Int AIDS Soc2019; 22:e25415.