Introduction
Systematic endobronchial ultrasound (EBUS) combined with esophageal endosonographic evaluation (EUS/EUSb) is currently the recommended first-line staging procedure in lung cancer []. During a systematic evaluation of the entire mediastinum – going from the contralateral hilum to the ipsilateral hilum – all lymph nodes should be carefully assessed []. Information from both CT and FDG-PET are generally used to define the risk of malignancy in lymph nodes, subsequently guiding the sampling strategy. In routine clinical practice, every node which is FDG-PET avid or has a CT-based short axis size ≥10 mm should be aspirated. And if CT or PET-CT has shown abnormal mediastinal findings, at least three different mediastinal lymph node stations (4R, 4L, 7) should, for example, be sampled []. When no PET scan information is available or the lymph node shows low uptake, B-mode ultrasound characteristics and the short axis diameter as measured during EBUS/EUSb are often used to determine when to aspirate. However, there is no consensus on the lower limit in ultrasound size for aspiration. While the 10-mm short axis size, as equal to CT, is often used, cutoffs ranging from 5 to 10 mm are found across studies [-]. Studies assessing B-mode criteria such as node heterogeneity, shape, and a central hilar structure have also been found to be contradictory in their results []. A recent meta-analysis found that ultrasound features might indeed correlate with malignancy but should be further studied to determine their true predictive capability [].
EBUS-strain elastography (EBUS-SE) is one of the relatively new ultrasound features. It has proven promising in risk stratification of likely malignant lymph nodes among different studies []. EBUS-SE derives tissue strain by monitoring how tissue deforms over time as a force is being applied. Its working principle can be best compared to classical palpation. In short, a region of tissue that is heavily deformed when compared to another region in the same image is derived to be high in strain (easily deformed). A region that is barely deformed when compared to another region by this same force is derived to be low in strain (low deformation). In EBUS-SE, this tissue deformation is measured primarily in the axial direction (depth direction). The periodical motion of the heart and greater vessels are hypothesized to exert the needed force on surrounding tissue. For calculating the relative strain, the received ultrasound signal needs to be monitored over time. By mapping how the signal varies over time (while a force is being exerted), one can compute the deformation. A relative strain can be derived from this deformation and is generally relayed to the user through a color-coded overlay projected over the B-mode image. Several qualitative and semi-quantitative techniques to assess the calculated relative strain have been reported. We recently showed that the strain histogram method will give the best overall accuracy for predicting lymph node malignancy, as it is the most operator-independent and thus objective technique []. More detailed information on EBUS-SE assessment technique and SE technology can also be found in the previous publication and its online supplementary material [, ].
In this international prospective multicenter study, we investigated the predictive value of EBUS-SE in patients with suspected or proven lung cancer in daily clinical care. Using a standardized measurement strategy, we assessed if EBUS-SE can help predict malignancy in lymph nodes as an individual predictive value, and, if it can help enhance prediction by combining EBUS-SE information with FDG-PET information and EBUS lymph node short axis size. The interobserver variability was furthermore determined.
Materials and Methods
Study Subjects
This prospective international multicenter study (n = 5 centers) is a registered study. Patients of 18 years and older with an EBUS indication for a suspected or proven lung cancer were eligible. Prior chemo- or radiotherapy were exclusion criteria due to hypothesized tissue-altering effects. All measurements were obtained using Pentax EB1970UK and EB19-J10U ultrasound bronchoscopes (Pentax Medical, Japan) and Hitachi Preirus Hi Vision US processors (Hitachi Corp, Japan) with unified software settings in each center.
Study Design
To assess if EBUS-SE can help predict lymph node malignancy, two main research questions were formulated:
Can EBUS-SE by itself help predict malignancy of mediastinal lymph nodes in a multicenter setting? This was divided into two sub-questions: (a) is strain a predictive parameter, and (b) can it be used as a reproducible measurement technique in daily clinical care?
Can we improve the current risk stratification by further incorporating EBUS-SE information with lymph node size and FDG-PET avidity information?
Methods
All participating centers received similar training in EBUS-SE technique and pitfalls preceding to study participation. Systematic EBUS-transbronchial needle aspiration (EBUS-TBNA) staging was performed following international and local guidelines [, , ]. EBUS-SE measurements of to-be-aspirated lymph nodes were acquired at the discretion of the endoscopist. A standardized measurement protocol using the strain histogram scoring technique was used to quantify measured lymph node strain as previously reported in more detail [see , ]. Compared to previously published data [], the EBUS-SE software settings were updated. As such, the EBUS-SE mean strain cutoff was re-analyzed for optimal performance in the present study.
Known prognostic variables such as FDG-PET avidity, CT size, and ultrasound B-mode characteristics were collected by the endoscopist []. The local FDG-PET reports as available for the endoscopist were used for further analysis. No central reading on FDG-PET was performed. Strain measurement reproducibility was furthermore scored subjectively by the operator as “heavily changing,” “slightly changing,” or “reproducible” based on the strain rate graph and corresponding color overlays [].
Analysis
SE measurements and corresponding case report forms were coded, digitalized, and completed by the site investigator. The case report forms were correlated with strain measurements (by author R.L.J.V., blinded). Individual lymph node cytopathology and subsequent surgical results were used for correlation to EBUS-SE measurements. When no follow-up tissue sample was available, an imaging-based clinical follow-up of at least 6 months was used. Statistical analysis was performed using R-studio []. The performance of predictors was assessed using contingency tables and predictors derived from these, accompanied by their 95% confidence intervals (95% CI). Predictors include sensitivity, specificity, negative predictive value (NPV), positive predictive value (PPV), accuracy, receiver operator characteristic (ROC) curves, negative likelihood ratios (LR–), positive likelihood ratios (LR+), and pre- to post-test probabilities of malignancies calculated from these. The predictive value of continuous variables was assessed through the area under the curve (AUC) of the ROC. To analyze the added value of predictive variables to one another (chronologically), an ANOVA of different predictive models was made using a χ2 test (PET alone, PET and EBUS short axis size combined, PET and EBUS short axis size further combined with EBUS-SE). Inter-observer variability of strain was assessed by comparing ROCs among different hospitals, adjusted for nonpaired data []. During analysis, a relatively low false-negative rate of imaging results was prioritized above overall accuracy to obtain the highest staging accuracy.
Results
General Information
Between May 2016 and July 2018, measurements of 525 lymph nodes from 327 unique patients were included for study analysis (CONSORT diagram; Fig. 1). Of the included 525 lymph nodes on which EBUS-TBNA and elastography measurements were performed, 228 were found to be malignant through initial cytopathology findings, 170 received further surgical verification, and 127 underwent additional clinical and imaging follow-up to confirm benign disease. The overall prevalence of malignancy was 48%. Study demographics and lymph node information are shown in Table 1 and online supplemental Table E.1 (for all online suppl. material, see http://www.karger.com/doi/10.1159/000507592).
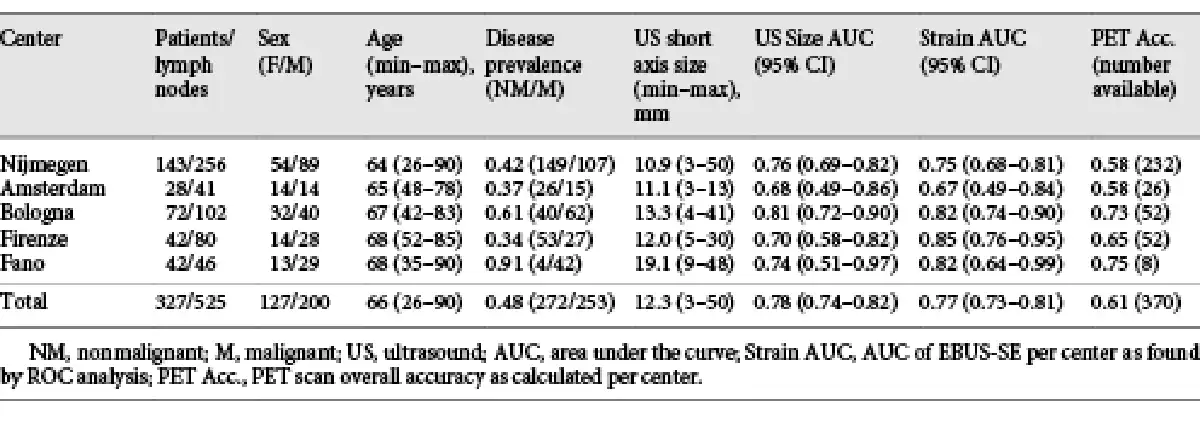
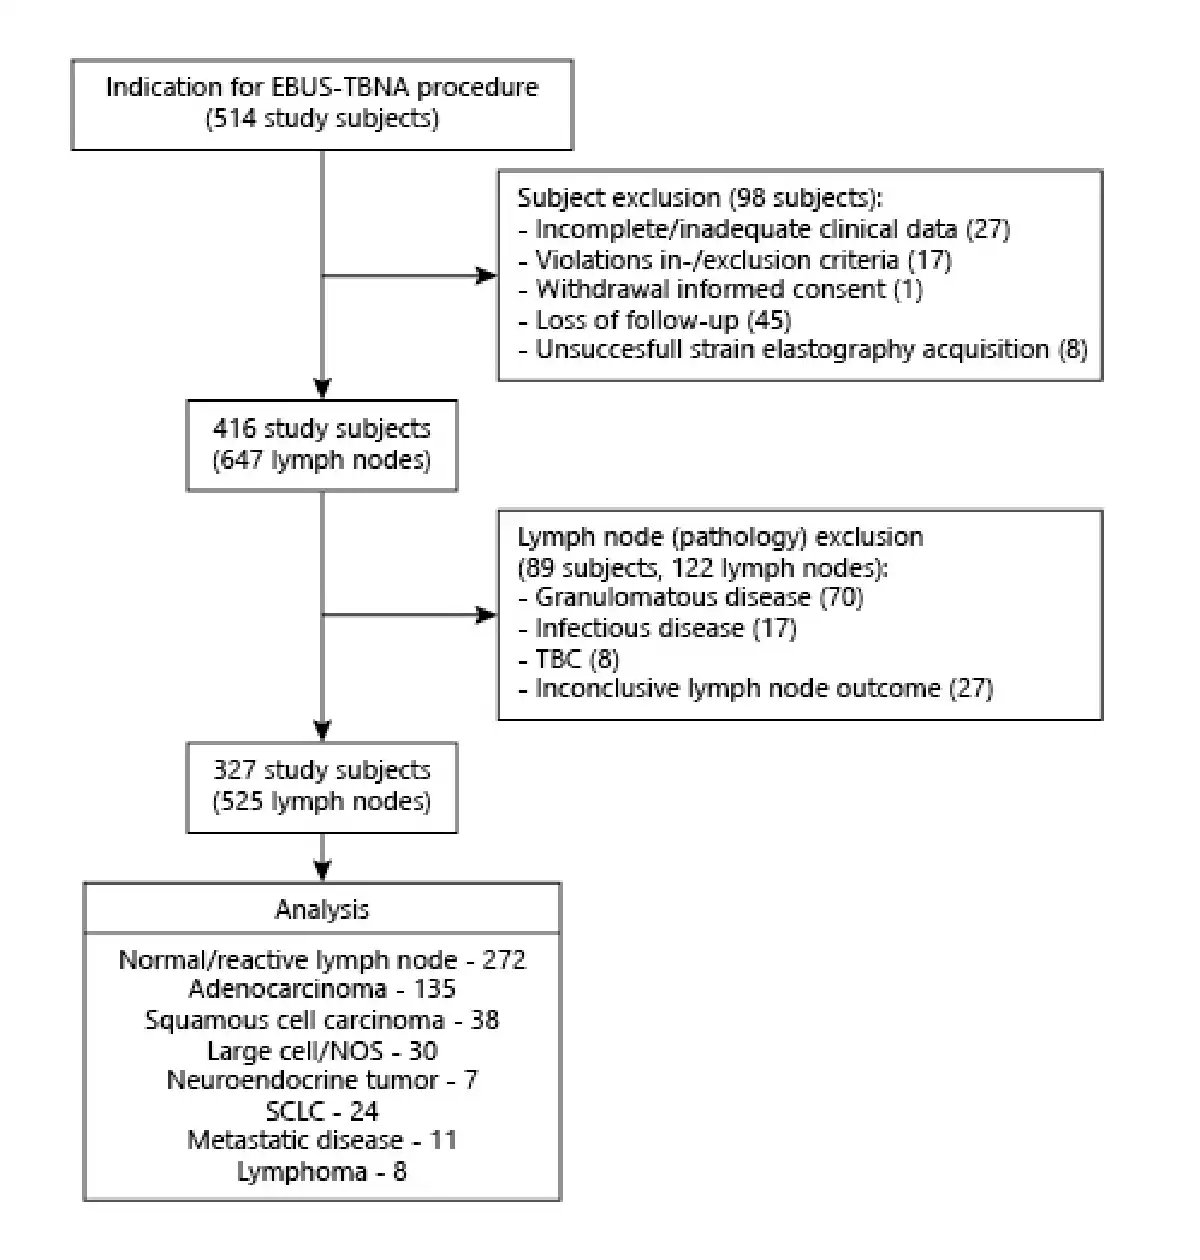
Fig. 1
CONSORT diagram of study inclusion.
EBUS-SE Performance
ROC analysis was performed to assess the predictive value of EBUS-SE. In Table 1, ROC analysis of the mean strain as obtained from all 5 centers showed an AUC of 0.77 (95% CI 0.73–0.81). The AUC of individual hospitals ranged between 0.67 to 0.85. Pairwise ROC comparison of individual hospitals showed that EBUS-SE performance did not vary significantly across centers. Comparing the highest to lowest AUC and largest to smallest volume performances gave p values of 0.072 and 0.41, respectively (online suppl. Table E.2).
In 456 out of 525 lymph nodes in this multicenter study an adequate track record on temporal reproducibility of EBUS-SE measurements was available. The endoscopists subjectively rated EBUS-SE lymph node measurements as “heavily changing” in 41 measurements (8.9%), “slightly changing” in 135 measurements (29.6%), and “reproducible” in 280 (61.4%) measurements. To assess if SE performance varied with reproducibility scoring, ROC comparison of the differently scored subsets was performed. No significant differences were found (p > 0.4). To obtain a representative dataset, all measurements were included for analysis.
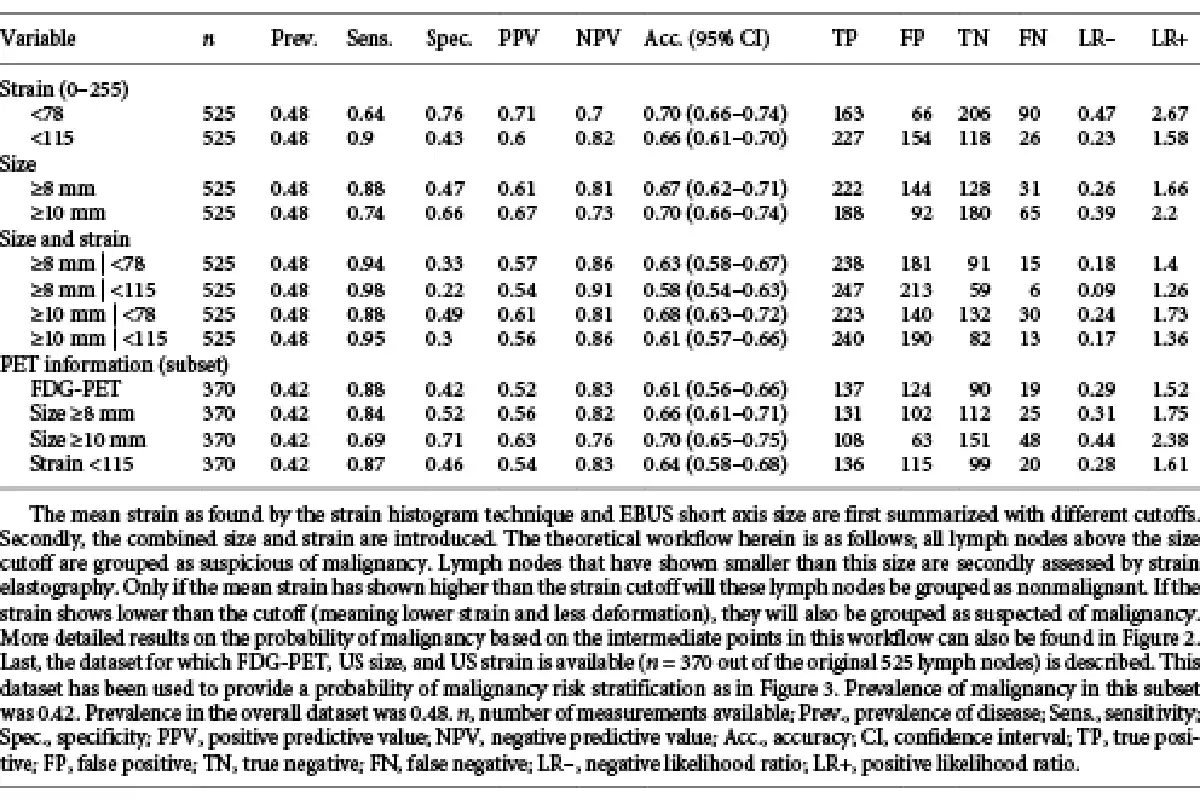
Distinctive cut-off values of the strain histogram mean were studied to identify clinically relevant scenarios. As a stand-alone predictive parameter of malignancy, a mean strain cut-off value of <115 (range 0–255) was found most suitable, having high sensitivity (90%) and NPV (82%) with moderate specificity (43%) and PPV (60%; Table 2). Using this cutoff as the only criterion for predicting malignancy, the LR+ of 1.58 would change the 0.48 pre-test probability of malignancy (being equal to prevalence of disease) to a 0.60 post-test probability of malignancy. The found LR– of 0.23 would imply that the 0.48 pre-test probability of disease decreases to 0.18 if mean strain was measured to be greater than 115 (Table 2).
Size and FDG-PET Performance
The variables size and FDG-PET avidity have long shown their value for lymph node malignancy prediction in routine clinical practice. The predictive value of these variables along with EBUS-SE as found in this study are summarized in Tables 1 and 2. In the data subset where FDG-PET information was available (370 lymph nodes), PET avidity showed high sensitivity (88%) and NPV (83%) at moderate specificity (42%). Overall, FDG-PET accuracy was 61%, and, FDG-PET performance did not significantly differ across centers (p > 0.05; Table 1). ROC Analysis of EBUS-based lymph node short axis size showed an overall AUC of 0.78 (95% CI 0.74–0.82), and nonsignificant (p > 0.05) performance differences across centers in pairwise ROC comparison (Table 1). Further analysis of different size-based cutoffs showed how the diagnostic utility of EBUS-based lymph node size varied with the chosen cutoff (Table 2). Using a short axis size of ≥10 mm as predictor for malignancy resulted in an LR– of 0.39. Sixty-five out of all 253 malignancies in this dataset would then be falsely classified as benign (25.7%). A size minimum of ≥8 mm as cut-off value would reduce false negatives to 31 in this dataset, being 12.3% of the total amount of malignancies (LR– of 0.26). The increase in sensitivity (74 to 88%) gained by preferring the ≥8-mm criterion, however, comes at a cost of more false positives. Whereas a ≥10-mm cutoff had an LR+ of 2.2, a ≥8-mm cutoff had an LR+ of only 1.66 (Table 2).
Clinical Scenarios
Combining SE with Size
After assessing the different scenarios in which size and strain imaging could be combined in clinical practice, it was found that a lymph node size ≥8 mm in combination with a strain cutoff of <115 would best stratify the risk of malignancy in this dataset. Analysis of this stratification showed that adding strain to EBUS-measured lymph node short axis size could significantly help to stratify the risk of malignancy compared to stratification based upon EBUS-measured short axis size alone (p < 0.001). If using these cutoffs to assume that all lymph nodes ≥8 mm and the subset of lymph nodes <8 mm that had strain <115 were considered malignant, an overall sensitivity of 95%, NPV 86%, specificity 30%, and PPV 56% was found (Table 2). The risk stratification methodology can, however, be better interpreted by a decision tree diagram. A more detailed visualization of how risk of malignancy changes with the found variable outcome is shown in Figure 2. By this stratification methodology, double-imaging positive lymph nodes (being ≥8 mm and low in strain) would have a 70% chance of being malignant in this dataset. In contrast, double-imaging negative lymph nodes (<8 mm and high in strain) would have an 11% chance of being malignant and thus be false negative.
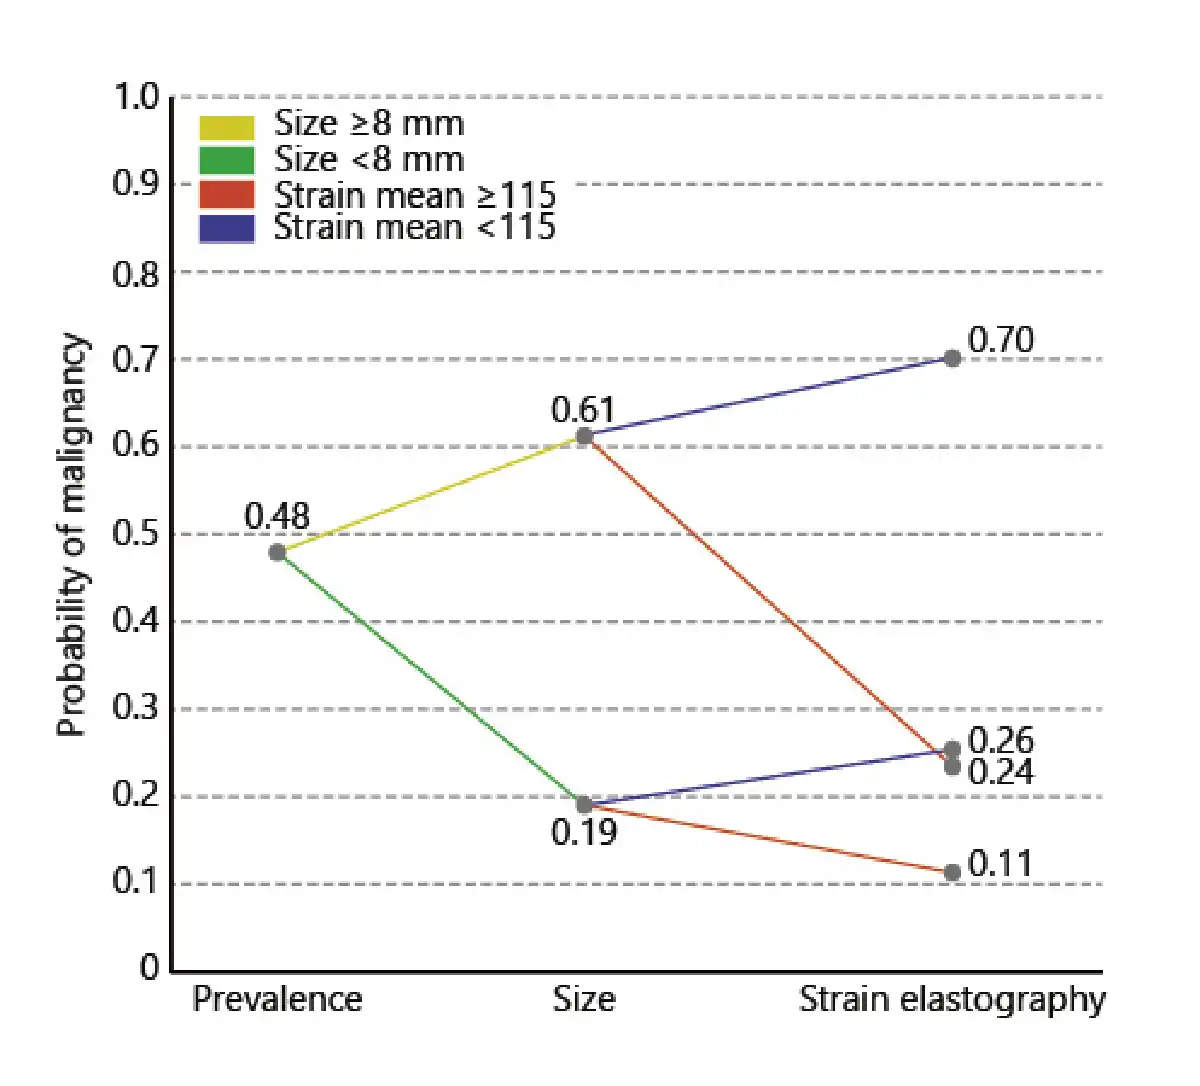
Fig. 2
Clinical scenario combining EBUS size and EBUS-SE for predicting probability of mediastinal lymph node malignancy. This analysis was performed on all lymph nodes where data for both were available (n = 525 lymph nodes). The initial prevalence of disease is used as the starting point (pre-test probability of malignancy). From there, the post-test probability of malignancy is updated based upon the EBUS short axis size information. If EBUS size is ≥8 mm, probability of malignancy increases. If EBUS size is <8 mm, probability of malignancy decreases. After having obtained the intermediate EBUS size-based probability of malignancy, the EBUS-SE measurement outcome is further included to assess the contribution of EBUS-SE to the probability of malignancy. A strain <115 is associated with an increase in probability of malignancy. A strain ≥115 is associated with a decrease in probability of malignancy.
Combining SE with Size and FDG-PET
To enable a risk stratification analysis using FDG-PET avidity, EBUS short axis size, and EBUS-SE information, the subset of data where FDG-PET was available was analyzed (n = 370). While the prevalence of lymph node metastases in this subset of data was slightly lower (0.42), the accuracies of the predictive values EBUS size and EBUS-SE did not significantly differ from that of the overall dataset (Table 2). Assessing several scenarios in this subset showed that both an EBUS size and EBUS-SE cutoff similar to the previous model could be used, being a size of 8 mm and a strain cutoff of 115. Combining FDG-PET avidity and EBUS size with EBUS-SE significantly enhanced lymph node malignancy prediction when compared to a risk stratification based upon FDG-PET and EBUS-based short axis size alone (p < 0.001). The resulting risk stratification model is shown in Figure 3. In all sub-scenarios where FDG-PET and size information were combined, EBUS-SE increased or decreased the likelihood of malignancy in cases of low and high strain, respectively. If all three predictors were negative, a 9% chance of malignancy remained. If all three predictors were positive, lymph nodes had a 73% chance of malignancy (Fig. 3).
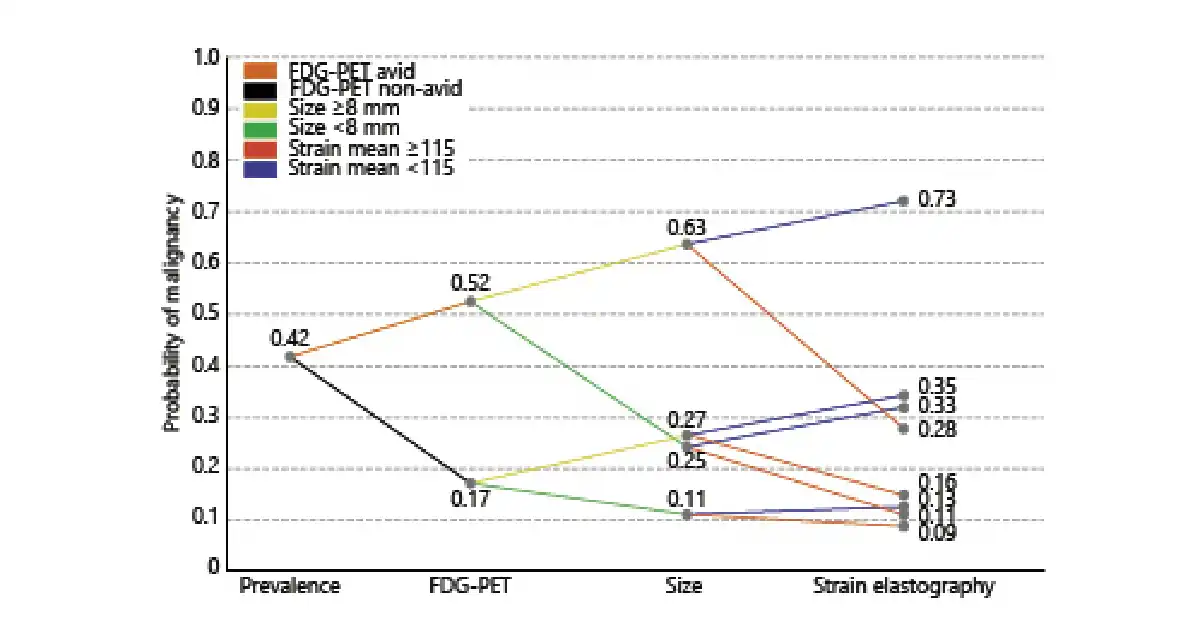
Fig. 3
Clinical scenario combining PET, EBUS size, and EBUS-SE for predicting probability of mediastinal lymph node malignancy. This analysis was performed on all lymph nodes where data for all three were available (n = 370 lymph nodes). The initial prevalence of disease is used as the starting point (pre-test probability of malignancy). From there, the post-test probability of malignancy is updated based upon FDG-PET avidity information. FDG-avid lymph nodes had an increased probability of malignancy, whereas non-avid lymph nodes decreased the probability of lymph nodes being malignant. From there, the post-test probability of malignancy is updated based on the EBUS-measured lymph node short axis size information. If EBUS size is ≥8 mm, probability of malignancy increases. If EBUS size is <8 mm, probability of malignancy decreases. Following the obtained intermediate PET and EBUS size-based probability of malignancy, the EBUS-SE measurement is included to assess its contribution to the probability of malignancy. A strain <115 is associated with an increase in chance of malignancy. A strain ≥115 is associated with a decrease in chance of malignancy.
Discussion
To our knowledge, this is the first study utilizing a standardized assessment protocol to show the added predictive value of EBUS-SE in relevant daily clinical scenarios in multiple centers. We confirm earlier single-center studies that showed an association between relative strain and presence of lymph node malignancy [, ]. In this study, we show that SE is an independent predictive variable. Furthermore, we show that EBUS-SE can be used in conjunction with EBUS lymph node short axis size and FDG-PET information to help better select which nodes must be further evaluated. Using two clinical scenarios, we show how EBUS-SE can help further risk stratify the chance of malignancy. The addition of EBUS-SE in clinical practice could increase EBUS-TBNA staging accuracy. It might help intraprocedural decision making in cases of multiple nodes within a region or unrepresentative ROSE (i.e., insufficient percentage of lymphoid cells to confirm lymph node aspirate), and in decision making on further work-up after EBUS-TBNA in cases of unrepresentative cytology findings.
SE is a relative measure and can therefore vary with measurement technique and time. Standardization and training are important for EBUS-SE implementation []. In this study, the performance variability of EBUS-SE was found to be insignificant between centers and operators. However, we signify the need of additional technical research to further improve reproducibility and standardization across systems and manufacturers. Moreover, when one starts using EBUS-SE, efforts should be made to assess how well EBUS-SE risk stratification performs. It is unknown beyond the here-studied population and observers how performance might be influenced by differences in patient cohorts and measurement technique settings.
Strain is a continuous variable with a range of 0–255, similar to EBUS size. We present scenarios using a distinct cutoff. Continuous variables have gradual onset rather than distinctive values, and risk of malignancy is thus not fully reflected by one value. Again, the discussed scenarios were chosen because a low false-negative rate was prioritized above overall accuracy for obtaining the highest staging accuracy.
The differences in EBUS-SE performance of Nijmegen in this study and previously published results are not fully understood (AUC 0.75 vs. 0.846) []. Possibly, a more rigorous selection for measurement inclusion was previously applied since the protocol was kept similar. Although unlikely, the updated software setting could also have had a small effect. With the updated software settings and low false-negative prioritization, we now find an optimal cut-off value of 115 (previously; 78).
The present guidelines do not specifically state distinct cut-off values for aspiration of lymph nodes during an EBUS staging procedure. In general, as used per CT imaging, ≥10 mm is often chosen as the cut-off value for increased chance of malignancy. We confirm that this cut-off size indeed showed good overall accuracy (70%) in predicting lymph node malignancy in our dataset. However, it should be considered that good overall accuracy does not necessarily correlate to high sensitivity. Earlier studies have used cut-off values varying from 5 to 10 mm with success [-]. Based on our results, we propose to at least routinely include nodes of ≥8 mm for aspiration when no additional predictive variables are used. Using this criterion in our dataset would, however, still result in 12.3% of malignant lymph nodes being missed. This is already a major step forward when compared to a 10-mm cutoff, which would equal to as much as 25.6% of malignant lymph nodes being missed. Ideally, lymph nodes smaller than 8 mm should also be considered for aspiration, but the more recent large multicenter trials have used this 8-mm cut-off value successfully [, ]. We recommend further research on this subject to enable adjustment of the guidelines accordingly.
For assessing mediastinal lymph node involvement, FDG-PET imaging is recommended [, ]. Its results cannot be omitted once available. The endoscopist is likely to aspirate avid nodes regardless of size or EBUS-SE. In this study, PET imaging was available across centers as per their routine clinical practice. No central reading was performed, possibly affecting FDG-PET accuracy variability. Binomial proportion testing, however, showed insignificant FDG-PET accuracy differences across centers.
Lymph nodes were included for aspiration based on criteria other than SE. In that respect, none of the included lymph node aspirations were carried out without an inclusion bias. Future work should assess SE using systematic inclusion rather than based to the operator’s own insights. Furthermore, additional studies should assess if a multi-frame strain analysis that is cross-compatible across systems and manufacturers can be introduced to further increase temporal reproducibility, widespread availability, and diagnostic performance.
Conclusion
EBUS-SE helps predict malignant lymph node involvement in patients with lung cancer. The addition of ultrasound SE to EBUS short axis size and FDG-PET avidity further improves risk stratification for malignancy.
Statement of Ethics
The research was conducted ethically in accordance with the latest World Medical Association Declaration of Helsinki. The study is registered and can be found on ClinicalTrials.gov (identifier: NCT02488928). The study protocol was approved by the medical ethics committees in both the Netherlands and Italy, where subject inclusion took place after having obtained informed consent.
Disclosure Statement
Roel L.J. Verhoeven reports grants from Pentax Medical Europe, during the conduct of the study; and grants from AstraZeneca Oncology, grants from Philips Medical, personal fees and nonfinancial support from Medtronic, and grants from Ankie Hak Fund, outside the submitted work. Rocco Trisolini, Fausto Leoncini, Piero Canoli, Michela Bezzi, Alessandro Messi, Mark Krasnik, and Chris L. de Korte report nothing to disclose. Dr. Annema reports grants from Mauna Kea, grants and nonfinancial support from Pentax Medical, and grants from COOK, outside the submitted work. Erik H.F.M. van der Heijden reports grants and personal fees from Pentax Medical Europe, during the conduct of the study; and grants from AstraZeneca Oncology, grants and nonfinancial support from Philips Medical, personal fees and nonfinancial support from Medtronic, and personal fees from Cook Medical, outside the submitted work.
Funding Sources
This work was kindly supported by unrestricted research grants from the Ankie Hak fund, Astra Zeneca Oncology Netherlands, and Pentax Medical Europe.
Author Contributions
Authors R.L.J.V. and E.H.F.M.H. had full access to all the data in the study and take responsibility for the integrity of the data, collection of data, and the accuracy of the data analysis, including and especially any adverse effects. Author R.T. substantially contributed to data analysis, interpretation, data collection, and revision of the manuscript. Authors F.L., P.C., M.B., A.M., M.K., and J.T.A. contributed substantially to data collection and the revision of the manuscript. Author C.L.K. contributed substantially to the study design, and interpretation and revision of the manuscript.
References
- 1. Silvestri GA, Gonzalez AV, Jantz MA, Margolis ML, Gould MK, Tanoue LT, et al Methods for staging non-small cell lung cancer: Diagnosis and management of lung cancer, 3rd ed: American college of chest physicians evidence-based clinical practice guidelines. CHEST 2013;143:211–250.
- 2. Vilmann P, Clementsen PF, Colella S, Siemsen M, De Leyn P, Dumonceau JM, et al Combined endobronchial and oesophageal endosonography for the diagnosis and staging of lung cancer. European Society of Gastrointestinal Endoscopy (ESGE) Guideline, in cooperation with the European Respiratory Society (ERS) and the European Society of Thoracic Surgeons (ESTS). Eur Respir J. 2015;46(1):40–60. 0903-1936
- 3. Darwiche K, Freitag L, Nair A, Neumann C, Karpf-Wissel R, Welter S, et al Evaluation of a novel endobronchial ultrasound-guided lymph node forceps in enlarged mediastinal lymph nodes. Respiration. 2013;86(3):229–36. 1423-0356
- 4. Herth FJ, Krasnik M, Kahn N, Eberhardt R, Ernst A. Combined endoscopic-endobronchial ultrasound-guided fine-needle aspiration of mediastinal lymph nodes through a single bronchoscope in 150 patients with suspected lung cancer. Chest. 2010;138(4):790–4. 0012-3692
- 5. Herth FJ, Eberhardt R, Krasnik M, Ernst A. Endobronchial ultrasound-guided transbronchial needle aspiration of lymph nodes in the radiologically and positron emission tomography-normal mediastinum in patients with lung cancer. Chest. 2008;133(4):887–91. 0012-3692
- 6. Evison M, Morris J, Martin J, Shah R, Barber PV, Booton R, et al Nodal staging in lung cancer: a risk stratification model for lymph nodes classified as negative by EBUS-TBNA. J Thorac Oncol. 2015;10(1):126–33. 1556-0864
- 7. Crombag LM, Dooms C, Stigt JA, Tournoy KG, Schuurbiers OC, Ninaber MK, et al Systematic and combined endosonographic staging of lung cancer (SCORE study). Eur Respir J. 2019;53(2):1–10. 0903-1936
- 8. Oki M, Saka H, Ando M, Kitagawa C, Kogure Y, Seki Y. Endoscopic ultrasound-guided fine needle aspiration and endobronchial ultrasound-guided transbronchial needle aspiration: are two better than one in mediastinal staging of non-small cell lung cancer?J Thorac Cardiovasc Surg. 2014;148(4):1169–77. 0022-5223
- 9. Wahidi MM, Herth F, Yasufuku K, Shepherd RW, Yarmus L, Chawla M, et al Technical aspects of endobronchial ultrasound-guided transbronchial needle aspiration - CHEST guideline and expert panel report. Chest. 2016;149(3):816–35. 0012-3692
- 10. Hylton DA, Turner J, Shargall Y, Finley C, Agzarian J, Yasufuku K, et al Ultrasonographic characteristics of lymph nodes as predictors of malignancy during endobronchial ultrasound (EBUS): A systematic review. Lung Cancer. 2018;126:97–105. 0169-5002
- 11. Chen YF, Mao XW, Zhang YJ, Zhang CY, Yu YF, Qin E, et al Endobronchial Ultrasound Elastography Differentiates Intrathoracic Lymph Nodes: A Meta-Analysis. Ann Thorac Surg. 2018;106(4):1251–7. 0003-4975
- 12. Verhoeven RL, de Korte CL, van der Heijden EH. Optimal Endobronchial Ultrasound Strain Elastography Assessment Strategy: An Explorative Study. Respiration. 2019;97(4):337–47. 1423-0356
- 13. Verhoeven RL, de Korte CL, van der Heijden EH. Optimal Endobronchial Ultrasound Strain Elastography Assessment Strategy: An Explorative Study - Online Data Supplement. 2019. DOI: (Available at: https://figshare.com/articles/by-resource-doi/10.1159/000494143)
- 14. De Leyn P, Dooms C, Kuzdzal J, Lardinois D, Passlick B, Rami-Porta R, et al Revised ESTS guidelines for preoperative mediastinal lymph node staging for non-small-cell lung cancer. Eur J Cardiothorac Surg. 2014;45(5):787–98. 1010-7940
- 15. Rusch VW, Asamura H, Watanabe H, Giroux DJ, Rami-Porta R, Goldstraw PMembers of IASLC Staging Committee. The IASLC lung cancer staging project: a proposal for a new international lymph node map in the forthcoming seventh edition of the TNM classification for lung cancer. J Thorac Oncol. 2009;4(5):568–77. [cited 2014 Nov 4]. 1556-0864
- 16. Fujiwara T, Yasufuku K, Nakajima T, Chiyo M, Yoshida S, Suzuki M, et al The utility of sonographic features during endobronchial ultrasound-guided transbronchial needle aspiration for lymph node staging in patients with lung cancer: a standard endobronchial ultrasound image classification system. Chest. 2010;138(3):641–7. 0012-3692
- 17. R Core Team. R: A language and environment for statistical computing.2019;Available from: https://www.r-project.org
- 18. Robin X, Turck N, Hainard A, Tiberti N, Lisacek F, Sanchez JC, et al pROC: an open-source package for R and S+ to analyze and compare ROC curves. BMC Bioinformatics. 2011;12(1):77. 1471-2105
- 19. Bousema JE, Dijkgraaf MG, Papen-Botterhuis NE, Schreurs HW, Maessen JG, van der Heijden EH, et alMEDIASTrial study group. MEDIASTinal staging of non-small cell lung cancer by endobronchial and endoscopic ultrasonography with or without additional surgical mediastinoscopy (MEDIASTrial): study protocol of a multicenter randomised controlled trial. BMC Surg. 2018;18(1):27. 1471-2482