Introduction
Chronic obstructive pulmonary disease (COPD) is a progressive medical condition characterized by minimally reversible airflow obstruction. A major feature of COPD is the inability to cope with activities of daily living because of dyspnea []. The diaphragm is the main inspiratory muscle of the body. Patients with COPD have difficulty inhaling as the diaphragm becomes flattened and weakened []. Hyperinflation occurs as a result of the expiratory flow limitation caused by the reduced elastic recoil in the lungs and increased airway resistance. Hyperinflation increases during exercise and acute exacerbation. Dynamic lung hyperinflation (DLH) is a key factor in pathophysiological pathways that leads to dyspnea and poor exercise tolerance in patients with COPD [] because it increases the ventilatory effort while reducing the ability of the inspiratory muscles to generate pressure. Previous studies have shown that hyperinflation increases the contribution of the ribcage and neck muscles and decreases the relative contribution of the diaphragm in patients with COPD [, ]. Accessory respiratory muscles include the sternocleidomastoid (SCM), scalene, trapezius, internal intercostal, and abdominal muscles. The SCMs are electrically silent during quiet breathing [, ]. The activation threshold of the SCM is high [], and it is activated during exercise when higher ventilation is required. SCM in these patients can be assessed by ultrasonographic imaging to measure changes in muscle thickness (inspiratory thickness − expiratory thickness)/expiratory thickness [].
Ultrasonography (US) is a noninvasive technique whose reliability for the evaluation of changes in muscle thickness has been confirmed []. Thoracic US is increasingly considered an essential tool in respiratory medicine []. Although previous studies have reported the usefulness of US for the evaluation of the diaphragm [], to the best of our knowledge, no studies have focused on US evaluation of the SCM in patients with COPD yet. The association between SCM thickening fraction (SCM TF) (calculated using US) and exercise tolerance in patients with COPD remains uncertain till date. Therefore, it is crucial to examine the relationship between SCM TF and exercise tolerance. The validity of the US-measured limb, including the elbow flexors and extensors, knee extensors, and ankle plantar flexors, muscular thickness has been demonstrated through its high correlation with actual measurements using magnetic resonance imaging (MRI) []. However, this does not support the US validity to measure the SCM thickness when compared to MRI measurements.
The present study aimed to evaluate the SCM thickness (end-expiration) and SCM TF (end-expiration to resting inspiration and end-expiration to end-inspiration), which were measured using US between patients with COPD and control subjects. The secondary purpose of the study was to evaluate the correlation between the SCM thickness (end-expiration) and SCM TF (end-expiration to resting inspiration and end-expiration to end-inspiration) and exercise tolerance in patients with COPD. We hypothesized that SCM TF is correlated with exercise tolerance in patients with COPD.
Materials and Methods
Study Design and Subjects
This was a single-center, observational, cross-sectional study. The study was approved by the Ethics Committee of the Kindai University School of Medicine, and all subjects gave their written informed consent. We included 44 patients with clinically stable COPD who visited the Department of Respiratory Medicine and Allergology of the Kindai University Hospital between April 2019 and April 2021. The exclusion criteria were unstable medical conditions that could cause or contribute to breathlessness (i.e., metabolic, cardiovascular, or other respiratory diseases) or any other disorders that could interfere with exercise testing, such as neuromuscular diseases or musculoskeletal problems. We also included 20 age-matched volunteers who did not have any detectable chronic conditions, including pulmonary or cardiovascular disease, as control participants.
We used unpublished preliminary/pilot data to calculate the sample size. Based on preliminary studies in healthy subjects (n = 5) and patients with COPD (n = 5), the average extent of 10 SCM thicknesses in healthy subjects and patients with COPD was 1.05 cm (standard deviation [SD] = 0.11) and 1.14 cm (SD = 0.32), respectively. We assumed a mean population difference of 0.10 cm and an SD of 0.20 cm for the two groups. Using these values, the required number of cases was 36 (18 subjects in each group) based on Student’s t test, which was used to assess the difference in SCM thickness between the two groups, with a significance level of 5% (bilateral) and a study strength of 80%. To account for participants leaving the study, the target number of subjects was 40 (20 in each group). However, we recruited more than 20 patients with COPD to perform the regression analysis to identify the variables that were most predictive of exercise capacity.
Measurements
US recordings of the SCM thickness were made unilaterally (the right side of the body) using the LOGIQ e Premium system (GE Healthcare Japan, Tokyo, Japan). The right hemi-SCM thickness was measured using a linear 7.5-MHz probe according to the method of Arts et al. []. The probe was placed lateral to the anterior neck and parallel to the middle of the SCM, which was measured halfway along the line from the mastoid bone to the clavicular margin. The carotid artery on the right was used as a marker on the screen. SCM was identified by visualizing the carotid artery as a marker and anatomical reference point. The SCM thickness was measured using frozen images at the ends of expiration and inspiration. The patients were instructed to hold their breath at the ends of inspiration and exhalation to take frozen images. To the best of our knowledge, a standard patient position for SCM thickness measurement has not been established yet. Hence, we decided that the standing position was appropriate because exercise testing and daily life activities are usually performed in the standing position. Each subject was instructed to deeply inhale as much as possible and exhale as requested, and a spirometer was used to confirm the range of the inspiratory capacity (IC). These operations were repeated thrice. Rest inhalation was similarly performed, using a spirometer to check the amount of inhaled and exhaled breath when breathing normally at rest, and this procedure was repeated thrice. During each of the three breaths, the expiration volume, resting inspiration, and maximum inspiration were measured, as well as the SCM thickness. The SCM thickness was measured at end-inspiration, end-expiration (residual volume), and resting inspiration (Fig. 1a, b). The SCM TF (%) was calculated as the difference in the SCM thickness between end-expiration and resting inspiration divided by the thickness at end-expiration × 100 and that between end-expiration and end-inspiration divided by the thickness at end-expiration × 100.
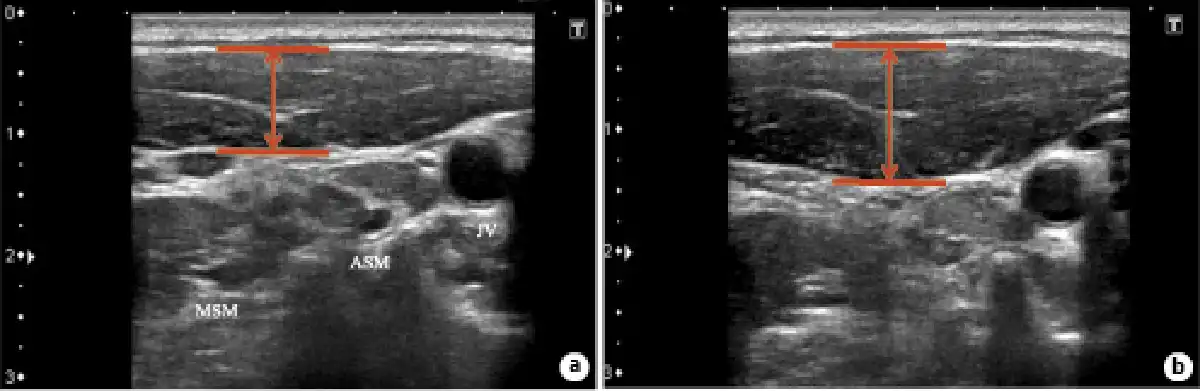
Fig. 1
Representative image of the right SCM thickness. The transducer was placed lateral to the anterior neck and parallel to the middle of the SCM. A two-dimensional US image of the right hemi-SCM (B-mode) at end-expiration (a) and end-inspiration (b). ASM, anterior scalene muscle; MSM, middle scalene muscle; JV, jugular vein.
All subjects underwent cardiopulmonary exercise testing (CPET) on a bicycle ergometer according to the ramp 10-W protocol (load increase of 10 W per 1 min − 1 W per 6 s). The 10-point Borg scale was used to assess the intensity of dyspnea, and leg fatigue was determined at 1-min intervals during both exercise and rest []. Data analysis included the following: intensity of exercise (workload; W), peak oxygen consumption (peak VO2; mL/min/kg), and ventilation equivalents for oxygen (VE/VO2) and carbon dioxide (VE/VCO2). IC maneuvers were performed at rest, at 1-min intervals, and during peak exercise. We considered the change in IC ([INCREMENT]IC) during exercise as a surrogate parameter of the change in DLH [].
Spirometry (CHESTAC-800; Chest, Tokyo, Japan) was performed according to the 2019 American Thoracic Society recommendations [] for measuring forced vital capacity, forced expiratory volume in 1 s (FEV1), and IC. The respiratory muscle strength was assessed by measuring the maximum inspiratory pressure (MIP) generated against an occluded airway at residual volume [] (SP-370; Fukuda Denshi, Tokyo, Japan). The quadriceps muscle strength was measured using a hand-held dynamometer (μTasF-1; Anima Corp., Tokyo, Japan).
Statistical Analysis
All results are expressed as means ± SDs. Student’s t test was used to compare the data of patients with COPD to those of healthy controls. The relationship between the end-expiration SCM thickness, SCM TF (end-expiration to end-inspiration and end-expiration to resting inspiration), and the pulmonary function indexes (peak VO2, VE, VE/VO2, VE/VCO2, [INCREMENT]IC, and MIP) and muscle strength of the lower extremities were evaluated by calculating Pearson’s correlation coefficients. p values of <0.05 were considered statistically significant. Correlation coefficients <0.4 were considered to indicate weak correlations, those from 0.4 to 0.69 were considered to indicate moderate correlations, and those from 0.70 to 0.89 were considered to indicate strong correlations []. We performed a stepwise regression analysis to compute the final predictive model for the peak VO2. Only variables that were significantly correlated with exercise capacity were used as independent variables in the regression analysis.
The intraclass correlation coefficient (ICC) estimates and their 95% confidence intervals were calculated based on mean rating (k = 3), absolute agreement, and 2-way mixed-effects model []. The statistical analysis was performed using IBM SPSS statistics software, version 22 (IBM SPSS, Armonk, NY, USA).
Results
Table 1 summarizes the clinical characteristics of patients with COPD and control subjects. The FEV1 and IC were significantly lower in patients with COPD than in healthy control subjects (FEV1; 1.91 ± 0.60 L vs. 2.88 ± 0.39 L, p < 0.01, IC; 2.08 ± 0.5 L vs. 2.41 ± 0.38, p < 0.01), whereas the intergroup difference in forced vital capacity was not statistically significant. The peak VO2 was significantly lower in patients with COPD than in controls (13.6 ± 3.5 mL/min/kg vs. 20.2 ± 1.7 mL/min/kg, p < 0.01). The VE was significantly lower in patients with COPD than in controls (46.4 ± 11.1 L vs. 52.4 ± 11.7 L, p < 0.01). VE/VO2 and VE/VCO2 were significantly larger in patients with COPD than in controls (VE/VO2: 45.9 ± 7.1 mL/mL vs. 29.1 ± 3.6 mL/mL, p < 0.01; VE/VCO2: 47.1 ± 7.1 mL/mL vs. 29.3 ± 2.7 mL/mL, p < 0.01). The [INCREMENT]IC decreased during CPET in 44 of 44 patients with COPD, while the [INCREMENT]IC decreased in only 10 of the 20 control subjects. Therefore, the [INCREMENT]IC was significantly higher in patients with COPD than in controls (−0.43 ± 0.2 L vs. 0.05 ± 0.25 L, p < 0.01). The intensity of peak dyspnea (Borg scale) was significantly higher in patients with COPD than in controls (5 ± 1 vs. 2 ± 2, p < 0.01). The MIP was significantly lower in patients with COPD than in controls (53.2 ± 22.4 cm H2O vs. 84.6 ± 21.9 cm H2O, p < 0.01). The SCM thickness was biggest at end-inspiration and smallest at end-expiration in patients with COPD and controls (Fig. 2). The SCM was significantly thinner in patients with COPD than in controls at end-expiration (0.58 ± 0.1 cm vs. 0.78 ± 0.15 cm, p < 0.01). In contrast, the SCM TF from end-expiration to resting inspiration was significantly greater in patients with COPD than in control subjects (29.3% ± 18.4% vs. 7.6% ± 8.4%, p < 0.01; Table 2). The increase in the SCM TF from end-expiration to end-inspiration in patients with COPD was not significantly higher than that in control subjects (51.7% ± 19.6% vs. 51.3% ± 12.3%, p > 0.99; Table 2).
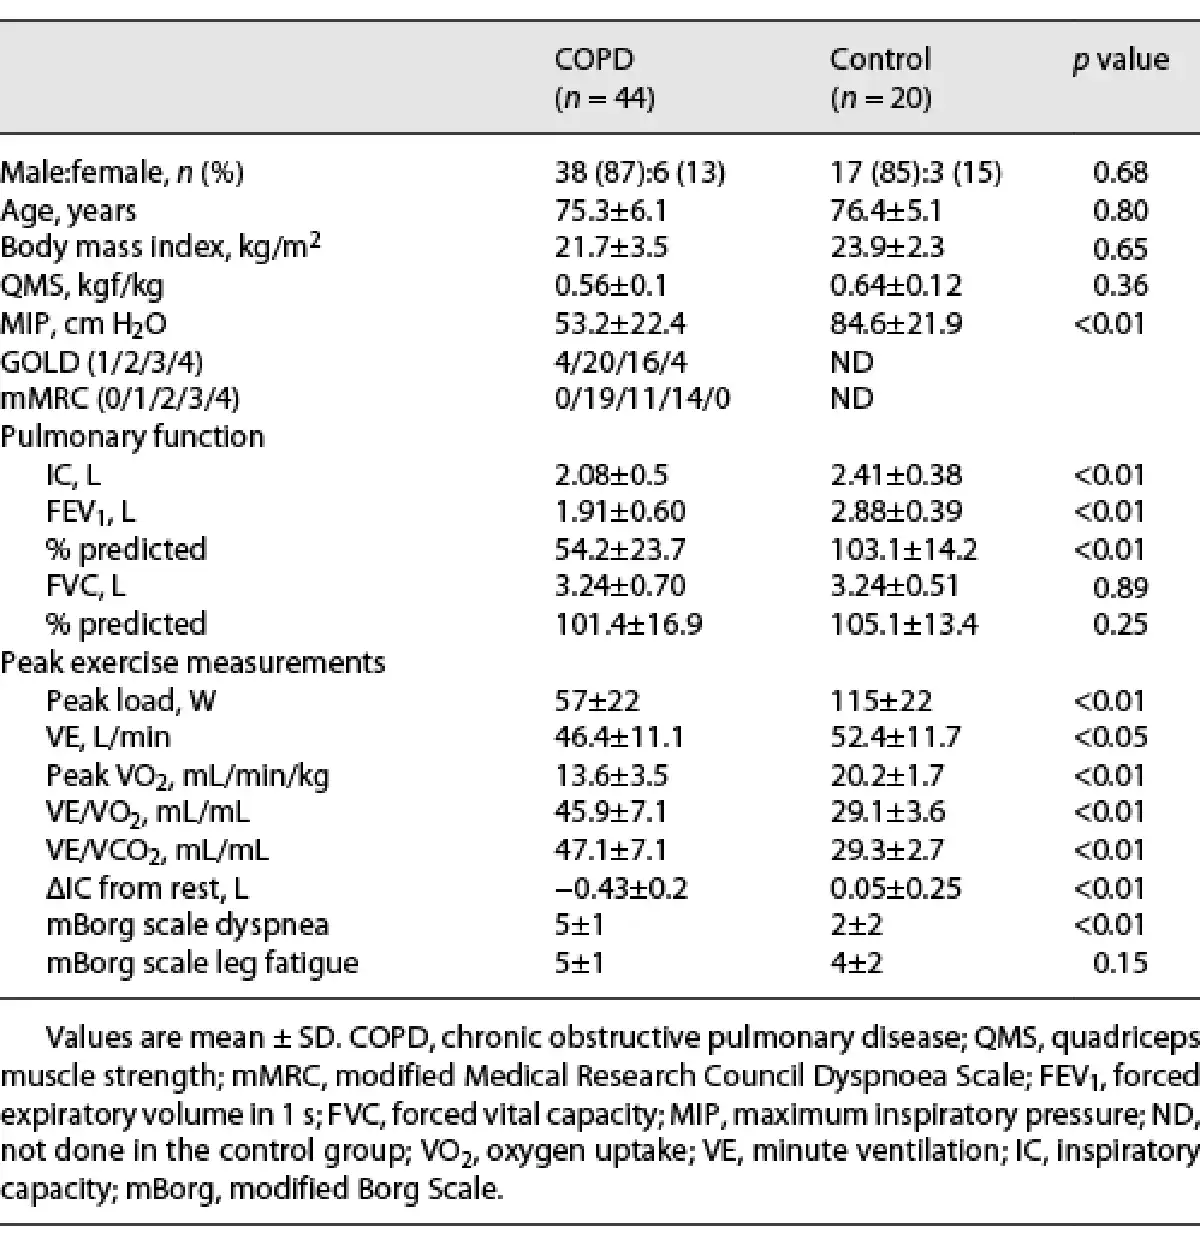
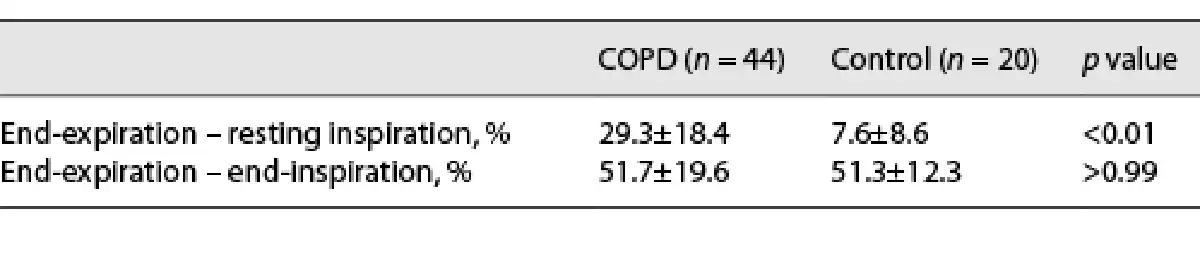
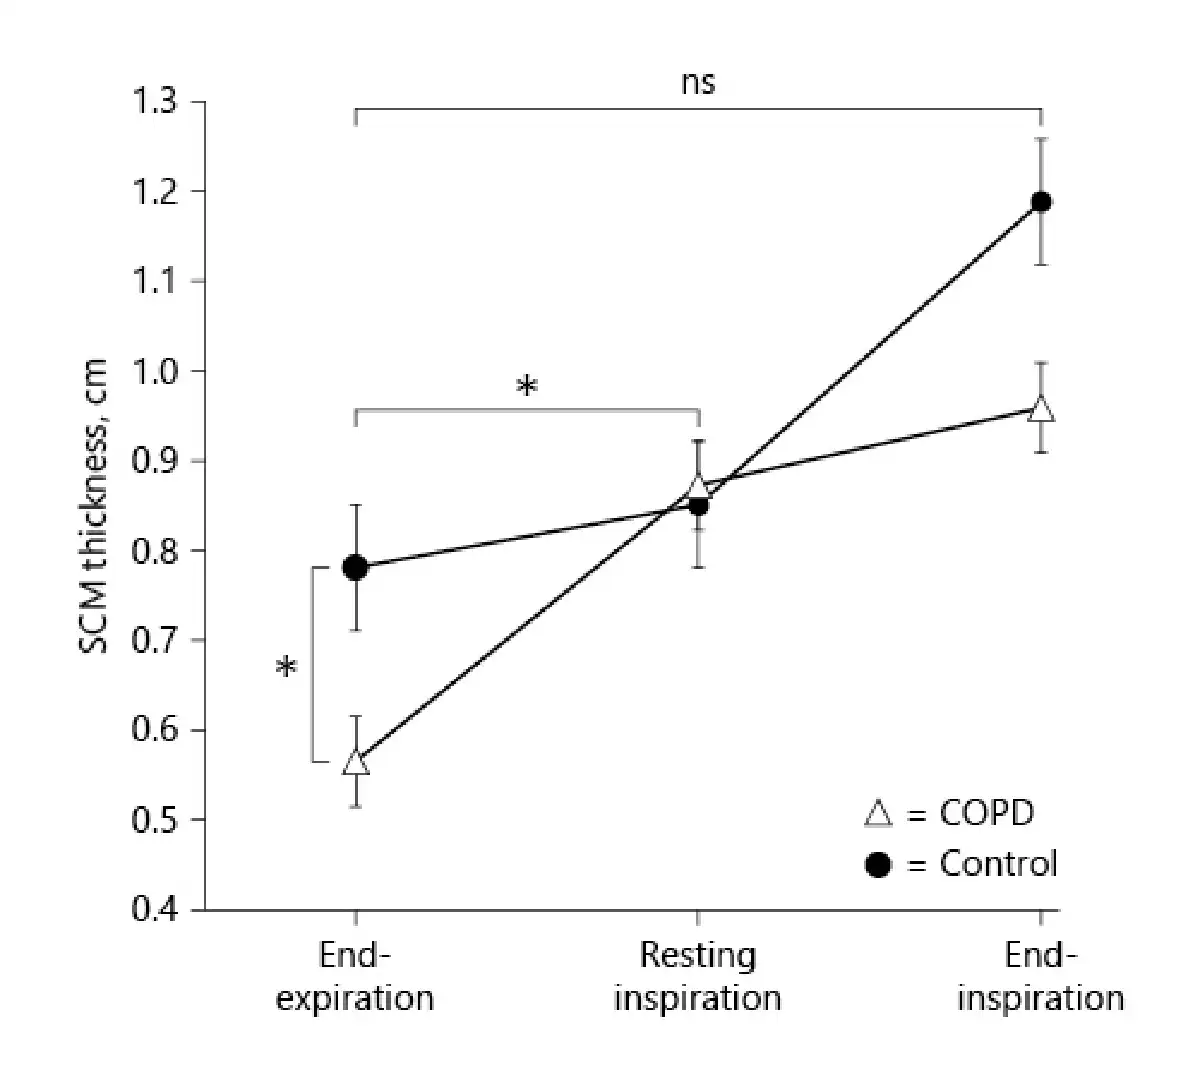
Fig. 2
SCM thickness in patients with COPD (n = 44) and control subjects (n = 20). The SCM thickness was greatest at end-inspiration and lowest at end-expiration in both patients with COPD (closed circle) and control subjects (open triangle). The SCM thickness did not differ significantly between the two groups during relaxed, resting inspiration. The SCM was significantly thinner in patients with COPD than in controls at end-expiration. In contrast, the SCM TF from end-expiration to resting inspiration was significantly greater in patients with COPD than in control subjects. The increase in the SCM TF from end-expiration to end-inspiration in patients with COPD did not differ significantly from that in control subjects. *p < 0.01.
The SCM Thickness at End-Expiration
With respect to the ventilation parameters during CPET, the peak VO2 was moderately positively correlated with the SCM thickness at end-expiration in patients with COPD (r = 0.58, p < 0.01; Table 3). The SCM thickness at end-expiration and the VE in patients with COPD showed a moderately positive significant correlation (r = 0.55, p < 0.01; Table 3). VE/VO2 and VE/VCO2 had significantly moderate negative correlations with the SCM thickness at end-expiration in patients with COPD (r = −0.51, p < 0.01 and r = −0.54, p < 0.01, respectively; Table 3). The ΔIC, which reflects DLH, had a significant moderate positive correlation with the SCM thickness at end-expiration in patients with COPD (r = 0.52, p < 0.01, Table 3). Regarding the pulmonary function parameters, the IC (r = 0.51, p < 0.01; Table 3; online suppl. Fig. S1; see http://www.karger.com/doi/10.1159/000527100 for all online suppl. material) and predicted FEV1% (r = 0.46, p < 0.05; Table 3; online suppl. Fig. S2) were positively correlated with the SCM thickness at end-expiration in patients with COPD. Moreover, the SCM thickness at end-expiration positively correlated with the MIP (r = 0.49, p < 0.05; online suppl. Fig. S3) and BMI (r = 0.39, p < 0.05; online suppl. Fig. S4).
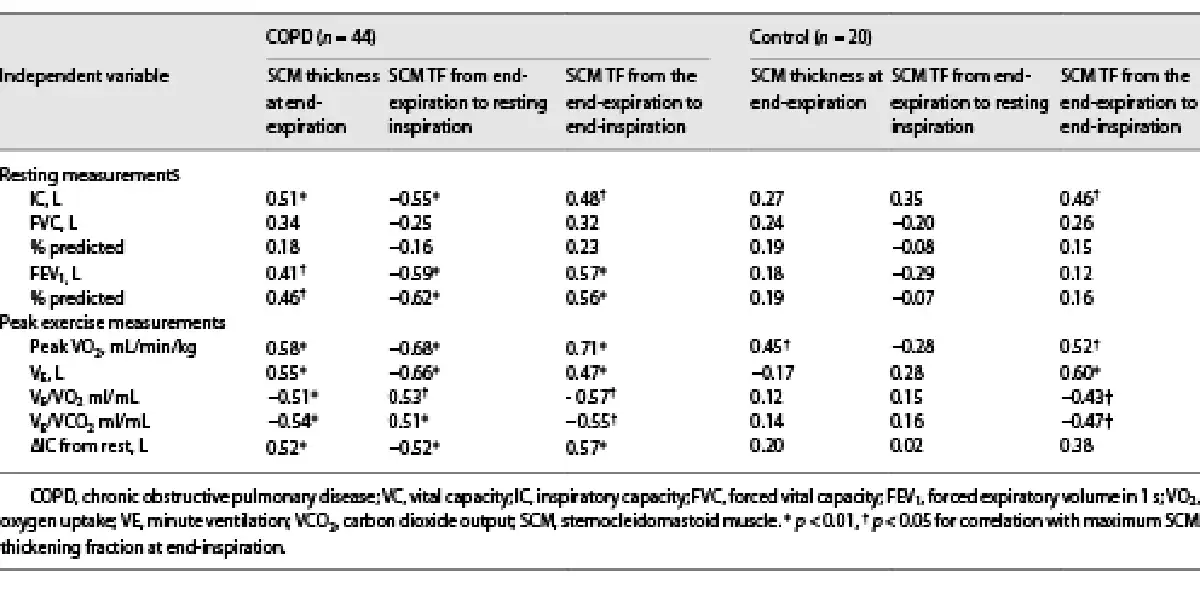
SCM TF from End-Expiration to Resting Inspiration
The ventilation parameters during CPET revealed a significantly negative moderate correlation between the peak VO2 with the SCM TF from end-expiration to resting inspiration (r = −0.68, p < 0.01; Table 3). VE had a significantly moderate negative correlation with the SCM TF from the end of expiration to the resting inspiration in patients with COPD (r = −0.66, p < 0.01; Table 3). VE/VO2 and VE/VCO2 had significantly positive moderate correlation with the SCM TF from end-expiration to resting inspiration in patients with COPD (r = 0.53, p < 0.05 and r = 0.51, p < 0.05, respectively; Table 3). The ΔIC, which reflects DLH, had a significant negative moderate correlation between the ΔIC and the SCM TF from end-expiration to resting inspiration in patients with COPD (r = −0.52, p < 0.01; Table 3). The predicted FEV1 had a significantly negative moderate correlation with the SCM TF from end-expiration to resting inspiration in patients with COPD (r = −0.62, p < 0.01; Table 3). In patients with COPD, the IC had a significantly negative moderate correlation with the SCM TF from the end-expiration to resting inspiration (r = −0.55, p < 0.01). SCM thickness at end-expiration had a significantly negative correlation with the SCM TF from end-expiration to resting inspiration in patients with COPD (r = −0.62, p < 0.01; online suppl. Fig. 5S).
CM TF from the End-Expiration to End-Inspiration
In patients with COPD, the IC had a significantly positive moderate correlation with the SCM TF from the end-expiration to the end-inspiration (r = 0.48, p < 0.05; Table 3). In control subjects, the IC had a significantly positive moderate correlation with the SCM TF from the end-expiration to the end-inspiration (r = 0.46, p < 0.05). The predicted FEV1 had a significantly positive moderate correlation with the SCM TF from the end-expiration to the end-inspiration in patients with COPD (r = 0.57, p < 0.01; Table 3). With respect to the ventilation parameters during CPET, the peak VO2 was strongly positively correlated with the SCM TF from end-expiration to end-inspiration in patients with COPD (r = 0.71, p < 0.01; Table 3; Fig. 3a). In the control subjects, the peak VO2 had a significant moderate positive correlation with the SCM TF from the end-expiration to the end-inspiration (r = 0.52, p < 0.05; Table 3; Fig. 3b). VE had a significantly moderate positive correlation with the SCM TF from the end-expiration to the end-inspiration in patients with COPD (r = 0.47, p < 0.05; Table 3). VE/VO2 and VE/VCO2 had significantly moderate negative correlations with the SCM TF from the end-expiration to the end-inspiration in patients with COPD (r = 0.47, p < 0.05; r = −0.57, p < 0.05; and r = −0.55, p < 0.05, respectively; Table 3). In contrast, VE had significantly positive moderate correlations with the SCM TF from the end-expiration to the end-inspiration in the control subjects (r = 0.60, p < 0.05). The VE/VO2 and VE/VCO2 had significantly negative moderate correlations with the SCM TF from the end-expiration to the end-inspiration in the control subjects (r = −0.43, p < 0.05 and r = −0.47, p < 0.05, respectively; Table 3). The ΔIC, which reflects DLH, had a significant moderate positive correlation with the SCM TF from end-expiration to end-inspiration in patients with COPD (r = 0.57, p < 0.01, Table 3; Fig. 4). In patients with COPD, the predicted FEV1 had a significant positive moderate correlation with the SCM TF from the end-expiration to the end-inspiration (r = 0.56, p < 0.01; Table 3).
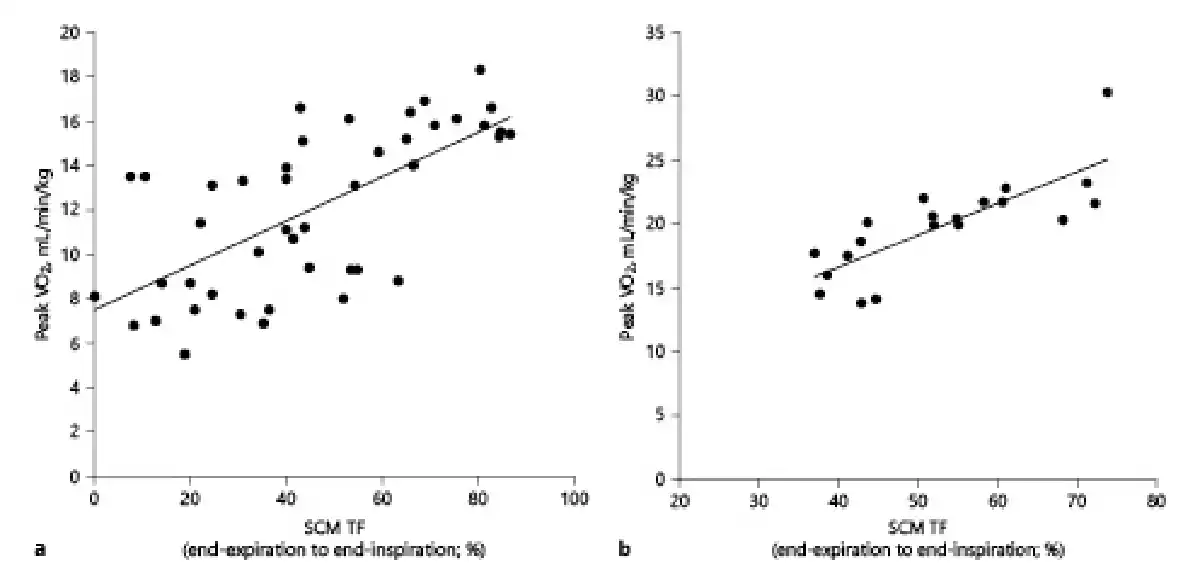
Fig. 3
Correlation between the maximum SCM TF from the end-expiration to end-inspiration, and peak VO2 in patients with COPD (n = 44) (a) and healthy controls (n = 20) (b). The peak VO2, which reflects exercise capacity, had a significant positive correlation with the SCM thickness in both patients with COPD (r = 0.71, p < 0.01) (a) and control subjects (r = 0.52, p < 0.05) (b). Peak VO2, peak oxygen consumption.
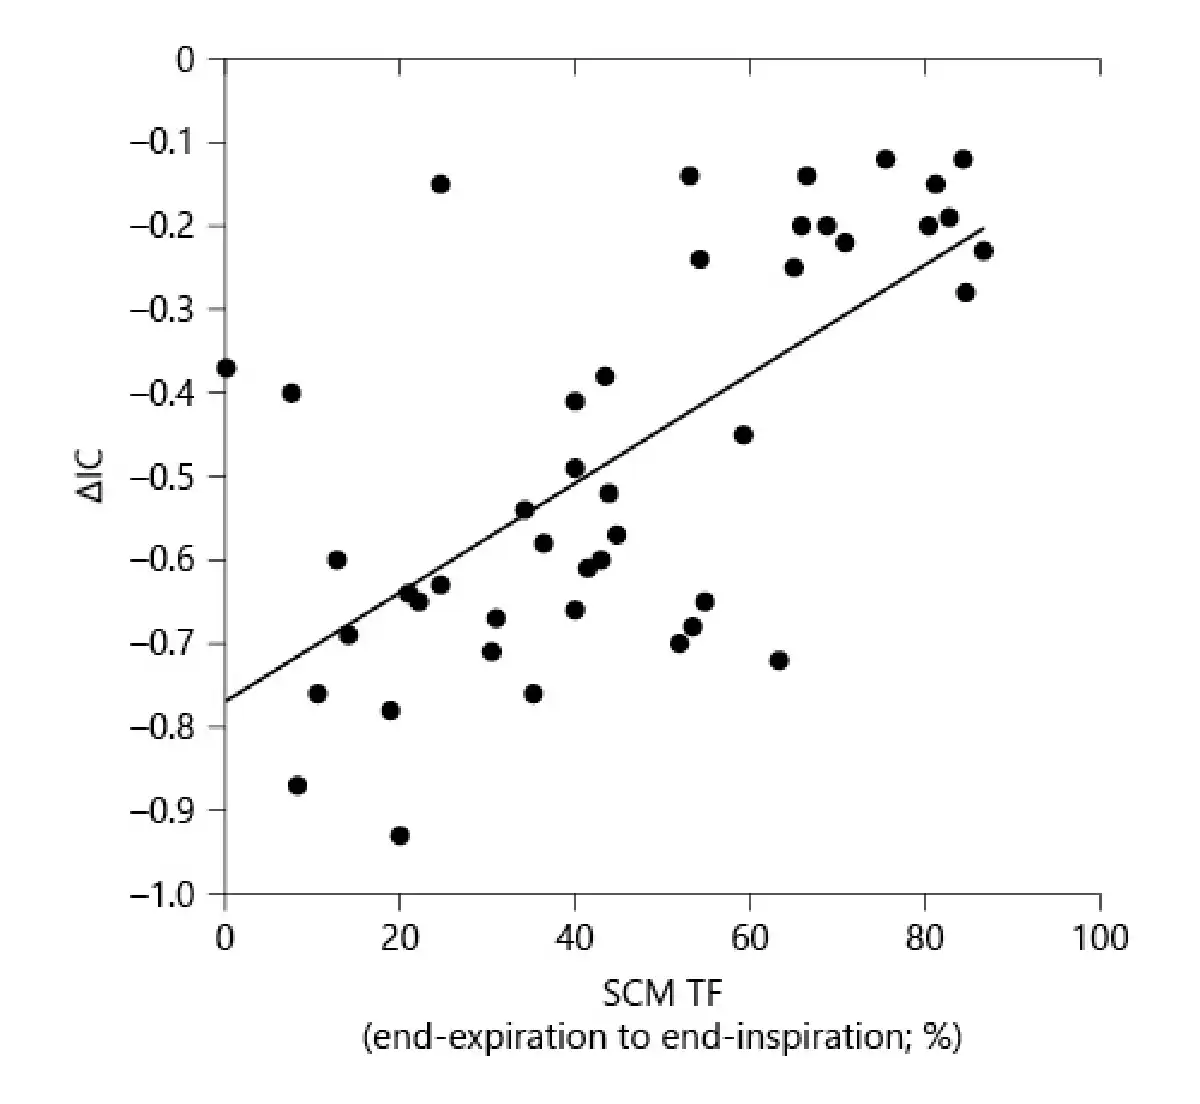
Fig. 4
Correlation between the maximum SCM TF from the end-expiration to end-inspiration and [INCREMENT]IC, which reflects the DLH, in patients with COPD (n = 44). [INCREMENT]IC, which reflects exercise capacity, was significantly positively correlated with the SCM thickness in patients with COPD (r = 0.57, p < 0.01). IC, inspiratory capacity.
A Multiple Regression Analysis
A multiple regression analysis was performed with the peak VO2 as the dependent variable and the SCM TF at end-expiration to end-inspiration, IC, predicted FEV1, and BMI, as independent variables, revealing that the SCM TF from end-expiration to end-inspiration was the most independent explanatory variable (β = 0.54, SE = 0.016, p < 0.01; online suppl. Table 1S).
The Intra-Rater Reliability of the SCM Thickness Measured Using US
The intra-rater reliability of the SCM thickness measurement using US was calculated as follows: end-expiration: ICC (3, k) = 0.94; resting inspiration: ICC (3, k) = 0.88; and end-inspiration: ICC (3, k) = 0.92. These results indicate good reproducibility (online suppl. Table 2S).
Discussion
The results of this study suggest that SCM TF increased with end-expiration to resting inspiration in patients with COPD compared with control subjects; however, there was little change in the SCM TF with end-expiration to end-inspiration. The SCM thickness and SCM TF correlated with exercise tolerance in both patients with COPD and healthy controls. Patients with COPD are often limited in their activities due to dyspnea, which is mainly caused by static and dynamic hyperinflation (DH). DH results in functional inspiratory muscle weakness by maximally shortening the muscle fibers in the diaphragm []. The diaphragm becomes flattened by DH and is unable to ensure adequate ventilation, leading to the recruitment of the accessory respiratory muscles. SCM is activated during exercise when the activation threshold of more ventilation is needed []. Further, SCM function may be significant because it may be linked to exercise tolerance in patients with COPD. This is the first study to demonstrate that decreased SCM thickness (end-expiration) and SCM TF (end-expiration to resting inspiration and end-expiration to end-inspiration) were associated with a decreased exercise capacity in patients with COPD. We also found that reduced SCM TF from end-expiration to resting inspiration is associated with higher peak VO2.
The peak VO2 and IC from rest had positive correlations with SCM thickness measured at end-expiration, negative correlations with VE/VO2 and VE/VCO2. This may imply that more power can be generated by less atrophied SCMs, improving ventilation, increasing ventilation efficiency, and leading to fewer changes in IC during exercise (also considering the moderate positive correlation between SCM thickness at end-expiration and MIP). Previous reports have demonstrated that the resting IC reflects the resting end-expiratory lung volume (EELV), and the main determinants of the IC are the strength of the inspiratory muscles and the combined elastic properties of the lung and chest wall in patients with COPD []. The decline in the resting IC was associated with a decrease in ventilation during exercise []. Therefore, SCM thickness assessment may be associated with ventilatory limitations during exercise. The validity of the US-determined muscle thickness has been demonstrated by its high correlation with actual measurements using MRI []. In patients with COPD, the SCM thickness at end-expiration was correlated with the MIP. To our knowledge, there are no reports on the correlation between the SCM thickness and MIP in patients with COPD yet. A larger SCM thickness at end-expiration can potentially produce a higher force to help expand the chest. In other words, decreased contractions of the SCM may limit ventilation during exercise.
The SCM TF from end-expiration to resting inspiration was significantly higher in patients with COPD than in control subjects. However, the SCM TF from the end-expiration to end-inspiration was not different between the two groups. SCM activity can be seen in respiratory distress of any etiology; however, its activity is mainly seen in patients with COPD []. A negative correlation between SCM thickness at end-expiration and SCM TF from end-expiration to resting inspiration may suggest that patients with more atrophied SCM are also using SCM more in resting condition. SCM TF from end-expiration to resting inspiration was also negatively correlated to peak VO2. As a possible application in clinical practice, the assessment of SCM thickness at end-expiration might allow for the identification of the most deconditioned COPD patients (who are maybe not engaging in physical activity and/or exercise, thus not using the SCM to satisfy higher ventilatory requirements). However, it is not clear whether there is an association between SCM thickness at end-expiration and physical activity or exercise in patients with COPD.
Additionally, the VE, VE/VO2, and VE/VCO2 were positively correlated with the SCM TF from end-expiration to resting inspiration in patients with COPD. These results suggest that patients with COPD had a reduced ventilation efficacy, and a reduced SCM thickness may result in a reduced ventilation efficacy. This study revealed that such patients may end up using their SCM even when resting, thereby wasting their reserve exercise capacity in the process.
In patients with COPD, ΔIC, which reflects DLH, demonstrated a significant negative moderate correlation with the SCM TF from end-expiration to resting inspiration. This finding conflicts with earlier research, which demonstrated that SCM is primarily engaged at large lung volumes and in the presence of increased ventilatory requirements. The FEV1 (% predicted) was negatively correlated with the SCM TF from the end-expiration to the resting inspiration in patients with COPD. Additionally, previous studies have reported that the use of accessory respiratory muscles indicates severe disease (GOLD stage IV) [, ]. These results may suggest that patients using SCM at rest are also characterized by severe airflow limitation and also may be partially consistent with previous studies since this study was mainly GOLD 2–3. In this study, most patients with COPD had mild to moderate disease; however, the SCM TF at resting ventilation significantly differed between patients with COPD and control subjects.
Patients with COPD showed a positive correlation between their peak VO2 and the SCM TF from end-expiration to end-inspiration. The SCM TF from the end-expiration to the end-inspiration was the most promising factor for predicting exercise tolerance through multiple regression analysis. Poor exercise tolerance in patients with COPD is primarily caused by DLH []. Therefore, objective measurements that reflect the level of DLH and ventilation efficiency may be helpful when considering the role that DLH plays in the emergence of poor exercise tolerance in patients with COPD. Additionally, it may reflect the higher capacity of SCM to contract at higher lung volumes during exercise, reflecting higher contractility during a forced inspiratory maneuver, ensuring higher ventilatory capacity and exercise tolerance. Therefore, SCM TF measurement may be important for individualized assessment of exercise intolerance in patients with COPD. Measurements, such as the FEV1, are not useful in predicting the cardinal symptoms of exercise intolerance []. Therefore, the SCM TF assessment may be a more predictive indicator of exercise tolerance during exercise than pulmonary function measurements.
There are some limitations to this study that should be highlighted. First, this study was conducted at a single center on a relatively small number of subjects and might have been underpowered in some statistical analyses. However, the number of subjects was sufficient for the primary outcome, which was to compare the mean SCM thickness (end-expiration) and SCM TF (end-expiration to resting inspiration and end-expiration to end-inspiration) between patients with COPD and control subjects. Static hyperinflation is defined by an increase in the EELV at rest accompanied by a decreased IC (the volume of air accumulated in the lungs from end-expiration to full inspiration). Patients with COPD have an elevated resting EELV caused by an increase in airway resistance due to airway inflammation and airway wall thickening and/or the reduced lung elastic recoil due to alveolar destruction and emphysema. The DH is defined by a further increase in the EELV associated with elevations in the respiratory rate, as it occurs during exercise []. In severe COPD, this DH is superimposed on top of the already-existing static hyperinflation, leading to a significantly reduced IC. However, we did not measure the EELV in most of our study participants, including patients with COPD and control subjects; therefore, we could not evaluate the association between the EELV and the SCM thickness at the point of expiration and SCM TF. To the best of our knowledge, there is no standardized approach for the measurement of the SCM thickness. From ICC data, the SCM TF can be evaluated using US, with good reproducibility. We measured the SCM thickness in the standing position in this study; however, the results may be different in other positions, including the supine position. Further studies are warranted to clarify the effect of body position on the SCM TF.
The present results show that SCM TF is a readily available alternative for predicting exercise tolerance in COPD. In clinical settings, this objective SCM measurement has additional advantages as it requires minimum effort in patients and can be applied at home if portable US is used.
Conclusion
In conclusion, the SCM was significantly thinner in patients with COPD than in control subjects. Furthermore, the SCM TF was correlated with exercise tolerance in both patients with COPD and healthy controls. Contractility of SCM may influence the ability of patients with COPD to maintain ventilatory requirements during exercise.
Statement of Ethics
This was a single-center, observational, cross-sectional study. The study was approved by the Ethics Committee of the Kindai University School of Medicine (approval no. 31-086), and all participants gave their written informed consent.
Conflict of Interest Statement
Dr. Tohda received personal fees from Kyorin Pharmaceutical, Co., Ltd.; Teijin Pharma Co., Ltd.; Kyorin Pharmaceutical Co., Ltd.; Meiji Seika Pharma Co., Ltd.; Boehringer Ingelheim Co., Ltd.; Daiichi Sankyo Co., Ltd.; and Astellas, Pearl Therapeutics, Inc., outside the submitted work. The other authors have no conflicts of interest to declare.
Funding Sources
This work was supported by Grants-in-Aid for Scientific Research (21K11325).
Author Contributions
Masashi Shiraishi: conceptualization (lead), data curation (lead), formal analysis (lead), investigation (lead), methodology (lead), project administration (lead), resources (lead), software (lead), validation (lead), visualization (lead), writing – original draft (lead), and writing – review and editing (lead). Yuji Higashimoto: data curation (equal), methodology (equal), writing – original draft (equal), and writing – review and editing (equal). Ryuji Sugiya, Hiroki Mizsawa, and Yu Takeda: data curation (supporting) and writing – review and editing (supporting). Shuhei Fujita, Osamu Nishiyama, and Shintarou Kudo: methodology (supporting) and writing – review and editing (supporting). Tamotsu Kimura: methodology (supporting), validation (supporting), software (supporting), and writing – review and editing-Supporting. Kanji Fukuda: funding acquisition (supporting), supervision (supporting), writing – review and editing (supporting). Yuji Tohda: funding acquisition (lead), supervision (lead), and writing – review and editing (supporting).
Data Availability Statement
All data generated or analyzed during this study are included in this article and its online supplementary material. Further inquiries can be directed to the corresponding author.
References
- 1. Global initiative for chronic obstructive lung disease (gold). <X00_Journal>Global strategy for the diagnosis, management, and prevention of chronic obstructive pulmonary disease:</X00_Journal><X00_Journal> 2020 report</X00_Journal>. https://goldcopd.org/gold-reports/ (last accessed January, 20 2020).
- 2. Calverley PMA, Koulouris NG. Flow limitation and dynamic hyperinflation: key concepts in modern respiratory physiology. <X00_Journal>Eur Respir J</X00_Journal>. 2005;25(1):186–99.
- 3. Gagnon P, Guenette JA, Langer D, Laviolette L, Mainguy V, Maltais F, et al. Pathogenesis of hyperinflation in chronic obstructive pulmonary disease. <X00_Journal>Int J Chron Obstruct Pulmon Dis</X00_Journal>. 2014;9:187–201.
- 4. Stubbing DG, Mathur PN, Roberts RS, Campbell EJ. Some physical signs in patients with chronic airflow Obstruction. <X00_Journal>Am Rev Respir Dis</X00_Journal>. 1982 May;125(5):549–52.
- 5. Rossi A, Aisanov Z, Avdeev S, Di Maria G, Donner CF, Izquierdo JL, et al. Mechanisms, assessment and therapeutic implications of lung hyperinflation in COPD. <X00_Journal>Respir Med</X00_Journal>. 2015;109(7):785–802.
- 6. Gandevia SC, Leeper JB, McKenzie DK, De Troyer A. Discharge frequencies of parasternal intercostal and scalene motor units during breathing in normal and COPD subjects. <X00_Journal>Am J Respir Crit Care Med</X00_Journal>. 1996 Feb;153(2):622–8.
- 7. Gayan-Ramirez G, Decramer M. Chapter 3: The respiratory muscles. <X00_Journal>Fishman’s pulmonary diseases and disorders</X00_Journal>. 5th ed. New York: McGraw-Hill Education; 2015.
- 8. De Troyer A, Estenne M. Coordination between rib cage muscles and diaphragm during quiet breathing in humans. <X00_Journal>J Appl Physiol Respir Environ Exerc Physiol</X00_Journal>. 1984;57(3):899–906.
- 9. Laveneziana P, Albuquerque A, Aliverti A, Babb T, Barreiro E, Dres M, et al. ERS statement on respiratory muscle testing at rest and during exercise. <X00_Journal>Eur Respir J</X00_Journal>. 2019;53(6):1801214.
- 10. Miyatani M, Kanehisa H, Ito M, Kawakami Y, Fukunaga T. The accuracy of volume estimates using ultrasound muscle thickness measurements in different muscle groups. <X00_Journal>Eur J Appl Physiol</X00_Journal>. 2004;91(2–3):264–72.
- 11. Laursen CB, Clive A, Hallifax R, Pietersen PI, Asciak R, Davidsen JR, et al. European Respiratory Society statement on thoracic ultrasound. <X00_Journal>Eur Respir J</X00_Journal>. 2021;57(3):2001519.
- 12. Arts IMP, Pillen S, Schelhaas HJ, Overeem S, Zwarts MJ. Normal values for quantitative muscle ultrasonography in adults. <X00_Journal>Muscle Nerve</X00_Journal>. 2010 Jan;41(1):32–41.
- 13. Borg GAV. <X00_Journal>Psychophysical bases of perceived exertion</X00_Journal>; 1982. p. 377–81.
- 14. O’Donnell DE, Laveneziana P. Physiology and consequences of lung hyperinflation in COPD. <X00_Journal>Eur Respir Rev</X00_Journal>. 2006;15(100):61–7.
- 15. Graham BL, Steenbruggen I, Miller MR, Barjaktarevic IZ, Cooper BG, Hall GL, et al. Standardization of spirometry 2019 update an official American Thoracic Society and European Respiratory Society technical statement. <X00_Journal>Am J Respir Crit Care Med</X00_Journal>. 2019;200(8):e70–88.
- 16. American Thoracic Society/European Respiratory Society; Whitelaw W, Siafakas N, Supinski GS, Fitting JW, Bellemare F, et al. ATS/ERS Statement on respiratory muscle testing. <X00_Journal>Am J Respir Crit Care Med</X00_Journal>. 2002;166(4):518–624.
- 17. Schober P, Boer C, Schwarte LA. Correlation coefficients: appropriate use and interpretation. <X00_Journal>Anesth Analg</X00_Journal>. 2018 May;126(5):1763–8.
- 18. Koo TK, Li MY. A guideline of selecting and reporting intraclass correlation coefficients for reliability research. <X00_Journal>J Chiropr Med</X00_Journal>. 2016;15(2):155–63.
- 19. Laghi F, Tobin MJ. Disorders of the respiratory muscles. <X00_Journal>Am J Respir Crit Care Med</X00_Journal>. 2003;168(1):10–48.
- 20. O’Donnell DE, Elbehairy AF, Webb KA, Neder JA; Canadian Respiratory Research Network. The link between reduced inspiratory capacity and exercise intolerance in chronic obstructive pulmonary disease. <X00_Journal>Ann Am Thorac Soc</X00_Journal>. 2017;14(Suppl 1):S30–9.
- 21. O’Donnell DE, Guenette JA, Maltais F, Webb KA. Decline of resting inspiratory capacity in COPD: the impact on breathing pattern, dyspnea, and ventilatory capacity during exercise. <X00_Journal>Chest</X00_Journal>. 2012 Mar;141(3):753–62.
- 22. Sarkar M, Bhardwaz R, Madabhavi I, Modi M. Physical signs in patients with chronic obstructive pulmonary disease. <X00_Journal>Lung India</X00_Journal>. 2019 Jan–Feb;36(1):38–47.
- 23. O’Neill S, McCarthy DS. Postural relief of dyspnoea in severe chronic airflow limitation: relationship to respiratory muscle strength. <X00_Journal>Thorax</X00_Journal>. 1983;38(8):595–600.
- 24. Foglio K, Carone M, Pagani M, Bianchi L, Jones PW, Ambrosino N. Physiological and symptom determinants of exercise performance in patients with chronic airway obstruction. <X00_Journal>Respir Med</X00_Journal>. 2000 Mar;94(3):256–63.
- 25. Klooster K, ten Hacken NHT, Hartman JE, Sciurba FC, Kerstjens HAM, Slebos DJ. Determining the role of dynamic hyperinflation in patients with severe chronic obstructive pulmonary disease. <X00_Journal>Respiration</X00_Journal>. 2015;90(4):306–13.